Search Market Research Report

Discover Our Latest Reports
Discover Our Featured Reports
Discover Top Selling Reports

Waste To Energy Market Size, Share Global Analysis Report, 2022 – 2028

report img

Waste To Energy Market By Technology (Biochemical, Thermal, and Others), and By Region - Global Industry Insights, Growth, Size, Share, Comparative Analysis, Trends and Forecast 2022 – 2028

Industry Insights

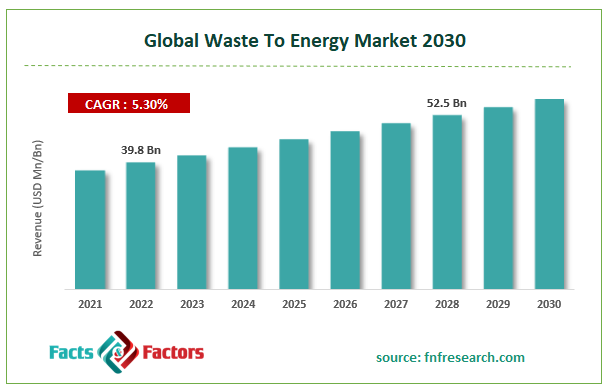
[215+ Pages Report] According to Facts and Factors, the global waste to energy market was worth USD 39.8 billion and is anticipated to be worth USD 52.5 billion by 2028, expanding at a CAGR of 5.3% over the projected period. This market report provides a thorough examination of the industry. The report examines key aspects, developments, drivers, constraints, the market segments, and the competitive landscape in depth.

waste-to-energy-market-size

To know more about this report | Request Free Sample Copy

logoMarket Overview

Waste to energy (WtE) or energy from waste (EfW) is a method of energy recovery that is used to generate energy in the form of heat and light through the principal treatment of waste. Most of these techniques aid in the direct generation of heat or electricity via thermal combustion or the generation of a combustible fuel commodity such as synthetic fuels, methane, methanol, and ethanol, among others.

logoCOVID-19 Impact:

The COVID-19 outbreak has impacted economic growth by delaying the operational processes of key sectors like recycling waste and energy generation. The industries are closed tight or operate under restricted conditions, such as fewer employees and shorter working hours. Many countries, including the United States, Spain, China, Poland, Austria, India, Korea, Germany, the United Kingdom, France, and Italy, declared a state of emergency.

The pandemic caused a labor and raw material shortage in the recycling and energy generation industries. The magnitude of the impact may force the closure of some waste-to-energy producers. Manufacturers' production was halted due to a labor shortage. As a result, production output was reduced, resulting in economic losses.

logo Growth Drivers

  • Heat and power generation from waste to drive market growth

Waste to energy is an effective and sustainable waste treatment method that generates heat that can be used to generate electricity. These waste-to-energy plants can reduce waste by 94 to 95% while keeping it out of landfills. These plants provide numerous advantages and destroy contaminated medical disposals and other harmful garbage. Waste to energy technology has several advantages, including the production of heat & power, effective waste management, the reduction of waste, the prevention of the production of methane gas & hazardous greenhouse gases, and greater control over sound & odor during the process of decomposition, limited pollution, no groundwater contamination, effectiveness in metal recycling, and others. All of these advantages are expected to drive the global waste to energy market demand during the forecast period.

logo Restraints

  • The high installation costs of waste to energy plants will limit market growth

The construction of waste-to-energy plants, particularly incineration plants, is expensive because it includes the cost of necessary infrastructure, operational costs, waste disposal & segregation costs, and other expenses. Furthermore, trained personnel and dedicated employees are required to manage incinerator plants because they require regular maintenance, which is expected to impede market growth during the forecast period.

logo Opportunities

  • Waste to energy has the potential to replace coal, which is expected to create massive opportunities

Using municipal solid waste to generate energy for energy plants is a more efficient and cost-effective option than coal power plants. The use of coal to generate electricity transmits harmful gases such as nitrogen oxides, sulfur dioxide, and hydrogen chloride, as well as toxic trace elements such as mercury, lead, and cadmium. On average, waste to energy plants can burn up to 320 million tons of garbage per year, which is then used to generate electricity. This reduces the demand for coal plants and other fossil fuels, which are nonrenewable energy sources. Furthermore, because these plants trap dioxin, they prevent the emission of hazardous compounds such as dioxin, which is expected to create excellent growth opportunities for the global waste to energy market during the forecast period.

logoSegmentation Analysis

The global waste to energy market is segmented on the basis of technology and region.

By technology, the market is divided into biochemical, thermal, and others. The thermal method involves the high-temperature recyclable materials of energy from MSW. Thermal technology encompasses a variety of processes, including combustion or incineration, gasification, and pyrolysis. The main distinction between these technological innovations is the O2 and temperature associated with the process that gives rise to the conversion to final products, water, and CO2, or to intermediate useful products.

During the forecast period, the incineration segment is expected to grow at a rapid pace. Increased waste generation around the world significantly drives global demand for incineration processes. Because incinerators can treat all types of waste, this method is far superior to other thermal waste treatment techniques.

logoReport Scope

Report Attribute

Details

Market Size in 2021

USD 39.8 Billion

Projected Market Size in 2028

USD 52.5 Billion

CAGR Growth Rate

5.3% CAGR

Base Year

2021

Forecast Years

2022-2028

Key Market Players

China Everbright International Limited, Ramboll Group A/S, Hitachi Zosen Inova AG, Wheelabrator Technologies Inc, Veolia, Xcel Energy Inc., Covanta Holding Corporation, Babcock & Wilcox Enterprises, Inc., Suez, Abu Dhabi National Energy Company PJSC., and Others

Key Segment

By Technology, and By Region

Major Regions Covered

North America, Europe, Asia Pacific, Latin America, and the Middle East & Africa

Purchase Options

Request customized purchase options to meet your research needs. Explore purchase options

logoRegional Landscape

  • The market in the Asia Pacific region is expected to expand rapidly

Among the regions in the global waste to the energy market, Asia Pacific was worth USD 17.5 billion in 2020 and is expected to be worth USD 26 billion by 2028, with a CAGR of 5.3%. The increasing population and the influx of immigrants to cities result in a large amount of waste being produced on a daily basis. Furthermore, the COVID-19 outbreak has seriously affected countries such as China and India, resulting in panicked buying of goods, an increase in single-use products, and the deposition of large amounts of medical waste, which contributes to plastic pollution.

As a result, Shenzhen, one of China's largest megacities, has built the world's largest waste-to-energy plant, capable of processing up to 5,500 tons of waste per day. Furthermore, China operates over 305 waste-to-energy plants, which efficiently manage waste and produce power. Similarly, Veolia, a waste management and energy services company in India, manages more than 91 waste to energy centers that treat municipal solid waste and produce electricity.

logoRecent Development

  • January 2021: The Indian state-controlled oil firm (IOC) and the North Delhi Municipal Corporation (NDMC) have collaborated to establish a waste-to-energy plant (WtE) at the NDMC's Ranikhera landfill site in New Delhi.
  • October 2021: The waste-to-energy plant in Kapuluppada, Andhra Pradesh, India, has been officially opened. The plant's capacity is approximately 15 MW, and it is entitled to receive 900 to 1000 tonnes of waste per day from the Greater Visakhapatnam Municipal Corporation.

logoCompetitive Landscape

Some of the key global waste to energy market players are

  • China Everbright International Limited
  • Ramboll Group A/S
  • Hitachi Zosen Inova AG
  • Wheelabrator Technologies Inc
  • Veolia
  • Xcel Energy Inc.
  • Covanta Holding Corporation
  • Babcock & Wilcox Enterprises Inc.
  • Suez
  • Abu Dhabi National Energy Company PJSC.

The global waste to energy market is segmented as follows;

logoBy Technology Segment Analysis

  • Biochemical
  • Thermal
  • Others

logoBy Regional Segment Analysis

  • North America
    • The U.S.
    • Canada
    • Mexico
  • Europe
    • France
    • The UK
    • Spain
    • Germany
    • Italy
    • Nordic Countries
      • Denmark
      • Sweden
      • Norway
    • Benelux Union
      • Belgium
      • The Netherlands
      • Luxembourg
    • Rest of Europe
  • Asia Pacific
    • China
    • Japan
    • India
    • Australia
    • South Korea
    • Southeast Asia
      • Indonesia
      • Thailand
      • Malaysia
      • Singapore
      • Rest of Southeast Asia
    • Rest of Asia Pacific
  • The Middle East & Africa
    • Saudi Arabia
    • UAE
    • Egypt
    • South Africa
    • Rest of the Middle East & Africa
  • Latin America
    • Brazil
    • Argentina
    • Rest of Latin America

Table of Content

  1. Chapter 1. Preface
    1. 1.1 Report Description and Scope
  2. 1.2 Research scope
  3. 1.3 Research methodology
    1. 1.3.1 Market Research Type
    2. 1.3.2 Market research methodology
  4. Chapter 2. Executive Summary
    1. 2.1 Global Waste To Energy Market, (2022 - 2028) (USD Billion)
  5. 2.2 Global Waste To Energy Market : snapshot
  6. Chapter 3. Global Waste To Energy Market - Industry Analysis
    1. 3.1 Waste To Energy Market: Market Dynamics
  7. 3.2 Market Drivers
    1. 3.2.1 Heat and power generation from waste
    2. 3.2.2 Driver 2
  8. 3.3 Market Restraints
  9. 3.4 Market Opportunities
  10. 3.5 Market Challenges
  11. 3.6 Porter’s Five Forces Analysis
  12. 3.7 Market Attractiveness Analysis
    1. 3.7.1 Market attractiveness analysis By Technology
  13. Chapter 4. Global Waste To Energy Market- Competitive Landscape
    1. 4.1 Company market share analysis
    2. 4.1.1 Global Waste To Energy Market: company market share, 2021
  14. 4.2 Strategic development
    1. 4.2.1 Acquisitions & mergers
    2. 4.2.2 New Product launches
    3. 4.2.3 Agreements, partnerships, cullaborations, and joint ventures
    4. 4.2.4 Research and development and Regional expansion
  15. 4.3 Price trend analysis
  16. Chapter 5. Global Waste To Energy Market - Technology Analysis
    1. 5.1 Global Waste To Energy Market overview: By Technology
    2. 5.1.1 Global Waste To Energy Market share, By Technology, 2021 and 2028
  17. 5.2 Biochemical
    1. 5.2.1 Global Waste To Energy Market by Biochemical, 2022 - 2028 (USD Billion)
  18. 5.3 Thermal
    1. 5.3.1 Global Waste To Energy Market by Thermal, 2022 - 2028 (USD Billion)
  19. 5.4 Others
    1. 5.4.1 Global Waste To Energy Market by Others, 2022 - 2028 (USD Billion)
  20. Chapter 6. Waste To Energy Market - Regional Analysis
    1. 6.1 Global Waste To Energy Market Regional Overview
  21. 6.2 Global Waste To Energy Market Share, by Region, 2021 & 2028 (USD Billion)
    1. 6.3. North America
    2. 6.3.1 North America Waste To Energy Market, 2022 - 2028 (USD Billion)
      1. 6.3.1.1 North America Waste To Energy Market, by Country, 2022 - 2028 (USD Billion)
  22. 6.4 North America Waste To Energy Market, by Technology, 2022 - 2028
    1. 6.4.1 North America Waste To Energy Market, by Technology, 2022 - 2028 (USD Billion)
    2. 6.5. Europe
    3. 6.5.1 Europe Waste To Energy Market, 2022 - 2028 (USD Billion)
      1. 6.5.1.1 Europe Waste To Energy Market, by Country, 2022 - 2028 (USD Billion)
  23. 6.6 Europe Waste To Energy Market, by Technology, 2022 - 2028
    1. 6.6.1 Europe Waste To Energy Market, by Technology, 2022 - 2028 (USD Billion)
    2. 6.7. Asia Pacific
    3. 6.7.1 Asia Pacific Waste To Energy Market, 2022 - 2028 (USD Billion)
      1. 6.7.1.1 Asia Pacific Waste To Energy Market, by Country, 2022 - 2028 (USD Billion)
  24. 6.8 Asia Pacific Waste To Energy Market, by Technology, 2022 - 2028
    1. 6.8.1 Asia Pacific Waste To Energy Market, by Technology, 2022 - 2028 (USD Billion)
    2. 6.9. Latin America
    3. 6.9.1 Latin America Waste To Energy Market, 2022 - 2028 (USD Billion)
      1. 6.9.1.1 Latin America Waste To Energy Market, by Country, 2022 - 2028 (USD Billion)
  25. 6.10 Latin America Waste To Energy Market, by Technology, 2022 - 2028
    1. 6.10.1 Latin America Waste To Energy Market, by Technology, 2022 - 2028 (USD Billion)
    2. 6.11. The Middle-East and Africa
    3. 6.11.1 The Middle-East and Africa Waste To Energy Market, 2022 - 2028 (USD Billion)
      1. 6.11.1.1 The Middle-East and Africa Waste To Energy Market, by Country, 2022 - 2028 (USD Billion)
  26. 6.12 The Middle-East and Africa Waste To Energy Market, by Technology, 2022 - 2028
    1. 6.12.1 The Middle-East and Africa Waste To Energy Market, by Technology, 2022 - 2028 (USD Billion)
  27. Chapter 7. Company Profiles
    1. 7.1 China Everbright International Limited
    2. 7.1.1 Overview
    3. 7.1.2 Financials
    4. 7.1.3 Product Portfolio
    5. 7.1.4 Business Strategy
    6. 7.1.5 Recent Developments
  28. 7.2 Ramboll Group A/S
    1. 7.2.1 Overview
    2. 7.2.2 Financials
    3. 7.2.3 Product Portfolio
    4. 7.2.4 Business Strategy
    5. 7.2.5 Recent Developments
  29. 7.3 Hitachi Zosen Inova AG
    1. 7.3.1 Overview
    2. 7.3.2 Financials
    3. 7.3.3 Product Portfolio
    4. 7.3.4 Business Strategy
    5. 7.3.5 Recent Developments
  30. 7.4 Wheelabrator Technologies Inc
    1. 7.4.1 Overview
    2. 7.4.2 Financials
    3. 7.4.3 Product Portfolio
    4. 7.4.4 Business Strategy
    5. 7.4.5 Recent Developments
  31. 7.5 Veolia
    1. 7.5.1 Overview
    2. 7.5.2 Financials
    3. 7.5.3 Product Portfolio
    4. 7.5.4 Business Strategy
    5. 7.5.5 Recent Developments
  32. 7.6 Xcel Energy Inc.
    1. 7.6.1 Overview
    2. 7.6.2 Financials
    3. 7.6.3 Product Portfolio
    4. 7.6.4 Business Strategy
    5. 7.6.5 Recent Developments
  33. 7.7 Covanta Holding Corporation
    1. 7.7.1 Overview
    2. 7.7.2 Financials
    3. 7.7.3 Product Portfolio
    4. 7.7.4 Business Strategy
    5. 7.7.5 Recent Developments
  34. 7.8 Babcock & Wilcox Enterprises Inc.
    1. 7.8.1 Overview
    2. 7.8.2 Financials
    3. 7.8.3 Product Portfolio
    4. 7.8.4 Business Strategy
    5. 7.8.5 Recent Developments
  35. 7.9 Suez
    1. 7.9.1 Overview
    2. 7.9.2 Financials
    3. 7.9.3 Product Portfolio
    4. 7.9.4 Business Strategy
    5. 7.9.5 Recent Developments
  36. 7.10 Abu Dhabi National Energy Company PJSC.
    1. 7.10.1 Overview
    2. 7.10.2 Financials
    3. 7.10.3 Product Portfolio
    4. 7.10.4 Business Strategy
    5. 7.10.5 Recent Developments

    List of Figures

    1. Market research Type 
    2. Market research methodology 
    3. Global Waste To Energy Market, 2022 - 2028 (USD Billion) 
    4. Porter’s Five Forces Analysis 
    5. Global Waste To Energy Market attractiveness, By Technology 
    6. Global Waste To Energy Market share by Technology, 2022 and 2028 (USD Billion) 
    7. Global Waste To Energy Market by Biochemical, 2022 - 2028 (USD Billion) 
    8. Global Waste To Energy Market by Thermal, 2022 - 2028 (USD Billion) 
    9. Global Waste To Energy Market by Others, 2022 - 2028 (USD Billion) 
    10. Global Waste To Energy Market share, by Region, 2022 and 2028 
    11. North America Waste To Energy Market, 2022 - 2028 (USD Billion) 
    12. Europe Waste To Energy Market, 2022 - 2028 (USD Billion) 
    13. Asia Pacific Waste To Energy Market, 2022 - 2028 (USD Billion) 
    14. Latin America Waste To Energy Market, 2022 - 2028 (USD Billion) 
    15. The Middle-East and Africa Waste To Energy Market, 2022 - 2028 (USD Billion) 
    

    List of Tables

    1. Global Waste To Energy Market: Snapshot 
    2. Drivers of the Waste To Energy Market: impact analysis 
    3. North America Waste To Energy Market revenue, By Technology, 2022 - 2028 (USD Billion) 
    4. U.S. Waste To Energy Market revenue, By Technology, 2022 - 2028 (USD Billion) 
    5. Canada Waste To Energy Market revenue, By Technology, 2022 - 2028 (USD Billion) 
    6. Europe Waste To Energy Market revenue, By Technology, 2022 - 2028 (USD Billion) 
    7. Germany Waste To Energy Market revenue, By Technology, 2022 - 2028 (USD Billion) 
    8. France Waste To Energy Market revenue, By Technology, 2022 - 2028 (USD Billion) 
    9. U.K. Waste To Energy Market revenue, By Technology, 2022 - 2028 (USD Billion) 
    10. Italy Waste To Energy Market revenue, By Technology, 2022 - 2028 (USD Billion) 
    11. Spain Waste To Energy Market revenue, By Technology, 2022 - 2028 (USD Billion) 
    12. Rest of Europe Waste To Energy Market revenue, By Technology, 2022 - 2028 (USD Billion) 
    13. Asia Pacific Waste To Energy Market revenue, By Technology, 2022 - 2028 (USD Billion) 
    14. China Waste To Energy Market revenue, By Technology, 2022 - 2028 (USD Billion) 
    15. Japan Waste To Energy Market revenue, By Technology, 2022 - 2028 (USD Billion) 
    16. India Waste To Energy Market revenue, By Technology, 2022 - 2028 (USD Billion) 
    17. South Korea Waste To Energy Market revenue, By Technology, 2022 - 2028 (USD Billion) 
    18. South-East Asia Waste To Energy Market revenue, By Technology, 2022 - 2028 (USD Billion) 
    19. Rest of Asia Pacific Waste To Energy Market revenue, By Technology, 2022 - 2028 (USD Billion) 
    20. Latin America Waste To Energy Market revenue, By Technology, 2022 - 2028 (USD Billion) 
    21. Brazil Waste To Energy Market revenue, By Technology, 2022 - 2028 (USD Billion) 
    22. Mexico Waste To Energy Market revenue, By Technology, 2022 - 2028 (USD Billion) 
    23. Rest of Latin America Waste To Energy Market revenue, By Technology, 2022 - 2028 (USD Billion) 
    24. The Middle-East and Africa Waste To Energy Market revenue, By Technology, 2022 - 2028 (USD Billion) 
    25. GCC Countries Waste To Energy Market revenue, By Technology, 2022 - 2028 (USD Billion) 
    26. South Africa Waste To Energy Market revenue, By Technology, 2022 - 2028 (USD Billion) 
    27. Rest of Middle-East Africa Waste To Energy Market revenue, By Technology, 2022 - 2028 (USD Billion) 
    

Industry Major Market Players

  • China Everbright International Limited
  • Ramboll Group A/S
  • Hitachi Zosen Inova AG
  • Wheelabrator Technologies Inc
  • Veolia
  • Xcel Energy Inc.
  • Covanta Holding Corporation
  • Babcock & Wilcox Enterprises Inc.
  • Suez
  • Abu Dhabi National Energy Company PJSC