Search Market Research Report

Discover Our Latest Reports
Discover Our Featured Reports
Discover Top Selling Reports

Global Tour Operator Software Market Size, Share & Demand Analysis Report 2026

report img

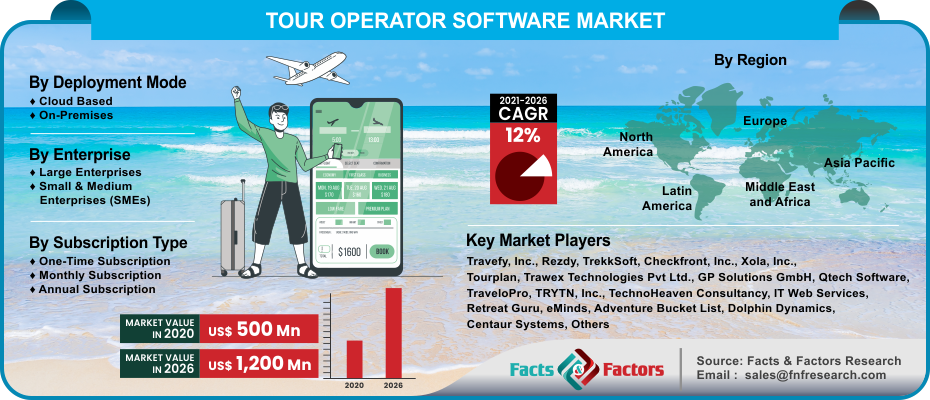
Tour Operator Software Market: By Deployment Mode (Cloud Based and On-Premises), By Enterprise Size (Large Enterprises and Small & Medium Enterprises (SMEs)), By Subscription Type (One-Time Subscription, Monthly Subscription, and Annual Subscription), And By Regions – Global & Regional Industry Perspective, Comprehensive Analysis, and Forecast 2021 – 2026

Industry Insights

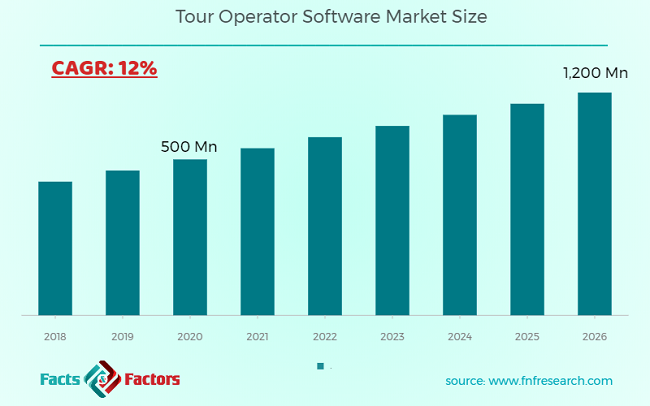
[171+ Pages Report] According to the report published by Facts and Factors, the global tour operator software market size was valued around USD 500 Million in 2020 and is expected to grow to around USD 1,200 Million by 2026 with a compound annual growth rate (CAGR) of roughly 12% between 2021 and 2026. The report analyzes the global tour operator software market drivers, challenges, and the impact they have on the demands during the forecast period. In addition, the report explores emerging opportunities in the tour operator software market.

Tour Operator Software Market Size

To know more about this report | Request Free Sample Copy

logoReport Overview

The tourism industry is revolutionizing due to the rising adoption of tour operator software. The growing travel and tourism industry helps the adoption of tour operator software in order to advance the travel infrastructure, regulatory policies, booking processes, and to find new tourist locations. The tour operator software is known to help ease the booking and payment process. The tour operator software can spur stupendously with the rising globalization and cross border trade.

Tour operators use software to build their own tour activity, tour package, holiday, or travel itinerary and sell them directly to customers/travel agents. They sell their own products. Tour Operator Software is a travel software used to plan the best trip or itinerary for the tour operators or travel agents in order to automate their booking, customized package, accounting, payment gateway with customer management features, tour inventory, itinerary creation, back office management, MIS reports, and tour inventory.

logoIndustry Growth Factors

Growing penetration of Artificial Intelligence in the booking process by the operators helps attract more bookings, which thereby will propel the adoption of tour operator software across the world. Surging adoption of devices such as tablets, laptops, and mobile devices coupled with high Internet speed in recent years will probably bolster the market expansion.

The increasing tourism, high disposable income, growing trade volumes, and globalization are factors proliferating the market growth during the forecast period. Furthermore, the influence of digitalization on travel booking and payment are other aspects propelling the tour operator software market. With the rising tourism operators, new tourist destinations, and tourism packages, the opportunities for the global tour operator software are expected to rise over the forecast period. The adoption of AI and robotics in the tourism industry is boosting the customer experience and services offered by the tour operator. With the introduction of artificial travel intelligence, the travel arrangements for the passenger are further enhanced to meet their expectations.

Moreover, the use of travel technology software in the field of hospitality and travel industry helps ease the communication and information sharing between the operators & travelers, which will fuel the market expansion. However, during the COVID-19 pandemic the lockdown has created a negative impact on the travel and tourism industry; thereby, affecting the tour operator software market. Additionally, the stringent government norms put on domestic as well international travel is expected to further restrain the tour operator software market growth.

Tour Operator Software Market

To know more about this report | Request Free Sample Copy

logoSegmentation Analysis

The global tour operator software market is segmented based on deployment mode, enterprise size, subscription type, and regions.

Based on the deployment mode, the global tour operator software market is divided into cloud based and on-premises. The accessibility of cloud-based software from anywhere anytime majorly helps popularize its use and also generate the highest revenue for the global tour operator software market. The benefits of cloud-based software include no need for installation on the computer, easy data transfer to multiple users, and real-time data availability which helps the segment grow over the forecast period.

By enterprise size, the market is categorized into large enterprises and small & medium enterprises (SMEs). Large enterprises focus on customer preference by offering multiple destinations, hotels, and price ranges. The large enterprises segment holds the largest market share in the global tour operator software market. Large enterprises use tour operator software to provide various information such as amenities provided by hotels, tourist destinations, etc. all under a single roof. Most importantly, this software helps the employees in large enterprises stay on the same page in terms of policies and reservation processes so as to avoid errors.

On the basis of subscription type, the tour operator software market is classified into a one-time subscription, monthly subscription, and annual subscription.

logoReport Scope

Report Attribute

Details

Market Size in 2020

USD 500 Million

Projected Market Size in 2026

USD 1,200 Million

CAGR Growth Rate

12% CAGR

Base Year

2020

Forecast Years

2021-2026

Key Market Players

Travefy Inc., Rezdy, TrekkSoft, Checkfront Inc., Xola Inc., Tourplan, Trawex Technologies Pvt Ltd., GP Solutions GmbH, Qtech Software, TraveloPro, TRYTN Inc., TechnoHeaven Consultancy, IT Web Services, Retreat Guru, eMinds, Adventure Bucket List, Dolphin Dynamics, Centaur Systems, WebBookingExpert, Tenet Enterprises Solutions, Lemax Systems, INFOTREE, iRez Systems, Jambix, VacationLabs, Amadeus, WeTravel, among others.

Key Segment

By Deployment Mode, y Enterprise Size, By Subscription Type, and By Region

Major Regions Covered

North America, Europe, Asia Pacific, Latin America, and the Middle East & Africa

Purchase Options

Request customized purchase options to meet your research needs. Explore purchase options

logoRegional Analysis

North America is expected to dominate the global tour operator software market during the forecast period. The growth is primarily due to the mounting tourist destinations, high disposable income, regulatory policies, travel infrastructure development, and rising adoption of software by tour operators in the region.

logoCompetitive Players

Some of the key players dominating the global tour operator software market include :

  • Travefy Inc.
  • Rezdy
  • TrekkSoft
  • Checkfront Inc.
  • Xola Inc.
  • Tourplan
  • Trawex Technologies Pvt Ltd.
  • GP Solutions GmbH
  • Qtech Software
  • TraveloPro
  • TRYTN Inc.
  • TechnoHeaven Consultancy
  • IT Web Services
  • Retreat Guru
  • eMinds
  • Adventure Bucket List
  • Dolphin Dynamics
  • Centaur Systems
  • WebBookingExpert
  • Tenet Enterprises Solutions
  • Lemax Systems
  • INFOTREE
  • iRez Systems
  • Jambix
  • VacationLabs
  • Amadeus
  • WeTravel
  • among others.

logoBy Deployment Mode Segment Analysis

  • Cloud Based
  • On-Premises

logoBy Enterprise Size Segment Analysis

  • Large Enterprises
  • Small & Medium Enterprises (SMEs)

logoBy Subscription Type Segment Analysis

  • One-Time Subscription
  • Monthly Subscription
  • Annual Subscription

logoBy Regional Segment Analysis

  • North America
    • U.S.
    • Canada
  • Europe
    • UK
    • France
    • Germany
    • Italy
    • Spain
    • Rest of Europe
  • Asia Pacific
    • China
    • Japan
    • India
    • South Korea
    • Southeast Asia
    • Rest of Asia Pacific
  • Latin America
    • Brazil
    • Mexico
    • Rest of Latin America
  • Middle East and Africa
    • GCC Countries
    • South Africa
    • Rest of MEA

Table of Content

  1. Chapter 1 Executive Summary
    1. 1.1. Introduction of Tour Operator Software
    2. 1.2. Global Tour Operator Software Market, 2019 & 2026 (USD Million)
    3. 1.3. Global Tour Operator Software Market, 2016 – 2026 (USD Million)
    4. 1.4. Global Tour Operator Software Market Absolute Revenue Opportunity, 2016 – 2026 (USD Million)
    5. 1.5. Global Tour Operator Software Market Incremental Revenue Opportunity, 2020 – 2026 (USD Million)
  2. Chapter 2 Tour Operator Software Market – Deployment Mode Analysis
    1. 2.1. Global Tour Operator Software Market – Deployment Mode Overview
    2. 2.2. Global Tour Operator Software Market Share, by Deployment Mode, 2019 & 2026 (USD Million)
    3. 2.3. Cloud Based
      1. 2.3.1. Global Cloud Based Tour Operator Software Market, 2016 – 2026 (USD Million)
    4. 2.4. On-Premises
      1. 2.4.1. Global On-Premises Tour Operator Software Market, 2016 – 2026 (USD Million)
  3. Chapter 3 Tour Operator Software Market – Enterprise Size Analysis
    1. 3.1. Global Tour Operator Software Market – Enterprise Size Overview
    2. 3.2. Global Tour Operator Software Market Share, by Enterprise Size, 2019 & 2026 (USD Million)
    3. 3.3. Large Enterprises
      1. 3.3.1. Global Large Enterprises Tour Operator Software Market, 2016 – 2026 (USD Million)
    4. 3.4. Small & Medium Enterprises (SMEs)
      1. 3.4.1. Global Small & Medium Enterprises (SMEs) Tour Operator Software Market, 2016 – 2026 (USD Million)
  4. Chapter 4 Tour Operator Software Market – Subscription Type Analysis
    1. 4.1. Global Tour Operator Software Market – Subscription Type Overview
    2. 4.2. Global Tour Operator Software Market Share, by Subscription Type, 2019 & 2026 (USD Million)
    3. 4.3. One-Time Subscription
      1. 4.3.1. Global One-Time Subscription Tour Operator Software Market, 2016 – 2026 (USD Million)
    4. 4.4. Monthly Subscription
      1. 4.4.1. Global Monthly Subscription Tour Operator Software Market, 2016 – 2026 (USD Million)
    5. 4.5. Annual Subscription
      1. 4.5.1. Global Annual Subscription Tour Operator Software Market, 2016 – 2026 (USD Million)
  5. Chapter 5 Tour Operator Software Market – Regional Analysis
    1. 5.1. Global Tour Operator Software Market Regional Overview
    2. 5.2. Global Tour Operator Software Market Share, by Region, 2019 & 2026 (USD Million)
    3. 5.3. North America
      1. 5.3.1. North America Tour Operator Software Market, 2016 – 2026 (USD Million)
        1. 5.3.1.1. North America Tour Operator Software Market, by Country, 2016 - 2026 (USD Million)
      2. 5.3.2. North America Tour Operator Software Market, by Deployment Mode, 2016 – 2026
        1. 5.3.2.1. North America Tour Operator Software Market, by Deployment Mode, 2016 – 2026 (USD Million)
      3. 5.3.3. North America Tour Operator Software Market, by Enterprise Size, 2016 – 2026
        1. 5.3.3.1. North America Tour Operator Software Market, by Enterprise Size, 2016 – 2026 (USD Million)
      4. 5.3.4. North America Tour Operator Software Market, by Subscription Type, 2016 – 2026
        1. 5.3.4.1. North America Tour Operator Software Market, by Subscription Type, 2016 – 2026 (USD Million)
      5. 5.3.5. U.S.
        1. 5.3.5.1. U.S. Tour Operator Software Market, 2016 – 2026 (USD Million)
      6. 5.3.6. Canada
        1. 5.3.6.1. Canada Tour Operator Software Market, 2016 – 2026 (USD Million)
    4. 5.4. Europe
      1. 5.4.1. Europe Tour Operator Software Market, 2016 – 2026 (USD Million)
        1. 5.4.1.1. Europe Tour Operator Software Market, by Country, 2016 - 2026 (USD Million)
      2. 5.4.2. Europe Tour Operator Software Market, by Deployment Mode, 2016 – 2026
        1. 5.4.2.1. Europe Tour Operator Software Market, by Deployment Mode, 2016 – 2026 (USD Million)
      3. 5.4.3. Europe Tour Operator Software Market, by Enterprise Size, 2016 – 2026
        1. 5.4.3.1. Europe Tour Operator Software Market, by Enterprise Size, 2016 – 2026 (USD Million)
      4. 5.4.4. Europe Tour Operator Software Market, by Subscription Type, 2016 – 2026
        1. 5.4.4.1. Europe Tour Operator Software Market, by Subscription Type, 2016 – 2026 (USD Million)
      5. 5.4.5. Germany
        1. 5.4.5.1. Germany Tour Operator Software Market, 2016 – 2026 (USD Million)
      6. 5.4.6. France
        1. 5.4.6.1. France Tour Operator Software Market, 2016 – 2026 (USD Million)
      7. 5.4.7. U.K.
        1. 5.4.7.1. U.K. Tour Operator Software Market, 2016 – 2026 (USD Million)
      8. 5.4.8. Italy
        1. 5.4.8.1. Italy Tour Operator Software Market, 2016 – 2026 (USD Million)
      9. 5.4.9. Spain
        1. 5.4.9.1. Spain Tour Operator Software Market, 2016 – 2026 (USD Million)
      10. 5.4.10. Rest of Europe
        1. 5.4.10.1. Rest of Europe Tour Operator Software Market, 2016 – 2026 (USD Million)
    5. 5.5. Asia Pacific
      1. 5.5.1. Asia Pacific Tour Operator Software Market, 2016 – 2026 (USD Million)
        1. 5.5.1.1. Asia Pacific Tour Operator Software Market, by Country, 2016 - 2026 (USD Million)
      2. 5.5.2. Asia Pacific Tour Operator Software Market, by Deployment Mode, 2016 – 2026
        1. 5.5.2.1. Asia Pacific Tour Operator Software Market, by Deployment Mode, 2016 – 2026 (USD Million)
      3. 5.5.3. Asia Pacific Tour Operator Software Market, by Enterprise Size, 2016 – 2026
        1. 5.5.3.1. Asia Pacific Tour Operator Software Market, by Enterprise Size, 2016 – 2026 (USD Million)
      4. 5.5.4. Asia Pacific Tour Operator Software Market, by Subscription Type, 2016 – 2026
        1. 5.5.4.1. Asia Pacific Tour Operator Software Market, by Subscription Type, 2016 – 2026 (USD Million)
      5. 5.5.5. China
        1. 5.5.5.1. China Tour Operator Software Market, 2016 – 2026 (USD Million)
      6. 5.5.6. Japan
        1. 5.5.6.1. Japan Tour Operator Software Market, 2016 – 2026 (USD Million)
      7. 5.5.7. India
        1. 5.5.7.1. India Tour Operator Software Market, 2016 – 2026 (USD Million)
      8. 5.5.8. South Korea
        1. 5.5.8.1. South Korea Tour Operator Software Market, 2016 – 2026 (USD Million)
      9. 5.5.9. South-East Asia
        1. 5.5.9.1. South-East Asia Tour Operator Software Market, 2016 – 2026 (USD Million)
      10. 5.5.10. Rest of Asia Pacific
        1. 5.5.10.1. Rest of Asia Pacific Tour Operator Software Market, 2016 – 2026 (USD Million)
    6. 5.6. Latin America
      1. 5.6.1. Latin America Tour Operator Software Market, 2016 – 2026 (USD Million)
        1. 5.6.1.1. Latin America Tour Operator Software Market, by Country, 2016 - 2026 (USD Million)
      2. 5.6.2. Latin America Tour Operator Software Market, by Deployment Mode, 2016 – 2026
        1. 5.6.2.1. Latin America Tour Operator Software Market, by Deployment Mode, 2016 – 2026 (USD Million)
      3. 5.6.3. Latin America Tour Operator Software Market, by Enterprise Size, 2016 – 2026
        1. 5.6.3.1. Latin America Tour Operator Software Market, by Enterprise Size, 2016 – 2026 (USD Million)
      4. 5.6.4. Latin America Tour Operator Software Market, by Subscription Type, 2016 – 2026
        1. 5.6.4.1. Latin America Tour Operator Software Market, by Subscription Type, 2016 – 2026 (USD Million)
      5. 5.6.5. Brazil
        1. 5.6.5.1. Brazil Tour Operator Software Market, 2016 – 2026 (USD Million)
      6. 5.6.6. Mexico
        1. 5.6.6.1. Mexico Tour Operator Software Market, 2016 – 2026 (USD Million)
      7. 5.6.7. Rest of Latin America
        1. 5.6.7.1. Rest of Latin America Tour Operator Software Market, 2016 – 2026 (USD Million)
    7. 5.7. The Middle-East and Africa
      1. 5.7.1. The Middle-East and Africa Tour Operator Software Market, 2016 – 2026 (USD Million)
        1. 5.7.1.1. The Middle-East and Africa Tour Operator Software Market, by Country, 2016 - 2026 (USD Million)
      2. 5.7.2. The Middle-East and Africa Tour Operator Software Market, by Deployment Mode, 2016 – 2026
        1. 5.7.2.1. The Middle-East and Africa Tour Operator Software Market, by Deployment Mode, 2016 – 2026 (USD Million)
      3. 5.7.3. The Middle-East and Africa Tour Operator Software Market, by Enterprise Size, 2016 – 2026
        1. 5.7.3.1. The Middle-East and Africa Tour Operator Software Market, by Enterprise Size, 2016 – 2026 (USD Million)
      4. 5.7.4. The Middle-East and Africa Tour Operator Software Market, by Subscription Type, 2016 – 2026
        1. 5.7.4.1. The Middle-East and Africa Tour Operator Software Market, by Subscription Type, 2016 – 2026 (USD Million)
      5. 5.7.5. GCC Countries
        1. 5.7.5.1. GCC Countries Tour Operator Software Market, 2016 – 2026 (USD Million)
      6. 5.7.6. South Africa
        1. 5.7.6.1. South Africa Tour Operator Software Market, 2016 – 2026 (USD Million)
      7. 5.7.7. Rest of Middle-East Africa
        1. 5.7.7.1. Rest of Middle-East Africa Tour Operator Software Market, 2016 – 2026 (USD Million)
  6. Chapter 6 Tour Operator Software Market – Competitive Landscape
    1. 6.1. Competitor Market Share – Revenue
    2. 6.2. Market Concentration Rate Analysis, Top 3 and Top 5 Players
    3. 6.3. Strategic Developments
      1. 6.3.1. Acquisitions and Mergers
      2. 6.3.2. New Products
      3. 6.3.3. Research & Development Activities
  7. Chapter 7 Company Profiles
    1. 7.1. Travefy Inc.
      1. 7.1.1. Company Overview
      2. 7.1.2. Product/Service Portfolio
      3. 7.1.3. Travefy Inc. Sales, Revenue, and Gross Margin
      4. 7.1.4. Travefy Inc. Revenue and Growth Rate
      5. 7.1.5. Travefy Inc. Market Share
      6. 7.1.6. Recent Initiatives, Funding/VC Activities, and Technological Innovations
    2. 7.2. Rezdy
      1. 7.2.1. Company Overview
      2. 7.2.2. Product/Service Portfolio
      3. 7.2.3. Rezdy Sales, Revenue, and Gross Margin
      4. 7.2.4. Rezdy Revenue and Growth Rate
      5. 7.2.5. Rezdy Market Share
      6. 7.2.6. Recent Initiatives, Funding/VC Activities, and Technological Innovations
    3. 7.3. TrekkSoft
      1. 7.3.1. Company Overview
      2. 7.3.2. Product/Service Portfolio
      3. 7.3.3. TrekkSoft Sales, Revenue, and Gross Margin
      4. 7.3.4. TrekkSoft Revenue and Growth Rate
      5. 7.3.5. TrekkSoft Market Share
      6. 7.3.6. Recent Initiatives, Funding/VC Activities, and Technological Innovations
    4. 7.4. Checkfront Inc.
      1. 7.4.1. Company Overview
      2. 7.4.2. Product/Service Portfolio
      3. 7.4.3. Checkfront Inc. Sales, Revenue, and Gross Margin
      4. 7.4.4. Checkfront Inc. Revenue and Growth Rate
      5. 7.4.5. Checkfront Inc. Market Share
      6. 7.4.6. Recent Initiatives, Funding/VC Activities, and Technological Innovations
    5. 7.5. Xola Inc.
      1. 7.5.1. Company Overview
      2. 7.5.2. Product/Service Portfolio
      3. 7.5.3. Xola Inc. Sales, Revenue, and Gross Margin
      4. 7.5.4. Xola Inc. Revenue and Growth Rate
      5. 7.5.5. Xola Inc. Market Share
      6. 7.5.6. Recent Initiatives, Funding/VC Activities, and Technological Innovations
    6. 7.6. Tourplan
      1. 7.6.1. Company Overview
      2. 7.6.2. Product/Service Portfolio
      3. 7.6.3. Tourplan Sales, Revenue, and Gross Margin
      4. 7.6.4. Tourplan Revenue and Growth Rate
      5. 7.6.5. Tourplan Market Share
      6. 7.6.6. Recent Initiatives, Funding/VC Activities, and Technological Innovations
    7. 7.7. Trawex Technologies Pvt Ltd.
      1. 7.7.1. Company Overview
      2. 7.7.2. Product/Service Portfolio
      3. 7.7.3. Trawex Technologies Pvt Ltd. Sales, Revenue, and Gross Margin
      4. 7.7.4. Trawex Technologies Pvt Ltd. Revenue and Growth Rate
      5. 7.7.5. Trawex Technologies Pvt Ltd. Market Share
      6. 7.7.6. Recent Initiatives, Funding/VC Activities, and Technological Innovations
    8. 7.8. GP Solutions GmbH
      1. 7.8.1. Company Overview
      2. 7.8.2. Product/Service Portfolio
      3. 7.8.3. GP Solutions GmbH Sales, Revenue, and Gross Margin
      4. 7.8.4. GP Solutions GmbH Revenue and Growth Rate
      5. 7.8.5. GP Solutions GmbH Market Share
      6. 7.8.6. Recent Initiatives, Funding/VC Activities, and Technological Innovations
    9. 7.9. Qtech Software
      1. 7.9.1. Company Overview
      2. 7.9.2. Product/Service Portfolio
      3. 7.9.3. Qtech Software Sales, Revenue, and Gross Margin
      4. 7.9.4. Qtech Software Revenue and Growth Rate
      5. 7.9.5. Qtech Software Market Share
      6. 7.9.6. Recent Initiatives, Funding/VC Activities, and Technological Innovations
    10. 7.10. TraveloPro
      1. 7.10.1. Company Overview
      2. 7.10.2. Product/Service Portfolio
      3. 7.10.3. TraveloPro Sales, Revenue, and Gross Margin
      4. 7.10.4. TraveloPro Revenue and Growth Rate
      5. 7.10.5. TraveloPro Market Share
      6. 7.10.6. Recent Initiatives, Funding/VC Activities, and Technological Innovations
    11. 7.11. TRYTN Inc.
      1. 7.11.1. Company Overview
      2. 7.11.2. Product/Service Portfolio
      3. 7.11.3. TRYTN Inc. Sales, Revenue, and Gross Margin
      4. 7.11.4. TRYTN Inc. Revenue and Growth Rate
      5. 7.11.5. TRYTN Inc. Market Share
      6. 7.11.6. Recent Initiatives, Funding/VC Activities, and Technological Innovations
    12. 7.12. TechnoHeaven Consultancy
      1. 7.12.1. Company Overview
      2. 7.12.2. Product/Service Portfolio
      3. 7.12.3. TechnoHeaven Consultancy Sales, Revenue, and Gross Margin
      4. 7.12.4. TechnoHeaven Consultancy Revenue and Growth Rate
      5. 7.12.5. TechnoHeaven Consultancy Market Share
      6. 7.12.6. Recent Initiatives, Funding/VC Activities, and Technological Innovations
    13. 7.13. IT Web Services
      1. 7.13.1. Company Overview
      2. 7.13.2. Product/Service Portfolio
      3. 7.13.3. IT Web Services Sales, Revenue, and Gross Margin
      4. 7.13.4. IT Web Services Revenue and Growth Rate
      5. 7.13.5. IT Web Services Market Share
      6. 7.13.6. Recent Initiatives, Funding/VC Activities, and Technological Innovations
    14. 7.14. Retreat Guru
      1. 7.14.1. Company Overview
      2. 7.14.2. Product/Service Portfolio
      3. 7.14.3. Retreat Guru Sales, Revenue, and Gross Margin
      4. 7.14.4. Retreat Guru Revenue and Growth Rate
      5. 7.14.5. Retreat Guru Market Share
      6. 7.14.6. Recent Initiatives, Funding/VC Activities, and Technological Innovations
    15. 7.15. eMinds
      1. 7.15.1. Company Overview
      2. 7.15.2. Product/Service Portfolio
      3. 7.15.3. eMinds Sales, Revenue, and Gross Margin
      4. 7.15.4. eMinds Revenue and Growth Rate
      5. 7.15.5. eMinds Market Share
      6. 7.15.6. Recent Initiatives, Funding/VC Activities, and Technological Innovations
    16. 7.16. Adventure Bucket List
      1. 7.16.1. Company Overview
      2. 7.16.2. Product/Service Portfolio
      3. 7.16.3. Adventure Bucket List Sales, Revenue, and Gross Margin
      4. 7.16.4. Adventure Bucket List Revenue and Growth Rate
      5. 7.16.5. Adventure Bucket List Market Share
      6. 7.16.6. Recent Initiatives, Funding/VC Activities, and Technological Innovations
    17. 7.17. Dolphin Dynamics
      1. 7.17.1. Company Overview
      2. 7.17.2. Product/Service Portfolio
      3. 7.17.3. Dolphin Dynamics Sales, Revenue, and Gross Margin
      4. 7.17.4. Dolphin Dynamics Revenue and Growth Rate
      5. 7.17.5. Dolphin Dynamics Market Share
      6. 7.17.6. Recent Initiatives, Funding/VC Activities, and Technological Innovations
    18. 7.18. Centaur Systems
      1. 7.18.1. Company Overview
      2. 7.18.2. Product/Service Portfolio
      3. 7.18.3. Centaur Systems Sales, Revenue, and Gross Margin
      4. 7.18.4. Centaur Systems Revenue and Growth Rate
      5. 7.18.5. Centaur Systems Market Share
      6. 7.18.6. Recent Initiatives, Funding/VC Activities, and Technological Innovations
    19. 7.19. WebBookingExpert
      1. 7.19.1. Company Overview
      2. 7.19.2. Product/Service Portfolio
      3. 7.19.3. WebBookingExpert Sales, Revenue, and Gross Margin
      4. 7.19.4. WebBookingExpert Revenue and Growth Rate
      5. 7.19.5. WebBookingExpert Market Share
      6. 7.19.6. Recent Initiatives, Funding/VC Activities, and Technological Innovations
    20. 7.20. Tenet Enterprises Solutions
      1. 7.20.1. Company Overview
      2. 7.20.2. Product/Service Portfolio
      3. 7.20.3. Tenet Enterprises Solutions Sales, Revenue, and Gross Margin
      4. 7.20.4. Tenet Enterprises Solutions Revenue and Growth Rate
      5. 7.20.5. Tenet Enterprises Solutions Market Share
      6. 7.20.6. Recent Initiatives, Funding/VC Activities, and Technological Innovations
    21. 7.21. Lemax Systems
      1. 7.21.1. Company Overview
      2. 7.21.2. Product/Service Portfolio
      3. 7.21.3. Lemax Systems Sales, Revenue, and Gross Margin
      4. 7.21.4. Lemax Systems Revenue and Growth Rate
      5. 7.21.5. Lemax Systems Market Share
      6. 7.21.6. Recent Initiatives, Funding/VC Activities, and Technological Innovations
    22. 7.22. INFOTREE
      1. 7.22.1. Company Overview
      2. 7.22.2. Product/Service Portfolio
      3. 7.22.3. INFOTREE Sales, Revenue, and Gross Margin
      4. 7.22.4. INFOTREE Revenue and Growth Rate
      5. 7.22.5. INFOTREE Market Share
      6. 7.22.6. Recent Initiatives, Funding/VC Activities, and Technological Innovations
    23. 7.23. iRez Systems
      1. 7.23.1. Company Overview
      2. 7.23.2. Product/Service Portfolio
      3. 7.23.3. iRez Systems Sales, Revenue, and Gross Margin
      4. 7.23.4. iRez Systems Revenue and Growth Rate
      5. 7.23.5. iRez Systems Market Share
      6. 7.23.6. Recent Initiatives, Funding/VC Activities, and Technological Innovations
    24. 7.24. Jambix
      1. 7.24.1. Company Overview
      2. 7.24.2. Product/Service Portfolio
      3. 7.24.3. Jambix Sales, Revenue, and Gross Margin
      4. 7.24.4. Jambix Revenue and Growth Rate
      5. 7.24.5. Jambix Market Share
      6. 7.24.6. Recent Initiatives, Funding/VC Activities, and Technological Innovations
    25. 7.25. VacationLabs
      1. 7.25.1. Company Overview
      2. 7.25.2. Product/Service Portfolio
      3. 7.25.3. VacationLabs Sales, Revenue, and Gross Margin
      4. 7.25.4. VacationLabs Revenue and Growth Rate
      5. 7.25.5. VacationLabs Market Share
      6. 7.25.6. Recent Initiatives, Funding/VC Activities, and Technological Innovations
    26. 7.26. Amadeus
      1. 7.26.1. Company Overview
      2. 7.26.2. Product/Service Portfolio
      3. 7.26.3. Amadeus Sales, Revenue, and Gross Margin
      4. 7.26.4. Amadeus Revenue and Growth Rate
      5. 7.26.5. Amadeus Market Share
      6. 7.26.6. Recent Initiatives, Funding/VC Activities, and Technological Innovations
    27. 7.27. WeTravel
      1. 7.27.1. Company Overview
      2. 7.27.2. Product/Service Portfolio
      3. 7.27.3. WeTravel Sales, Revenue, and Gross Margin
      4. 7.27.4. WeTravel Revenue and Growth Rate
      5. 7.27.5. WeTravel Market Share
      6. 7.27.6. Recent Initiatives, Funding/VC Activities, and Technological Innovations
  8. Chapter 8 Tour Operator Software — Industry Analysis
    1. 8.1. Introduction and Taxonomy
    2. 8.2. Tour Operator Software Market – Key Trends
      1. 8.2.1. Market Drivers
      2. 8.2.2. Market Restraints
      3. 8.2.3. Market Opportunities
    3. 8.3. Value Chain Analysis
    4. 8.4. Key Mandates and Regulations
    5. 8.5. Technology Roadmap and Timeline
    6. 8.6. Tour Operator Software Market – Attractiveness Analysis
      1. 8.6.1. By Deployment Mode
      2. 8.6.2. By Enterprise Size
      3. 8.6.3. By Subscription Type
      4. 8.6.4. By Region
  9. Chapter 9 Industrial Chain, Sourcing Strategy, and Downstream Buyers
    1. 9.1. Tour Operator Software Industrial Chain Analysis
    2. 9.2. Downstream Buyers
    3. 9.3. Distributors/Traders List
  10. Chapter 10 Marketing Strategy Analysis
    1. 10.1. Marketing Channel
    2. 10.2. Direct Marketing
    3. 10.3. Indirect Marketing
    4. 10.4. Marketing Channel Development Trends
    5. 10.5. Economic/Political Environmental Change
  11. Chapter 11 Report Conclusion & Key Insights
    1. 11.1. Key Insights from Primary Interviews & Surveys Respondents
    2. 11.2. Key Takeaways from Analysts, Consultants, and Industry Leaders
  12. Chapter 12 Research Approach & Methodology
    1. 12.1. Report Description
    2. 12.2. Research Scope
    3. 12.3. Research Methodology
      1. 12.3.1. Secondary Research
      2. 12.3.2. Primary Research
      3. 12.3.3. Statistical Models
        1. 12.3.3.1. Company Share Analysis Model
        2. 12.3.3.2. Revenue Based Modeling
      4. 12.3.4. Research Limitations

  • List of Figures

    Fig.1	Product Picture of Tour Operator Software
    Fig.2	Global Tour Operator Software Market, 2016 – 2026 (USD Million)
    Fig.3	Global Tour Operator Software Market Absolute Revenue Opportunity, 2016 – 2026 (USD Million)
    Fig.4	Global Tour Operator Software Market Incremental Revenue Opportunity, 2020 – 2026 (USD Million)
    Fig.5	Global Tour Operator Software Market Share, by Deployment Mode, 2019 & 2026 (USD Million)
    Fig.6	Global Cloud Based Tour Operator Software Market, 2016 – 2026 (USD Million)
    Fig.7	Global On-Premises Tour Operator Software Market, 2016 – 2026 (USD Million)
    Fig.8	Global Tour Operator Software Market Share, by Enterprise Size, 2019 & 2026 (USD Million)
    Fig.9	Global Large Enterprises Tour Operator Software Market, 2016 – 2026 (USD Million)
    Fig.10	Global Small & Medium Enterprises (SMEs) Tour Operator Software Market, 2016 – 2026 (USD Million)
    Fig.11	Global Tour Operator Software Market Share, by Subscription Type, 2019 & 2026 (USD Million)
    Fig.12	Global One-Time Subscription Tour Operator Software Market, 2016 – 2026 (USD Million)
    Fig.13	Global Monthly Subscription Tour Operator Software Market, 2016 – 2026 (USD Million)
    Fig.14	Global Annual Subscription Tour Operator Software Market, 2016 – 2026 (USD Million)
    Fig.15	Global Tour Operator Software Market Share, by Region, 2019 & 2026 (USD Million)
    Fig.16	North America Tour Operator Software Market, 2016 – 2026 (USD Million)
    Fig.17	U.S. Tour Operator Software Market, 2016 – 2026 (USD Million)
    Fig.18	Canada Tour Operator Software Market, 2016 – 2026 (USD Million)
    Fig.19	Europe Tour Operator Software Market, 2016 – 2026 (USD Million)
    Fig.20	Germany Tour Operator Software Market, 2016 – 2026 (USD Million)
    Fig.21	France Tour Operator Software Market, 2016 – 2026 (USD Million)
    Fig.22	U.K. Tour Operator Software Market, 2016 – 2026 (USD Million)
    Fig.23	Italy Tour Operator Software Market, 2016 – 2026 (USD Million)
    Fig.24	Spain Tour Operator Software Market, 2016 – 2026 (USD Million)
    Fig.25	Rest of Europe Tour Operator Software Market, 2016 – 2026 (USD Million)
    Fig.26	Asia Pacific Tour Operator Software Market, 2016 – 2026 (USD Million)
    Fig.27	China Tour Operator Software Market, 2016 – 2026 (USD Million)
    Fig.28	Japan Tour Operator Software Market, 2016 – 2026 (USD Million)
    Fig.29	India Tour Operator Software Market, 2016 – 2026 (USD Million)
    Fig.30	South  Korea Tour Operator Software Market, 2016 – 2026 (USD Million)
    Fig.31	South-East Asia Tour Operator Software Market, 2016 – 2026 (USD Million)
    Fig.32	Rest of Asia Pacific Tour Operator Software Market, 2016 – 2026 (USD Million)
    Fig.33	Latin America Tour Operator Software Market, 2016 – 2026 (USD Million)
    Fig.34	Brazil Tour Operator Software Market, 2016 – 2026 (USD Million)
    Fig.35	Mexico Tour Operator Software Market, 2016 – 2026 (USD Million)
    Fig.36	Rest of Latin America Tour Operator Software Market, 2016 – 2026 (USD Million)
    Fig.37	The Middle-East and Africa Tour Operator Software Market, 2016 – 2026 (USD Million)
    Fig.38	GCC Countries Tour Operator Software Market, 2016 – 2026 (USD Million)
    Fig.39	South Africa Tour Operator Software Market, 2016 – 2026 (USD Million)
    Fig.40	Rest of Middle-East Africa Tour Operator Software Market, 2016 – 2026 (USD Million)
    Fig.41	Competitor Market Share – Revenue
    Fig.42	Travefy Inc. Revenue and Growth Rate
    Fig.43	Travefy Inc. Market Share
    Fig.44	Rezdy Revenue and Growth Rate
    Fig.45	Rezdy Market Share
    Fig.46	TrekkSoft Revenue and Growth Rate
    Fig.47	TrekkSoft Market Share
    Fig.48	Checkfront Inc. Revenue and Growth Rate
    Fig.49	Checkfront Inc. Market Share
    Fig.50	Xola Inc. Revenue and Growth Rate
    Fig.51	Xola Inc. Market Share
    Fig.52	Tourplan Revenue and Growth Rate
    Fig.53	Tourplan Market Share
    Fig.54	Trawex Technologies Pvt Ltd. Revenue and Growth Rate
    Fig.55	Trawex Technologies Pvt Ltd. Market Share
    Fig.56	GP Solutions GmbH Revenue and Growth Rate
    Fig.57	GP Solutions GmbH Market Share
    Fig.58	Qtech Software Revenue and Growth Rate
    Fig.59	Qtech Software Market Share
    Fig.60	TraveloPro Revenue and Growth Rate
    Fig.61	TraveloPro Market Share
    Fig.62	TRYTN Inc. Revenue and Growth Rate
    Fig.63	TRYTN Inc. Market Share
    Fig.64	TechnoHeaven Consultancy Revenue and Growth Rate
    Fig.65	TechnoHeaven Consultancy Market Share
    Fig.66	IT Web Services Revenue and Growth Rate
    Fig.67	IT Web Services Market Share
    Fig.68	Retreat Guru Revenue and Growth Rate
    Fig.69	Retreat Guru Market Share
    Fig.70	eMinds Revenue and Growth Rate
    Fig.71	eMinds Market Share
    Fig.72	Adventure Bucket List Revenue and Growth Rate
    Fig.73	Adventure Bucket List Market Share
    Fig.74	Dolphin Dynamics Revenue and Growth Rate
    Fig.75	Dolphin Dynamics Market Share
    Fig.76	Centaur Systems Revenue and Growth Rate
    Fig.77	Centaur Systems Market Share
    Fig.78	WebBookingExpert Revenue and Growth Rate
    Fig.79	WebBookingExpert Market Share
    Fig.80	Tenet Enterprises Solutions Revenue and Growth Rate
    Fig.81	Tenet Enterprises Solutions Market Share
    Fig.82	Lemax Systems Revenue and Growth Rate
    Fig.83	Lemax Systems Market Share
    Fig.84	INFOTREE Revenue and Growth Rate
    Fig.85	INFOTREE Market Share
    Fig.86	iRez Systems Revenue and Growth Rate
    Fig.87	iRez Systems Market Share
    Fig.88	Jambix Revenue and Growth Rate
    Fig.89	Jambix Market Share
    Fig.90	VacationLabs Revenue and Growth Rate
    Fig.91	VacationLabs Market Share
    Fig.92	Amadeus Revenue and Growth Rate
    Fig.93	Amadeus Market Share
    Fig.94	WeTravel Revenue and Growth Rate
    Fig.95	WeTravel Market Share
    Fig.96	Market Dynamics
    Fig.97	Global Tour Operator Software – Value Chain Analysis
    Fig.98	Key Mandates and Regulations
    Fig.99	Technology Roadmap and Timeline
    Fig.100	Market Attractiveness Analysis – By Deployment Mode
    Fig.101	Market Attractiveness Analysis – By Enterprise Size
    Fig.102	Market Attractiveness Analysis – By Subscription Type
    Fig.103	Market Attractiveness Analysis – By Region
    Fig.104	Tour Operator Software Industrial Chain Analysis
    Fig.105	Market Channels
    Fig.106	Marketing Channel Development Trend
    Fig.107	Growth in World Gross Product, 2008-2018
    

    List of Tables

    Table 1	Global Tour Operator Software Market, 2019 & 2026 (USD Million)
    Table 2	Global Tour Operator Software Market, by Deployment Mode, 2016 – 2026 (USD Million)
    Table 3	Global Tour Operator Software Market, by Enterprise Size, 2016 – 2026 (USD Million)
    Table 4	Global Tour Operator Software Market, by Subscription Type, 2016 – 2026 (USD Million)
    Table 5	Global Tour Operator Software Market, by Region, 2016 – 2026 (USD Million)
    Table 6	North America Tour Operator Software Market, by Country, 2016 – 2026 (USD Million)
    Table 7	North America Tour Operator Software Market, by Deployment Mode, 2016 – 2026 (USD Million)
    Table 8	North America Tour Operator Software Market, by Enterprise Size, 2016 – 2026 (USD Million)
    Table 9	North America Tour Operator Software Market, by Subscription Type, 2016 – 2026 (USD Million)
    Table 10 Europe Tour Operator Software Market, by Country, 2016 – 2026 (USD Million)
    Table 11 Europe Tour Operator Software Market, by Deployment Mode, 2016 – 2026 (USD Million)
    Table 12 Europe Tour Operator Software Market, by Enterprise Size, 2016 – 2026 (USD Million)
    Table 13 Europe Tour Operator Software Market, by Subscription Type, 2016 – 2026 (USD Million)
    Table 14 Asia Pacific Tour Operator Software Market, by Country, 2016 – 2026 (USD Million)
    Table 15 Asia Pacific Tour Operator Software Market, by Deployment Mode, 2016 – 2026 (USD Million)
    Table 16 Asia Pacific Tour Operator Software Market, by Enterprise Size, 2016 – 2026 (USD Million)
    Table 17 Asia Pacific Tour Operator Software Market, by Subscription Type, 2016 – 2026 (USD Million)
    Table 18 Latin America Tour Operator Software Market, by Country, 2016 – 2026 (USD Million)
    Table 19 Latin America Tour Operator Software Market, by Deployment Mode, 2016 – 2026 (USD Million)
    Table 20 Latin America Tour Operator Software Market, by Enterprise Size, 2016 – 2026 (USD Million)
    Table 21 Latin America Tour Operator Software Market, by Subscription Type, 2016 – 2026 (USD Million)
    Table 22 The Middle-East and Africa Tour Operator Software Market, by Country, 2016 – 2026 (USD Million)
    Table 23 The Middle-East and Africa Tour Operator Software Market, by Deployment Mode, 2016 – 2026 (USD Million)
    Table 24 The Middle-East and Africa Tour Operator Software Market, by Enterprise Size, 2016 – 2026 (USD Million)
    Table 25 The Middle-East and Africa Tour Operator Software Market, by Subscription Type, 2016 – 2026 (USD Million)
    Table 26 Global Tour Operator Software Market - Company Revenue Analysis, 2016 – 2019 (USD Million)
    Table 27 Global Tour Operator Software Market - Company Revenue Share Analysis, 2016 – 2019 (%)
    Table 28 Acquisitions and Mergers
    Table 29 Market Drivers – Impact Analysis
    Table 30 Market Restraints
    Table 31 Market Opportunities
    Table 32 Major Buyers of Tour Operator Software
    Table 33 Distributors/Traders of Tour Operator Software by Region
    
  •  

    Industry Major Market Players

    • Travefy Inc.
    • Rezdy
    • TrekkSoft
    • Checkfront Inc.
    • Xola Inc.
    • Tourplan
    • Trawex Technologies Pvt Ltd.
    • GP Solutions GmbH
    • Qtech Software
    • TraveloPro
    • TRYTN Inc.
    • TechnoHeaven Consultancy
    • IT Web Services
    • Retreat Guru
    • eMinds
    • Adventure Bucket List
    • Dolphin Dynamics
    • Centaur Systems
    • WebBookingExpert
    • Tenet Enterprises Solutions
    • Lemax Systems
    • INFOTREE
    • iRez Systems
    • Jambix
    • VacationLabs
    • Amadeus
    • WeTravel