Search Market Research Report

Discover Our Latest Reports
Discover Our Featured Reports
Discover Top Selling Reports

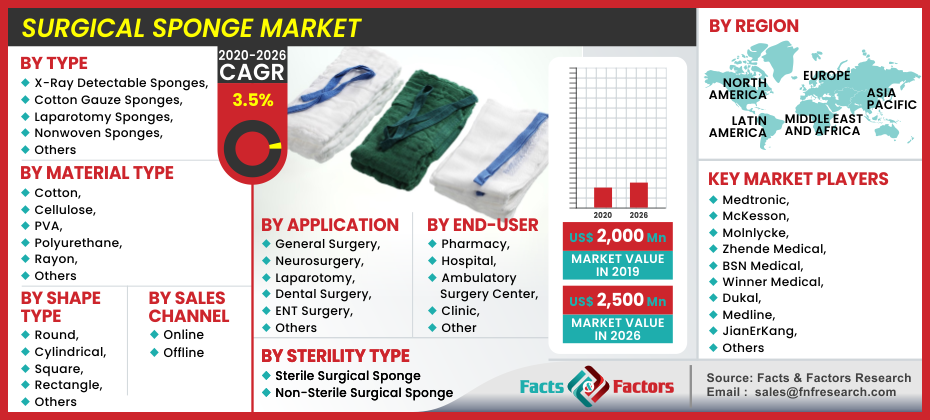
Surgical Sponge Market Size, Share Global Analysis Report, , 2020 – 2026

report img

Surgical Sponge Market By Type (X-Ray Detectable Sponges, Cotton Gauze Sponges, Laparotomy Sponges, Nonwoven Sponges, and Others), By Material Type (Cotton, Cellulose, PVA, Polyurethane, Rayon, and Others), By Shape Type (Round, Cylindrical, Square, Rectangle, and Others), By Sterility Type (Sterile Surgical Sponge and Non-Sterile Surgical Sponge), By Sales Channel (Online and Offline), By Application (General Surgery, Neurosurgery, Laparotomy, Dental Surgery, ENT Surgery, and Others), By End-User (Pharmacy, Hospital, Ambulatory Surgery Center, Clinic, and Others): Global Industry Perspective, Comprehensive Analysis, and Forecast, 2020 – 2026

Industry Insights

[195+ Pages Report] According to the report published by Facts & Factors, the global surgical sponge market was estimated at approximately USD 2,000 Million in 2019 and is anticipated to generate revenue of around USD 2,500 Million by end of 2026, growing at a CAGR of around 3.5% between 2020 and 2026.

logoMarket Overview

A surgical sponge is a kind of cotton pad that is used in surgeries for absorbing blood and other liquid discharge from the body. These sponges help in controlling bleeding as well as for cleaning wounds. The common sizes available of the surgical sponge are 5 cm x 5 cm, 7 cm x 7 cm, and 10 cm x 10 cm. These surgical sponges are available in various shapes and material type and their sterility type depends upon the raw material through which the sponge is made. They are also prepared using non-woven materials which facilitate in removing the dead tissue from the skin surface and prevents the discharge of any kind of liquid from the wound on the secondary dressing to avoid maceration of the skin tissue. These sponges can be reused or can be disposed of easily. They are also very easily available at clinics and hospitals are they are very essential while performing any kind of surgery.

logoIndustry Growth Factors

Increased alliances and agreements among manufacturers for vaccine production and research & development is a key factor driving the surgical sponges market. Other major factors driving the surgical sponges market include rising cesarean rates around the world, a rise in the number of injuries, and an increase in the geriatric population, among others. Patients' changing tastes from open surgeries to minimally invasive surgical procedures are limiting factors for the surgical sponges' industry, which will pose a further challenge to the market's growth in the forecasted timeframe. In the forecasted period of 2020-2027, technological advances and new varieties of surgical sponges are expected to generate opportunities for the surgical sponge industry.

Surgical Sponge Market

To know more about this report | Request Free Sample Copy

logoSegmentation Analysis

Based on type segmentation, the surgical sponge market is divided into x-ray detectable sponges, cotton gauze sponges, laparotomy sponges, nonwoven sponges, and others. The cotton gauze sponges are expected to hold the maximum market share owing to their high fluid absorbency. The cotton gauze sponges are used at all levels, from medical to corporate to personal. The substance control act governs this medication. As a result, it should be assembled to meet its quality management criteria. To have optimum protection and avoid friction, the cotton sponge should be chemically inert and smooth.

These properties can be obtained by making the substance according to industry standards. Raw cotton is refined into a sequence of steps to make it hydro-phallic and free of foreign impurities, making it ideal for surgical dressings and personal grooming. Cotton gauze sponge demand is closely linked to hospitals, dispensaries, nursing homes, and health care centers, among other places, boosting its demand in the surgical sponge sector. Based on material type, the market is segmented into cotton, cellulose, PVA, polyurethane, rayon, and others.

Cotton type, followed by cellulose material type is estimated to show maximum share as they are 100% natural and are biodegradable in nature. They are super absorbent and are able to clean up any kind of body liquid during surgeries and can even be used for sterilization of wounds by applying the sterilizing liquid on the cotton surface without causing any kind of side effect on human health.

On the basis of shape type, the market is bifurcated into round, cylindrical, square, rectangle, and others. The rectangle-shaped surgical sponge is widely used in surgeries as they are small and can be easily held in the hands. They can effectively wall off the surgical site and collect fluids, monitor hemostasis, and keep the surgical area clean and dry. These sponges are used for sensitive dissection and can also be used to mitigate tissue damage during fluid aspiration by placing them between the tissue and the suction tip. Based on the sterility type, the market is split into sterile surgical sponges and non-sterile surgical sponges.

The non-sterile surgical sponges are widely used by hospitals and clinics as they are more cost-effective compared with sterile surgical sponges, providing good cushioning support to any cuts or wounds. Based on the sales channel, an online sales channel is widely preferred as they provide consumers benefit from improved availability, lower purchase and medication prices, accessibility, and greater privacy. They also have connectivity to those with reduced mobility and others living in rural areas. Based on the application segment, the market is split into general surgery, neurosurgery, laparotomy, dental surgery, ent surgery, and others, in which the general surgery type shows the maximum usage of surgical sponges. The end-user segment is divided into pharmacy, hospital, ambulatory surgery center, clinic, and others. The hospital segment is considered to be the leading segment as a major count of surgeries of various types are operated at big hospitals owing to its big infrastructural and advanced medical facilities.

logoReport Scope

Report Attributes

Details

Market Size in 2019

USD 2,000 Million

Projected Market Size in 2026

USD 2,500 Million

Growth Rate

CAGR 3.5%

Base Year

2019

Forecast Years

2020 – 2026

Key Market Players

ASC, Zhende Medical, Medtronic, Medicom, Molnlycke, Texpol, BSN medical, Dukal, Medline, Kettenbach, Cardinal Health, Crosstex, Hartmann, Allmed Medical, Lohmann &, Rauscher, Deroyal, Ahlstrom, Hakuzo, Owens & Minor, JianErKang, B. Braun, Winner Medical, and McKesson among others.

Key Segment

By Type, By Material, By Shape Type, By Sterility Type, By Sales Channel, By Segmentation, By End-User, By Regional

Major Regions Covered

North America, Europe, Asia Pacific, Latin America, and the Middle East & Africa

Purchase Options

Request customized purchase options to meet your research needs. Explore purchase options

logo Regional Analysis

Owing to the well-developed medical technology, an increase in patients with illnesses requiring surgery, the reports of road accidents, high healthcare expenditures, and expanded government support for research and development activities, North America is expected to dominate the surgical sponge market over the forecasted timeframe. Furthermore, the country's presence of cutting-edge facilities will fuel market growth in the immediate future. In the coming years, the presence of major top corporations in the region is projected to fuel business growth. For instance, Stryker Corporation unveiled a surgical protection enterprise in September 2017 with a no-mistakes sponge device.

The program was dependent upon sponges who were bar-coded and sterile in nature for avoiding any kind of infection of virus transfusion and a digital console with open source software to keep track of all sponges. The machine boasted zero sponges left behind after nearly 11 million surgical operations over the past five years, including the usage of more than 200 million sponges. Because of the growing population and increasingly evolving healthcare services and technology, Asia Pacific is projected to have the highest CAGR. Furthermore, the growing aging population and demand for high-quality medical devices are likely to contribute to more specialized appliances being used, boosting surgical sponge market growth in the region.

logo Competitive Players

The major players dominating the global surgical sponge market in terms of revenue and development are

  • Medtronic
  • McKesson
  • Molnlycke
  • Zhende Medical
  • BSN Medical
  • Winner Medical
  • Dukal, Medline
  • JianErKang
  • Cardinal Health
  • Hakuzo
  • Hartmann
  • Texpol,
  • Deroyal
  • Lohmann & Rauscher
  • Allmed Medical
  • Ahlstrom
  • ASC
  • Medicom
  • Owens & Minor
  • Crosstex
  • B. Braun
  • Kettenbach

These major companies have used a variety of strategies to gain a respectable presence in the world market, including signing agreements, stakes, loans, partnerships, joint ventures, new product launches, agreements, and mergers and acquisitions. Signing deals, shares, leases, alliances, joint ventures, new product sales, collaborations, and mergers and acquisitions have all been used by these large corporations to gain a reputable position in the world economy.

For instance, ProCell Surgical Inc. launched ProCellTM in June 2020, a patented and newly designed medical technology that completely automated intraoperative autotransfusion (IAT) which traditionally used the manual and obsolete method of surgical sponge-blood recovery.

logoSurgical Sponge Market: Regional Segment Analysis

  • North America
    • U.S.
    • Canada
  • Europe
    • U.K.
    • France
    • Germany
    • Rest of Europe
  • Asia Pacific
    • China
    • Japan
    • India
    • South Korea
    • Rest of Asia Pacific
  • Latin America
    • Brazil
    • Rest of Latin America
  • The Middle East and Africa
    • GCC Countries
    • South Africa
    • Rest of MEA

Table of Content

  1. Chapter 1 Executive Summary
    1. 1.1. Introduction of Surgical Sponge
    2. 1.2. Global Surgical Sponge Market, 2019 & 2026 (USD Million)
    3. 1.3. Global Surgical Sponge Market, 2016 – 2026 (USD Million)
    4. 1.4. Global Surgical Sponge Market Absolute Revenue Opportunity, 2016 – 2026 (USD Million)
    5. 1.5. Global Surgical Sponge Market Incremental Revenue Opportunity, 2020 – 2026 (USD Million)
  2. Chapter 2 Surgical Sponge Market – Type Analysis
    1. 2.1. Global Surgical Sponge Market – Type Overview
    2. 2.2. Global Surgical Sponge Market Share, by Type, 2019 & 2026 (USD Million)
    3. 2.3. X-Ray Detectable Sponges
      1. 2.3.1. Global X-Ray Detectable Sponges Surgical Sponge Market, 2016 – 2026 (USD Million)
    4. 2.4. Cotton Gauze Sponges
      1. 2.4.1. Global Cotton Gauze Sponges Surgical Sponge Market, 2016 – 2026 (USD Million)
    5. 2.5. Laparotomy Sponges
      1. 2.5.1. Global Laparotomy Sponges Surgical Sponge Market, 2016 – 2026 (USD Million)
    6. 2.6. Nonwoven Sponges
      1. 2.6.1. Global Nonwoven Sponges Surgical Sponge Market, 2016 – 2026 (USD Million)
    7. 2.7. Others
      1. 2.7.1. Global Others Surgical Sponge Market, 2016 – 2026 (USD Million)
  3. Chapter 3 Surgical Sponge Market – Material Type Analysis
    1. 3.1. Global Surgical Sponge Market – Material Type Overview
    2. 3.2. Global Surgical Sponge Market Share, by Material Type, 2019 & 2026 (USD Million)
    3. 3.3. Cotton
      1. 3.3.1. Global Cotton Surgical Sponge Market, 2016 – 2026 (USD Million)
    4. 3.4. Cellulose
      1. 3.4.1. Global Cellulose Surgical Sponge Market, 2016 – 2026 (USD Million)
    5. 3.5. PVA
      1. 3.5.1. Global PVA Surgical Sponge Market, 2016 – 2026 (USD Million)
    6. 3.6. Polyurethane
      1. 3.6.1. Global Polyurethane Surgical Sponge Market, 2016 – 2026 (USD Million)
    7. 3.7. Rayon
      1. 3.7.1. Global Rayon Surgical Sponge Market, 2016 – 2026 (USD Million)
    8. 3.8. Others
      1. 3.8.1. Global Others Surgical Sponge Market, 2016 – 2026 (USD Million)
  4. Chapter 4 Surgical Sponge Market – Shape Type Analysis
    1. 4.1. Global Surgical Sponge Market – Shape Type Overview
    2. 4.2. Global Surgical Sponge Market Share, by Shape Type, 2019 & 2026 (USD Million)
    3. 4.3. Round
      1. 4.3.1. Global Round Surgical Sponge Market, 2016 – 2026 (USD Million)
    4. 4.4. Cylindrical
      1. 4.4.1. Global Cylindrical Surgical Sponge Market, 2016 – 2026 (USD Million)
    5. 4.5. Square
      1. 4.5.1. Global Square Surgical Sponge Market, 2016 – 2026 (USD Million)
    6. 4.6. Rectangle
      1. 4.6.1. Global Rectangle Surgical Sponge Market, 2016 – 2026 (USD Million)
    7. 4.7. Others
      1. 4.7.1. Global Others Surgical Sponge Market, 2016 – 2026 (USD Million)
  5. Chapter 5 Surgical Sponge Market – Sterility Type Analysis
    1. 5.1. Global Surgical Sponge Market – Sterility Type Overview
    2. 5.2. Global Surgical Sponge Market Share, by Sterility Type, 2019 & 2026 (USD Million)
    3. 5.3. Sterile Surgical Sponge
      1. 5.3.1. Global Sterile Surgical Sponge Surgical Sponge Market, 2016 – 2026 (USD Million)
    4. 5.4. Non-Sterile Surgical Sponge
      1. 5.4.1. Global Non-Sterile Surgical Sponge Surgical Sponge Market, 2016 – 2026 (USD Million)
  6. Chapter 6 Surgical Sponge Market – Sales Channel Analysis
    1. 6.1. Global Surgical Sponge Market – Sales Channel Overview
    2. 6.2. Global Surgical Sponge Market Share, by Sales Channel, 2019 & 2026 (USD Million)
    3. 6.3. Online
      1. 6.3.1. Global Online Surgical Sponge Market, 2016 – 2026 (USD Million)
    4. 6.4. Offline
      1. 6.4.1. Global Offline Surgical Sponge Market, 2016 – 2026 (USD Million)
  7. Chapter 7 Surgical Sponge Market – Application Analysis
    1. 7.1. Global Surgical Sponge Market – Application Overview
    2. 7.2. Global Surgical Sponge Market Share, by Application, 2019 & 2026 (USD Million)
    3. 7.3. General Surgery
      1. 7.3.1. Global General Surgery Surgical Sponge Market, 2016 – 2026 (USD Million)
    4. 7.4. Neurosurgery
      1. 7.4.1. Global Neurosurgery Surgical Sponge Market, 2016 – 2026 (USD Million)
    5. 7.5. Laparotomy
      1. 7.5.1. Global Laparotomy Surgical Sponge Market, 2016 – 2026 (USD Million)
    6. 7.6. Dental Surgery
      1. 7.6.1. Global Dental Surgery Surgical Sponge Market, 2016 – 2026 (USD Million)
    7. 7.7. ENT Surgery
      1. 7.7.1. Global ENT Surgery Surgical Sponge Market, 2016 – 2026 (USD Million)
    8. 7.8. Others
      1. 7.8.1. Global Others Surgical Sponge Market, 2016 – 2026 (USD Million)
  8. Chapter 8 Surgical Sponge Market – End-User Analysis
    1. 8.1. Global Surgical Sponge Market – End-User Overview
    2. 8.2. Global Surgical Sponge Market Share, by End-User, 2019 & 2026 (USD Million)
    3. 8.3. Pharmacy
      1. 8.3.1. Global Pharmacy Surgical Sponge Market, 2016 – 2026 (USD Million)
    4. 8.4. Hospital
      1. 8.4.1. Global Hospital Surgical Sponge Market, 2016 – 2026 (USD Million)
    5. 8.5. Ambulatory Surgery Center
      1. 8.5.1. Global Ambulatory Surgery Center Surgical Sponge Market, 2016 – 2026 (USD Million)
    6. 8.6. Clinic
      1. 8.6.1. Global Clinic Surgical Sponge Market, 2016 – 2026 (USD Million)
    7. 8.7. Others
      1. 8.7.1. Global Others Surgical Sponge Market, 2016 – 2026 (USD Million)
  9. Chapter 9 Surgical Sponge Market – Regional Analysis
    1. 9.1. Global Surgical Sponge Market Regional Overview
    2. 9.2. Global Surgical Sponge Market Share, by Region, 2019 & 2026 (USD Million)
    3. 9.3. North America
      1. 9.3.1. North America Surgical Sponge Market, 2016 – 2026 (USD Million)
        1. 9.3.1.1. North America Surgical Sponge Market, by Country, 2016 - 2026 (USD Million)
      2. 9.3.2. North America Surgical Sponge Market, by Type, 2016 – 2026
        1. 9.3.2.1. North America Surgical Sponge Market, by Type, 2016 – 2026 (USD Million)
      3. 9.3.3. North America Surgical Sponge Market, by Material Type, 2016 – 2026
        1. 9.3.3.1. North America Surgical Sponge Market, by Material Type, 2016 – 2026 (USD Million)
      4. 9.3.4. North America Surgical Sponge Market, by Shape Type, 2016 – 2026
        1. 9.3.4.1. North America Surgical Sponge Market, by Shape Type, 2016 – 2026 (USD Million)
      5. 9.3.5. North America Surgical Sponge Market, by Sterility Type, 2016 – 2026
        1. 9.3.5.1. North America Surgical Sponge Market, by Sterility Type, 2016 – 2026 (USD Million)
      6. 9.3.6. North America Surgical Sponge Market, by Sales Channel, 2016 – 2026
        1. 9.3.6.1. North America Surgical Sponge Market, by Sales Channel, 2016 – 2026 (USD Million)
      7. 9.3.7. North America Surgical Sponge Market, by Application, 2016 – 2026
        1. 9.3.7.1. North America Surgical Sponge Market, by Application, 2016 – 2026 (USD Million)
      8. 9.3.8. North America Surgical Sponge Market, by End-User, 2016 – 2026
        1. 9.3.8.1. North America Surgical Sponge Market, by End-User, 2016 – 2026 (USD Million)
      9. 9.3.9. U.S.
        1. 9.3.9.1. U.S. Surgical Sponge Market, 2016 – 2026 (USD Million)
      10. 9.3.10. Canada
        1. 9.3.10.1. Canada Surgical Sponge Market, 2016 – 2026 (USD Million)
    4. 9.4. Europe
      1. 9.4.1. Europe Surgical Sponge Market, 2016 – 2026 (USD Million)
        1. 9.4.1.1. Europe Surgical Sponge Market, by Country, 2016 - 2026 (USD Million)
      2. 9.4.2. Europe Surgical Sponge Market, by Type, 2016 – 2026
        1. 9.4.2.1. Europe Surgical Sponge Market, by Type, 2016 – 2026 (USD Million)
      3. 9.4.3. Europe Surgical Sponge Market, by Material Type, 2016 – 2026
        1. 9.4.3.1. Europe Surgical Sponge Market, by Material Type, 2016 – 2026 (USD Million)
      4. 9.4.4. Europe Surgical Sponge Market, by Shape Type, 2016 – 2026
        1. 9.4.4.1. Europe Surgical Sponge Market, by Shape Type, 2016 – 2026 (USD Million)
      5. 9.4.5. Europe Surgical Sponge Market, by Sterility Type, 2016 – 2026
        1. 9.4.5.1. Europe Surgical Sponge Market, by Sterility Type, 2016 – 2026 (USD Million)
      6. 9.4.6. Europe Surgical Sponge Market, by Sales Channel, 2016 – 2026
        1. 9.4.6.1. Europe Surgical Sponge Market, by Sales Channel, 2016 – 2026 (USD Million)
      7. 9.4.7. Europe Surgical Sponge Market, by Application, 2016 – 2026
        1. 9.4.7.1. Europe Surgical Sponge Market, by Application, 2016 – 2026 (USD Million)
      8. 9.4.8. Europe Surgical Sponge Market, by End-User, 2016 – 2026
        1. 9.4.8.1. Europe Surgical Sponge Market, by End-User, 2016 – 2026 (USD Million)
      9. 9.4.9. Germany
        1. 9.4.9.1. Germany Surgical Sponge Market, 2016 – 2026 (USD Million)
      10. 9.4.10. France
        1. 9.4.10.1. France Surgical Sponge Market, 2016 – 2026 (USD Million)
      11. 9.4.11. U.K.
        1. 9.4.11.1. U.K. Surgical Sponge Market, 2016 – 2026 (USD Million)
      12. 9.4.12. Italy
        1. 9.4.12.1. Italy Surgical Sponge Market, 2016 – 2026 (USD Million)
      13. 9.4.13. Spain
        1. 9.4.13.1. Spain Surgical Sponge Market, 2016 – 2026 (USD Million)
      14. 9.4.14. Rest of Europe
        1. 9.4.14.1. Rest of Europe Surgical Sponge Market, 2016 – 2026 (USD Million)
    5. 9.5. Asia Pacific
      1. 9.5.1. Asia Pacific Surgical Sponge Market, 2016 – 2026 (USD Million)
        1. 9.5.1.1. Asia Pacific Surgical Sponge Market, by Country, 2016 - 2026 (USD Million)
      2. 9.5.2. Asia Pacific Surgical Sponge Market, by Type, 2016 – 2026
        1. 9.5.2.1. Asia Pacific Surgical Sponge Market, by Type, 2016 – 2026 (USD Million)
      3. 9.5.3. Asia Pacific Surgical Sponge Market, by Material Type, 2016 – 2026
        1. 9.5.3.1. Asia Pacific Surgical Sponge Market, by Material Type, 2016 – 2026 (USD Million)
      4. 9.5.4. Asia Pacific Surgical Sponge Market, by Shape Type, 2016 – 2026
        1. 9.5.4.1. Asia Pacific Surgical Sponge Market, by Shape Type, 2016 – 2026 (USD Million)
      5. 9.5.5. Asia Pacific Surgical Sponge Market, by Sterility Type, 2016 – 2026
        1. 9.5.5.1. Asia Pacific Surgical Sponge Market, by Sterility Type, 2016 – 2026 (USD Million)
      6. 9.5.6. Asia Pacific Surgical Sponge Market, by Sales Channel, 2016 – 2026
        1. 9.5.6.1. Asia Pacific Surgical Sponge Market, by Sales Channel, 2016 – 2026 (USD Million)
      7. 9.5.7. Asia Pacific Surgical Sponge Market, by Application, 2016 – 2026
        1. 9.5.7.1. Asia Pacific Surgical Sponge Market, by Application, 2016 – 2026 (USD Million)
      8. 9.5.8. Asia Pacific Surgical Sponge Market, by End-User, 2016 – 2026
        1. 9.5.8.1. Asia Pacific Surgical Sponge Market, by End-User, 2016 – 2026 (USD Million)
      9. 9.5.9. China
        1. 9.5.9.1. China Surgical Sponge Market, 2016 – 2026 (USD Million)
      10. 9.5.10. Japan
        1. 9.5.10.1. Japan Surgical Sponge Market, 2016 – 2026 (USD Million)
      11. 9.5.11. India
        1. 9.5.11.1. India Surgical Sponge Market, 2016 – 2026 (USD Million)
      12. 9.5.12. South Korea
        1. 9.5.12.1. South Korea Surgical Sponge Market, 2016 – 2026 (USD Million)
      13. 9.5.13. South-East Asia
        1. 9.5.13.1. South-East Asia Surgical Sponge Market, 2016 – 2026 (USD Million)
      14. 9.5.14. Rest of Asia Pacific
        1. 9.5.14.1. Rest of Asia Pacific Surgical Sponge Market, 2016 – 2026 (USD Million)
    6. 9.6. Latin America
      1. 9.6.1. Latin America Surgical Sponge Market, 2016 – 2026 (USD Million)
        1. 9.6.1.1. Latin America Surgical Sponge Market, by Country, 2016 - 2026 (USD Million)
      2. 9.6.2. Latin America Surgical Sponge Market, by Type, 2016 – 2026
        1. 9.6.2.1. Latin America Surgical Sponge Market, by Type, 2016 – 2026 (USD Million)
      3. 9.6.3. Latin America Surgical Sponge Market, by Material Type, 2016 – 2026
        1. 9.6.3.1. Latin America Surgical Sponge Market, by Material Type, 2016 – 2026 (USD Million)
      4. 9.6.4. Latin America Surgical Sponge Market, by Shape Type, 2016 – 2026
        1. 9.6.4.1. Latin America Surgical Sponge Market, by Shape Type, 2016 – 2026 (USD Million)
      5. 9.6.5. Latin America Surgical Sponge Market, by Sterility Type, 2016 – 2026
        1. 9.6.5.1. Latin America Surgical Sponge Market, by Sterility Type, 2016 – 2026 (USD Million)
      6. 9.6.6. Latin America Surgical Sponge Market, by Sales Channel, 2016 – 2026
        1. 9.6.6.1. Latin America Surgical Sponge Market, by Sales Channel, 2016 – 2026 (USD Million)
      7. 9.6.7. Latin America Surgical Sponge Market, by Application, 2016 – 2026
        1. 9.6.7.1. Latin America Surgical Sponge Market, by Application, 2016 – 2026 (USD Million)
      8. 9.6.8. Latin America Surgical Sponge Market, by End-User, 2016 – 2026
        1. 9.6.8.1. Latin America Surgical Sponge Market, by End-User, 2016 – 2026 (USD Million)
      9. 9.6.9. Brazil
        1. 9.6.9.1. Brazil Surgical Sponge Market, 2016 – 2026 (USD Million)
      10. 9.6.10. Mexico
        1. 9.6.10.1. Mexico Surgical Sponge Market, 2016 – 2026 (USD Million)
      11. 9.6.11. Rest of Latin America
        1. 9.6.11.1. Rest of Latin America Surgical Sponge Market, 2016 – 2026 (USD Million)
    7. 9.7. The Middle-East and Africa
      1. 9.7.1. The Middle-East and Africa Surgical Sponge Market, 2016 – 2026 (USD Million)
        1. 9.7.1.1. The Middle-East and Africa Surgical Sponge Market, by Country, 2016 - 2026 (USD Million)
      2. 9.7.2. The Middle-East and Africa Surgical Sponge Market, by Type, 2016 – 2026
        1. 9.7.2.1. The Middle-East and Africa Surgical Sponge Market, by Type, 2016 – 2026 (USD Million)
      3. 9.7.3. The Middle-East and Africa Surgical Sponge Market, by Material Type, 2016 – 2026
        1. 9.7.3.1. The Middle-East and Africa Surgical Sponge Market, by Material Type, 2016 – 2026 (USD Million)
      4. 9.7.4. The Middle-East and Africa Surgical Sponge Market, by Shape Type, 2016 – 2026
        1. 9.7.4.1. The Middle-East and Africa Surgical Sponge Market, by Shape Type, 2016 – 2026 (USD Million)
      5. 9.7.5. The Middle-East and Africa Surgical Sponge Market, by Sterility Type, 2016 – 2026
        1. 9.7.5.1. The Middle-East and Africa Surgical Sponge Market, by Sterility Type, 2016 – 2026 (USD Million)
      6. 9.7.6. The Middle-East and Africa Surgical Sponge Market, by Sales Channel, 2016 – 2026
        1. 9.7.6.1. The Middle-East and Africa Surgical Sponge Market, by Sales Channel, 2016 – 2026 (USD Million)
      7. 9.7.7. The Middle-East and Africa Surgical Sponge Market, by Application, 2016 – 2026
        1. 9.7.7.1. The Middle-East and Africa Surgical Sponge Market, by Application, 2016 – 2026 (USD Million)
      8. 9.7.8. The Middle-East and Africa Surgical Sponge Market, by End-User, 2016 – 2026
        1. 9.7.8.1. The Middle-East and Africa Surgical Sponge Market, by End-User, 2016 – 2026 (USD Million)
      9. 9.7.9. GCC Countries
        1. 9.7.9.1. GCC Countries Surgical Sponge Market, 2016 – 2026 (USD Million)
      10. 9.7.10. South Africa
        1. 9.7.10.1. South Africa Surgical Sponge Market, 2016 – 2026 (USD Million)
      11. 9.7.11. Rest of Middle-East Africa
        1. 9.7.11.1. Rest of Middle-East Africa Surgical Sponge Market, 2016 – 2026 (USD Million)
  10. Chapter 10 Surgical Sponge Market – Competitive Landscape
    1. 10.1. Competitor Market Share – Revenue
    2. 10.2. Market Concentration Rate Analysis, Top 3 and Top 5 Players
    3. 10.3. Strategic Developments
      1. 10.3.1. Acquisitions and Mergers
      2. 10.3.2. New Products
      3. 10.3.3. Research & Development Activities
  11. Chapter 11 Company Profiles
    1. 11.1. Medtronic
      1. 11.1.1. Company Overview
      2. 11.1.2. Product/Service Portfolio
      3. 11.1.3. Medtronic Sales, Revenue, and Gross Margin
      4. 11.1.4. Medtronic Revenue and Growth Rate
      5. 11.1.5. Medtronic Market Share
      6. 11.1.6. Recent Initiatives, Funding/VC Activities, and Technological Innovations
    2. 11.2. McKESSON
      1. 11.2.1. Company Overview
      2. 11.2.2. Product/Service Portfolio
      3. 11.2.3. McKESSON Sales, Revenue, and Gross Margin
      4. 11.2.4. McKESSON Revenue and Growth Rate
      5. 11.2.5. McKESSON Market Share
      6. 11.2.6. Recent Initiatives, Funding/VC Activities, and Technological Innovations
    3. 11.3. Molnlycke
      1. 11.3.1. Company Overview
      2. 11.3.2. Product/Service Portfolio
      3. 11.3.3. Molnlycke Sales, Revenue, and Gross Margin
      4. 11.3.4. Molnlycke Revenue and Growth Rate
      5. 11.3.5. Molnlycke Market Share
      6. 11.3.6. Recent Initiatives, Funding/VC Activities, and Technological Innovations
    4. 11.4. Zhende Medical
      1. 11.4.1. Company Overview
      2. 11.4.2. Product/Service Portfolio
      3. 11.4.3. Zhende Medical Sales, Revenue, and Gross Margin
      4. 11.4.4. Zhende Medical Revenue and Growth Rate
      5. 11.4.5. Zhende Medical Market Share
      6. 11.4.6. Recent Initiatives, Funding/VC Activities, and Technological Innovations
    5. 11.5. BSN Medical
      1. 11.5.1. Company Overview
      2. 11.5.2. Product/Service Portfolio
      3. 11.5.3. BSN Medical Sales, Revenue, and Gross Margin
      4. 11.5.4. BSN Medical Revenue and Growth Rate
      5. 11.5.5. BSN Medical Market Share
      6. 11.5.6. Recent Initiatives, Funding/VC Activities, and Technological Innovations
    6. 11.6. Winner Medical
      1. 11.6.1. Company Overview
      2. 11.6.2. Product/Service Portfolio
      3. 11.6.3. Winner Medical Sales, Revenue, and Gross Margin
      4. 11.6.4. Winner Medical Revenue and Growth Rate
      5. 11.6.5. Winner Medical Market Share
      6. 11.6.6. Recent Initiatives, Funding/VC Activities, and Technological Innovations
    7. 11.7. Dukal
      1. 11.7.1. Company Overview
      2. 11.7.2. Product/Service Portfolio
      3. 11.7.3. Dukal Sales, Revenue, and Gross Margin
      4. 11.7.4. Dukal Revenue and Growth Rate
      5. 11.7.5. Dukal Market Share
      6. 11.7.6. Recent Initiatives, Funding/VC Activities, and Technological Innovations
    8. 11.8. Medline
      1. 11.8.1. Company Overview
      2. 11.8.2. Product/Service Portfolio
      3. 11.8.3. Medline Sales, Revenue, and Gross Margin
      4. 11.8.4. Medline Revenue and Growth Rate
      5. 11.8.5. Medline Market Share
      6. 11.8.6. Recent Initiatives, Funding/VC Activities, and Technological Innovations
    9. 11.9. JianErKang
      1. 11.9.1. Company Overview
      2. 11.9.2. Product/Service Portfolio
      3. 11.9.3. JianErKang Sales, Revenue, and Gross Margin
      4. 11.9.4. JianErKang Revenue and Growth Rate
      5. 11.9.5. JianErKang Market Share
      6. 11.9.6. Recent Initiatives, Funding/VC Activities, and Technological Innovations
    10. 11.10. Cardinal Health
      1. 11.10.1. Company Overview
      2. 11.10.2. Product/Service Portfolio
      3. 11.10.3. Cardinal Health Sales, Revenue, and Gross Margin
      4. 11.10.4. Cardinal Health Revenue and Growth Rate
      5. 11.10.5. Cardinal Health Market Share
      6. 11.10.6. Recent Initiatives, Funding/VC Activities, and Technological Innovations
    11. 11.11. Hakuzo
      1. 11.11.1. Company Overview
      2. 11.11.2. Product/Service Portfolio
      3. 11.11.3. Hakuzo Sales, Revenue, and Gross Margin
      4. 11.11.4. Hakuzo Revenue and Growth Rate
      5. 11.11.5. Hakuzo Market Share
      6. 11.11.6. Recent Initiatives, Funding/VC Activities, and Technological Innovations
    12. 11.12. Hartmann
      1. 11.12.1. Company Overview
      2. 11.12.2. Product/Service Portfolio
      3. 11.12.3. Hartmann Sales, Revenue, and Gross Margin
      4. 11.12.4. Hartmann Revenue and Growth Rate
      5. 11.12.5. Hartmann Market Share
      6. 11.12.6. Recent Initiatives, Funding/VC Activities, and Technological Innovations
    13. 11.13. Texpol
      1. 11.13.1. Company Overview
      2. 11.13.2. Product/Service Portfolio
      3. 11.13.3. Texpol Sales, Revenue, and Gross Margin
      4. 11.13.4. Texpol Revenue and Growth Rate
      5. 11.13.5. Texpol Market Share
      6. 11.13.6. Recent Initiatives, Funding/VC Activities, and Technological Innovations
    14. 11.14. Deroyal
      1. 11.14.1. Company Overview
      2. 11.14.2. Product/Service Portfolio
      3. 11.14.3. Deroyal Sales, Revenue, and Gross Margin
      4. 11.14.4. Deroyal Revenue and Growth Rate
      5. 11.14.5. Deroyal Market Share
      6. 11.14.6. Recent Initiatives, Funding/VC Activities, and Technological Innovations
    15. 11.15. Lohmann & Rauscher
      1. 11.15.1. Company Overview
      2. 11.15.2. Product/Service Portfolio
      3. 11.15.3. Lohmann & Rauscher Sales, Revenue, and Gross Margin
      4. 11.15.4. Lohmann & Rauscher Revenue and Growth Rate
      5. 11.15.5. Lohmann & Rauscher Market Share
      6. 11.15.6. Recent Initiatives, Funding/VC Activities, and Technological Innovations
    16. 11.16. Allmed Medical
      1. 11.16.1. Company Overview
      2. 11.16.2. Product/Service Portfolio
      3. 11.16.3. Allmed Medical Sales, Revenue, and Gross Margin
      4. 11.16.4. Allmed Medical Revenue and Growth Rate
      5. 11.16.5. Allmed Medical Market Share
      6. 11.16.6. Recent Initiatives, Funding/VC Activities, and Technological Innovations
    17. 11.17. Ahlstrom
      1. 11.17.1. Company Overview
      2. 11.17.2. Product/Service Portfolio
      3. 11.17.3. Ahlstrom Sales, Revenue, and Gross Margin
      4. 11.17.4. Ahlstrom Revenue and Growth Rate
      5. 11.17.5. Ahlstrom Market Share
      6. 11.17.6. Recent Initiatives, Funding/VC Activities, and Technological Innovations
    18. 11.18. ASC
      1. 11.18.1. Company Overview
      2. 11.18.2. Product/Service Portfolio
      3. 11.18.3. ASC Sales, Revenue, and Gross Margin
      4. 11.18.4. ASC Revenue and Growth Rate
      5. 11.18.5. ASC Market Share
      6. 11.18.6. Recent Initiatives, Funding/VC Activities, and Technological Innovations
    19. 11.19. Medicom
      1. 11.19.1. Company Overview
      2. 11.19.2. Product/Service Portfolio
      3. 11.19.3. Medicom Sales, Revenue, and Gross Margin
      4. 11.19.4. Medicom Revenue and Growth Rate
      5. 11.19.5. Medicom Market Share
      6. 11.19.6. Recent Initiatives, Funding/VC Activities, and Technological Innovations
    20. 11.20. Owens & Minor
      1. 11.20.1. Company Overview
      2. 11.20.2. Product/Service Portfolio
      3. 11.20.3. Owens & Minor Sales, Revenue, and Gross Margin
      4. 11.20.4. Owens & Minor Revenue and Growth Rate
      5. 11.20.5. Owens & Minor Market Share
      6. 11.20.6. Recent Initiatives, Funding/VC Activities, and Technological Innovations
    21. 11.21. Crosstex
      1. 11.21.1. Company Overview
      2. 11.21.2. Product/Service Portfolio
      3. 11.21.3. Crosstex Sales, Revenue, and Gross Margin
      4. 11.21.4. Crosstex Revenue and Growth Rate
      5. 11.21.5. Crosstex Market Share
      6. 11.21.6. Recent Initiatives, Funding/VC Activities, and Technological Innovations
      7. 11.22. B. Braun
      8. 11.22.1. Company Overview
      9. 11.22.2. Product/Service Portfolio
        1. 11.22.3. B. Braun Sales, Revenue, and Gross Margin
        2. 11.22.4. B. Braun Revenue and Growth Rate
        3. 11.22.5. B. Braun Market Share
      10. 11.22.6. Recent Initiatives, Funding/VC Activities, and Technological Innovations
    22. 11.23. Kettenbach
      1. 11.23.1. Company Overview
      2. 11.23.2. Product/Service Portfolio
      3. 11.23.3. Kettenbach Sales, Revenue, and Gross Margin
      4. 11.23.4. Kettenbach Revenue and Growth Rate
      5. 11.23.5. Kettenbach Market Share
      6. 11.23.6. Recent Initiatives, Funding/VC Activities, and Technological Innovations
    23. 11.24. Others
      1. 11.24.1. Company Overview
      2. 11.24.2. Product/Service Portfolio
      3. 11.24.3. Others Sales, Revenue, and Gross Margin
      4. 11.24.4. Others Revenue and Growth Rate
      5. 11.24.5. Others Market Share
      6. 11.24.6. Recent Initiatives, Funding/VC Activities, and Technological Innovations
  12. Chapter 12 Surgical Sponge — Industry Analysis
    1. 12.1. Introduction and Taxonomy
    2. 12.2. Surgical Sponge Market – Key Trends
      1. 12.2.1. Market Drivers
      2. 12.2.2. Market Restraints
      3. 12.2.3. Market Opportunities
    3. 12.3. Value Chain Analysis
    4. 12.4. Key Mandates and Regulations
    5. 12.5. Technology Roadmap and Timeline
    6. 12.6. Surgical Sponge Market – Attractiveness Analysis
      1. 12.6.1. By Type
      2. 12.6.2. By Material Type
      3. 12.6.3. By Shape Type
      4. 12.6.4. By Sterility Type
      5. 12.6.5. By Sales Channel
      6. 12.6.6. By Application
      7. 12.6.7. By End-User
      8. 12.6.8. By Region
  13. Chapter 13 Industrial Chain, Sourcing Strategy, and Downstream Buyers
    1. 13.1. Surgical Sponge Industrial Chain Analysis
    2. 13.2. Downstream Buyers
    3. 13.3. Distributors/Traders List
  14. Chapter 14 Marketing Strategy Analysis
    1. 14.1. Marketing Channel
    2. 14.2. Direct Marketing
    3. 14.3. Indirect Marketing
    4. 14.4. Marketing Channel Development Trends
    5. 14.5. Economic/Political Environmental Change
  15. Chapter 15 Report Conclusion & Key Insights
    1. 15.1. Key Insights from Primary Interviews & Surveys Respondents
    2. 15.2. Key Takeaways from Analysts, Consultants, and Industry Leaders
  16. Chapter 16 Research Approach & Methodology
    1. 16.1. Report Description
    2. 16.2. Research Scope
    3. 16.3. Research Methodology
      1. 16.3.1. Secondary Research
      2. 16.3.2. Primary Research
      3. 16.3.3. Statistical Models
        1. 16.3.3.1. Company Share Analysis Model
        2. 16.3.3.2. Revenue Based Modeling
      4. 16.3.4. Research Limitations

      List of Figures

      Fig.1	Product Picture of Surgical Sponge
      Fig.2	Global Surgical Sponge Market, 2016 – 2026 (USD Million)
      Fig.3	Global Surgical Sponge Market Absolute Revenue Opportunity, 2016 – 2026 (USD Million)
      Fig.4	Global Surgical Sponge Market Incremental Revenue Opportunity, 2020 – 2026 (USD Million)
      Fig.5	Global Surgical Sponge Market Share, by Type, 2019 & 2026 (USD Million)
      Fig.6	Global X-Ray Detectable Sponges Surgical Sponge Market, 2016 – 2026 (USD Million)
      Fig.7	Global Cotton Gauze Sponges Surgical Sponge Market, 2016 – 2026 (USD Million)
      Fig.8	Global Laparotomy Sponges Surgical Sponge Market, 2016 – 2026 (USD Million)
      Fig.9	Global Nonwoven Sponges Surgical Sponge Market, 2016 – 2026 (USD Million)
      Fig.10	Global Others Surgical Sponge Market, 2016 – 2026 (USD Million)
      Fig.11	Global Surgical Sponge Market Share, by Material Type, 2019 & 2026 (USD Million)
      Fig.12	Global Cotton Surgical Sponge Market, 2016 – 2026 (USD Million)
      Fig.13	Global Cellulose Surgical Sponge Market, 2016 – 2026 (USD Million)
      Fig.14	Global PVA Surgical Sponge Market, 2016 – 2026 (USD Million)
      Fig.15	Global Polyurethane Surgical Sponge Market, 2016 – 2026 (USD Million)
      Fig.16	Global Rayon Surgical Sponge Market, 2016 – 2026 (USD Million)
      Fig.17	Global Others Surgical Sponge Market, 2016 – 2026 (USD Million)
      Fig.18	Global Surgical Sponge Market Share, by Shape Type, 2019 & 2026 (USD Million)
      Fig.19	Global Round Surgical Sponge Market, 2016 – 2026 (USD Million)
      Fig.20	Global Cylindrical Surgical Sponge Market, 2016 – 2026 (USD Million)
      Fig.21	Global Square Surgical Sponge Market, 2016 – 2026 (USD Million)
      Fig.22	Global Rectangle Surgical Sponge Market, 2016 – 2026 (USD Million)
      Fig.23	Global Others Surgical Sponge Market, 2016 – 2026 (USD Million)
      Fig.24	Global Surgical Sponge Market Share, by Sterility Type, 2019 & 2026 (USD Million)
      Fig.25	Global Sterile Surgical Sponge Surgical Sponge Market, 2016 – 2026 (USD Million)
      Fig.26	Global Non-Sterile Surgical Sponge Surgical Sponge Market, 2016 – 2026 (USD Million)
      Fig.27	Global Surgical Sponge Market Share, by Sales Channel, 2019 & 2026 (USD Million)
      Fig.28	Global Online Surgical Sponge Market, 2016 – 2026 (USD Million)
      Fig.29	Global Offline Surgical Sponge Market, 2016 – 2026 (USD Million)
      Fig.30	Global Surgical Sponge Market Share, by Application, 2019 & 2026 (USD Million)
      Fig.31	Global General Surgery Surgical Sponge Market, 2016 – 2026 (USD Million)
      Fig.32	Global Neurosurgery Surgical Sponge Market, 2016 – 2026 (USD Million)
      Fig.33	Global Laparotomy Surgical Sponge Market, 2016 – 2026 (USD Million)
      Fig.34	Global Dental Surgery Surgical Sponge Market, 2016 – 2026 (USD Million)
      Fig.35	Global ENT Surgery Surgical Sponge Market, 2016 – 2026 (USD Million)
      Fig.36	Global Others Surgical Sponge Market, 2016 – 2026 (USD Million)
      Fig.37	Global Surgical Sponge Market Share, by End-User, 2019 & 2026 (USD Million)
      Fig.38	Global Pharmacy Surgical Sponge Market, 2016 – 2026 (USD Million)
      Fig.39	Global Hospital Surgical Sponge Market, 2016 – 2026 (USD Million)
      Fig.40	Global Ambulatory Surgery Center Surgical Sponge Market, 2016 – 2026 (USD Million)
      Fig.41	Global Clinic Surgical Sponge Market, 2016 – 2026 (USD Million)
      Fig.42	Global Others Surgical Sponge Market, 2016 – 2026 (USD Million)
      Fig.43	Global Surgical Sponge Market Share, by Region, 2019 & 2026 (USD Million)
      Fig.44	North America Surgical Sponge Market, 2016 – 2026 (USD Million)
      Fig.45	U.S. Surgical Sponge Market, 2016 – 2026 (USD Million)
      Fig.46	Canada Surgical Sponge Market, 2016 – 2026 (USD Million)
      Fig.47	Europe Surgical Sponge Market, 2016 – 2026 (USD Million)
      Fig.48	Germany Surgical Sponge Market, 2016 – 2026 (USD Million)
      Fig.49	France Surgical Sponge Market, 2016 – 2026 (USD Million)
      Fig.50	U.K. Surgical Sponge Market, 2016 – 2026 (USD Million)
      Fig.51	Italy Surgical Sponge Market, 2016 – 2026 (USD Million)
      Fig.52	Spain Surgical Sponge Market, 2016 – 2026 (USD Million)
      Fig.53	Rest of Europe Surgical Sponge Market, 2016 – 2026 (USD Million)
      Fig.54	Asia Pacific Surgical Sponge Market, 2016 – 2026 (USD Million)
      Fig.55	China Surgical Sponge Market, 2016 – 2026 (USD Million)
      Fig.56	Japan Surgical Sponge Market, 2016 – 2026 (USD Million)
      Fig.57	India Surgical Sponge Market, 2016 – 2026 (USD Million)
      Fig.58	South  Korea Surgical Sponge Market, 2016 – 2026 (USD Million)
      Fig.59	South-East Asia Surgical Sponge Market, 2016 – 2026 (USD Million)
      Fig.60	Rest of Asia Pacific Surgical Sponge Market, 2016 – 2026 (USD Million)
      Fig.61	Latin America Surgical Sponge Market, 2016 – 2026 (USD Million)
      Fig.62	Brazil Surgical Sponge Market, 2016 – 2026 (USD Million)
      Fig.63	Mexico Surgical Sponge Market, 2016 – 2026 (USD Million)
      Fig.64	Rest of Latin America Surgical Sponge Market, 2016 – 2026 (USD Million)
      Fig.65	The Middle-East and Africa Surgical Sponge Market, 2016 – 2026 (USD Million)
      Fig.66	GCC Countries Surgical Sponge Market, 2016 – 2026 (USD Million)
      Fig.67	South Africa Surgical Sponge Market, 2016 – 2026 (USD Million)
      Fig.68	Rest of Middle-East Africa Surgical Sponge Market, 2016 – 2026 (USD Million)
      Fig.69	Competitor Market Share – Revenue
      Fig.70	Medtronic Revenue and Growth Rate
      Fig.71	Medtronic Market Share
      Fig.72	McKESSON Revenue and Growth Rate
      Fig.73	McKESSON Market Share
      Fig.74	Molnlycke Revenue and Growth Rate
      Fig.75	Molnlycke Market Share
      Fig.76	Zhende Medical Revenue and Growth Rate
      Fig.77	Zhende Medical Market Share
      Fig.78	BSN Medical Revenue and Growth Rate
      Fig.79	BSN Medical Market Share
      Fig.80	Winner Medical Revenue and Growth Rate
      Fig.81	Winner Medical Market Share
      Fig.82	Dukal Revenue and Growth Rate
      Fig.83	Dukal Market Share
      Fig.84	Medline Revenue and Growth Rate
      Fig.85	Medline Market Share
      Fig.86	JianErKang Revenue and Growth Rate
      Fig.87	JianErKang Market Share
      Fig.88	Cardinal Health Revenue and Growth Rate
      Fig.89	Cardinal Health Market Share
      Fig.90	Hakuzo Revenue and Growth Rate
      Fig.91	Hakuzo Market Share
      Fig.92	Hartmann Revenue and Growth Rate
      Fig.93	Hartmann Market Share
      Fig.94	Texpol Revenue and Growth Rate
      Fig.95	Texpol Market Share
      Fig.96	Deroyal Revenue and Growth Rate
      Fig.97	Deroyal Market Share
      Fig.98	Lohmann & Rauscher Revenue and Growth Rate
      Fig.99	Lohmann & Rauscher Market Share
      Fig.100	Allmed Medical Revenue and Growth Rate
      Fig.101	Allmed Medical Market Share
      Fig.102	Ahlstrom Revenue and Growth Rate
      Fig.103	Ahlstrom Market Share
      Fig.104	ASC Revenue and Growth Rate
      Fig.105	ASC Market Share
      Fig.106	Medicom Revenue and Growth Rate
      Fig.107	Medicom Market Share
      Fig.108	Owens & Minor Revenue and Growth Rate
      Fig.109	Owens & Minor Market Share
      Fig.110	Crosstex Revenue and Growth Rate
      Fig.111	Crosstex Market Share
      Fig.112	B. Braun Revenue and Growth Rate
      Fig.113	B. Braun Market Share
      Fig.114	Kettenbach Revenue and Growth Rate
      Fig.115	Kettenbach Market Share
      Fig.116	Others Revenue and Growth Rate
      Fig.117	Others Market Share
      Fig.118	Market Dynamics
      Fig.119	Global Surgical Sponge – Value Chain Analysis
      Fig.120	Key Mandates and Regulations
      Fig.121	Technology Roadmap and Timeline
      Fig.122	Market Attractiveness Analysis – By Type
      Fig.123	Market Attractiveness Analysis – By Material Type
      Fig.124	Market Attractiveness Analysis – By Shape Type
      Fig.125	Market Attractiveness Analysis – By Sterility Type
      Fig.126	Market Attractiveness Analysis – By Sales Channel
      Fig.127	Market Attractiveness Analysis – By Application
      Fig.128	Market Attractiveness Analysis – By End-User
      Fig.129	Market Attractiveness Analysis – By Region
      Fig.130	Surgical Sponge Industrial Chain Analysis
      Fig.131	Market Channels
      Fig.132	Marketing Channel Development Trend
      Fig.133	Growth in World Gross Product, 2008-2018
      

      List of Tables

      Table 1	Global Surgical Sponge Market, 2019 & 2026 (USD Million)
      Table 2	Global Surgical Sponge Market, by Type, 2016 – 2026 (USD Million)
      Table 3	Global Surgical Sponge Market, by Material Type, 2016 – 2026 (USD Million)
      Table 4	Global Surgical Sponge Market, by Shape Type, 2016 – 2026 (USD Million)
      Table 5	Global Surgical Sponge Market, by Sterility Type, 2016 – 2026 (USD Million)
      Table 6	Global Surgical Sponge Market, by Sales Channel, 2016 – 2026 (USD Million)
      Table 7	Global Surgical Sponge Market, by Application, 2016 – 2026 (USD Million)
      Table 8 Global Surgical Sponge Market, by End-User, 2016 – 2026 (USD Million)
      Table 9 Global Surgical Sponge Market, by Region, 2016 – 2026 (USD Million)
      Table 10 North America Surgical Sponge Market, by Country, 2016 – 2026 (USD Million)
      Table 11 North America Surgical Sponge Market, by Type, 2016 – 2026 (USD Million)
      Table 12 North America Surgical Sponge Market, by Material Type, 2016 – 2026 (USD Million)
      Table 13 North America Surgical Sponge Market, by Shape Type, 2016 – 2026 (USD Million)
      Table 14 North America Surgical Sponge Market, by Sterility Type, 2016 – 2026 (USD Million)
      Table 15 North America Surgical Sponge Market, by Sales Channel, 2016 – 2026 (USD Million)
      Table 16 North America Surgical Sponge Market, by Application, 2016 – 2026 (USD Million)
      Table 17 North America Surgical Sponge Market, by End-User, 2016 – 2026 (USD Million)
      Table 18 Europe Surgical Sponge Market, by Country, 2016 – 2026 (USD Million)
      Table 19 Europe Surgical Sponge Market, by Type, 2016 – 2026 (USD Million)
      Table 20 Europe Surgical Sponge Market, by Material Type, 2016 – 2026 (USD Million)
      Table 21 Europe Surgical Sponge Market, by Shape Type, 2016 – 2026 (USD Million)
      Table 22 Europe Surgical Sponge Market, by Sterility Type, 2016 – 2026 (USD Million)
      Table 23 Europe Surgical Sponge Market, by Sales Channel, 2016 – 2026 (USD Million)
      Table 24 Europe Surgical Sponge Market, by Application, 2016 – 2026 (USD Million)
      Table 25 Europe Surgical Sponge Market, by End-User, 2016 – 2026 (USD Million)
      Table 26 Asia Pacific Surgical Sponge Market, by Country, 2016 – 2026 (USD Million)
      Table 27 Asia Pacific Surgical Sponge Market, by Type, 2016 – 2026 (USD Million)
      Table 28 Asia Pacific Surgical Sponge Market, by Material Type, 2016 – 2026 (USD Million)
      Table 29 Asia Pacific Surgical Sponge Market, by Shape Type, 2016 – 2026 (USD Million)
      Table 30 Asia Pacific Surgical Sponge Market, by Sterility Type, 2016 – 2026 (USD Million)
      Table 31 Asia Pacific Surgical Sponge Market, by Sales Channel, 2016 – 2026 (USD Million)
      Table 32 Asia Pacific Surgical Sponge Market, by Application, 2016 – 2026 (USD Million)
      Table 33 Asia Pacific Surgical Sponge Market, by End-User, 2016 – 2026 (USD Million)
      Table 34 Latin America Surgical Sponge Market, by Country, 2016 – 2026 (USD Million)
      Table 35 Latin America Surgical Sponge Market, by Type, 2016 – 2026 (USD Million)
      Table 36 Latin America Surgical Sponge Market, by Material Type, 2016 – 2026 (USD Million)
      Table 37 Latin America Surgical Sponge Market, by Shape Type, 2016 – 2026 (USD Million)
      Table 38 Latin America Surgical Sponge Market, by Sterility Type, 2016 – 2026 (USD Million)
      Table 39 Latin America Surgical Sponge Market, by Sales Channel, 2016 – 2026 (USD Million)
      Table 40 Latin America Surgical Sponge Market, by Application, 2016 – 2026 (USD Million)
      Table 41 Latin America Surgical Sponge Market, by End-User, 2016 – 2026 (USD Million)
      Table 42 The Middle-East and Africa Surgical Sponge Market, by Country, 2016 – 2026 (USD Million)
      Table 43 The Middle-East and Africa Surgical Sponge Market, by Type, 2016 – 2026 (USD Million)
      Table 44 The Middle-East and Africa Surgical Sponge Market, by Material Type, 2016 – 2026 (USD Million)
      Table 45 The Middle-East and Africa Surgical Sponge Market, by Shape Type, 2016 – 2026 (USD Million)
      Table 46 The Middle-East and Africa Surgical Sponge Market, by Sterility Type, 2016 – 2026 (USD Million)
      Table 47 The Middle-East and Africa Surgical Sponge Market, by Sales Channel, 2016 – 2026 (USD Million)
      Table 48 The Middle-East and Africa Surgical Sponge Market, by Application, 2016 – 2026 (USD Million)
      Table 49 The Middle-East and Africa Surgical Sponge Market, by End-User, 2016 – 2026 (USD Million)
      Table 50 Global Surgical Sponge Market - Company Revenue Analysis, 2016 – 2019 (USD Million)
      Table 51 Global Surgical Sponge Market - Company Revenue Share Analysis, 2016 – 2019 (%)
      Table 52 Acquisitions and Mergers
      Table 53 Market Drivers – Impact Analysis
      Table 54 Market Restraints
      Table 55 Market Opportunities
      Table 56 Major Buyers of Surgical Sponge
      Table 57 Distributors/Traders of Surgical Sponge by Region
      

Industry Major Market Players

  • Medtronic
  • McKesson
  • Molnlycke
  • Zhende Medical
  • BSN Medical
  • Winner Medical
  • Dukal, Medline
  • JianErKang
  • Cardinal Health
  • Hakuzo
  • Hartmann
  • Texpol,
  • Deroyal
  • Lohmann & Rauscher
  • Allmed Medical
  • Ahlstrom
  • ASC
  • Medicom
  • Owens & Minor
  • Crosstex
  • B. Braun
  • Kettenbach