![]()
Search Market Research Report
Adhesion Promoter Market Size, Share Global Analysis Report, 2024 – 2032

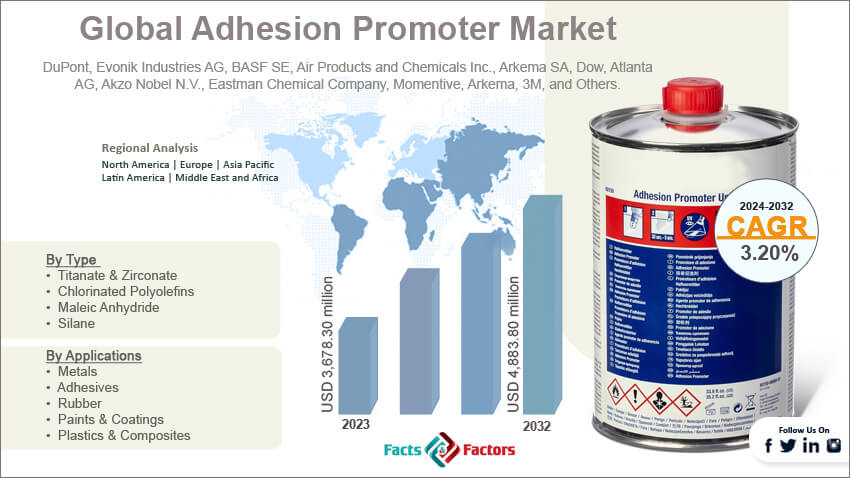
Adhesion Promoter Market Size, Share, Growth Analysis Report By Type (Titanate & Zirconate, Chlorinated Polyolefins, Maleic Anhydride, Silane, And Others), By Applications (Metals, Adhesives, Rubber, Paints & Coatings, Plastics & Composites, And Others), By End-Users (Electronics, Packaging, Automotive & Transportation, Building & Construction, And Others), And By Region - Global and Regional Industry Insights, Overview, Comprehensive Analysis, Trends, Statistical Research, Market Intelligence, Historical Data and Forecast 2024 – 2032
Industry Insights
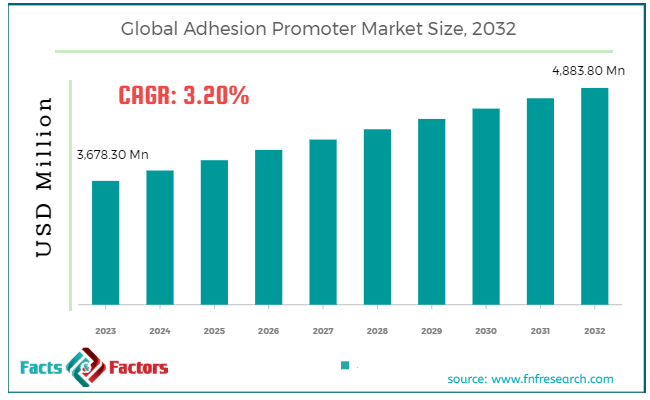
[218+ Pages Report] According to Facts and Factors, the global adhesion promoter market size was valued at USD 3,678.30 million in 2023 and is predicted to surpass USD 4,883.80 million by the end of 2032. The adhesion promoter industry is expected to grow by a CAGR of 3.20% between 2024 and 2032.
 Market Overview
An adhesion promoter is a chemical substance that improves the adhesion between two materials. These promoters are highly used in various end-user sectors like aerospace, packaging, manufacturing, construction, automotive, electronics and many others. The basic function of these materials is to enhance the bonding and strength between the surface and substrates. There are different kinds of adhesion promoters available in the market, like silane, chlorinated polyolefins, maleic anhydride, phosphates, and others.
These additives are important to overcome the challenges due to poor adhesion, substrate incompatibility, and extreme weather conditions. However, these adhesions also help companies to easily align with the regulatory standards issued by the governments.
Key Insights
- As per the analysis shared by our research analyst, the global adhesion promoter market size is estimated to grow annually at a CAGR of around 3.20% over the forecast period (2024-2032).
- In terms of revenue, the global adhesion promoter market size was valued at around USD 3,678.30 million in 2023 and is projected to reach USD 4,883.80 million by 2032.
- Growing demand from end-user sectors is driving the growth of the global adhesion promoter market.
- Based on the type, the silane segment is growing at a high rate and is projected to dominate the global market.
- Based on the applications, the paints & coatings segment is projected to swipe the largest market share.
- Based on the end-users, the automotive & transportation segment is expected to dominate the global market.
- Based on region, North America is expected to dominate the global market during the forecast period.
Growth Drivers
- Growing demand from end-user sectors is driving the growth of the global market.
End use sectors like aerospace, packaging, electronics, manufacturing and automotive are posing a high demand for adhesion promoters. Companies are relying on these promoters to strengthen the bonding and durability of coatings on the material. Technological advancements are another major reason positively impacting the growth trajectory of the global adhesion promoter market The development of advanced adhesion promoter formulations to improve compatibility with different substrates is likely to offer innovative solutions in the marketplace to meet industry demand.
Additionally, the emerging economies in regions like Latin America and the Asia Pacific are expected to see fast expansion of end-user sectors and are further expected to offer lucrative opportunities for the industry players. For instance, TOYO INK SC HOLDINGS CO. LTD came up with its latest product portfolio of laminating adhesives by complimenting food-safe products in June 2022.
Restraints
- Rising alternative technologies are likely to hamper the growth of the global market.
The emergence of automotive technologies like primer as surface treatment, plasma treatments, and self-adhesive materials is expected to slow down the growth trajectory of the adhesion promoter industry in the coming years. These technologies offer superior performances and, therefore, eliminate the requirement for adhesion promoters in many industries. Competitive pressure is another major reason likely to restrict the growth of the industry.
Manufacturers are offering a wide range of formulations and products thereby intensifying the competition in the market. This competition leads to pricing issues and reduced profit margins, which in turn is also expected to hinder the growth of the industry.
Opportunities
- Rising demand for lightweight and advanced materials is expected to foster growth opportunities in the global market.
The aerospace and automotive industries are demanding lightweight and advanced materials to improve their fuel efficiency and overall performance. Light materials like composites, aluminum, and plastics require adhesion promoters to bond the advanced materials to traditional substrates. These materials also help companies comply with regulatory standards and address environmental concerns. Regulations like VOC emissions and the Environmental Protection Act are further driving demand for eco-friendly addition promoters.
Therefore, all these factors are expected to foster growth opportunities in the global adhesion promoter market in the coming years. For instance, PPG Industries Inc. partnered with Rex Airlines in August 2021 by offering a range of aerospace paints to improve the craft’s domestic operations. The product can be used on engine cowlings, wings, fuselage, and others.
Challenges
- Complexity of application is a major challenge in the global market.
Adhesion promoters pose a huge requirement for professionals and skilled staff. The application of these adhesion promoters is adding complexity to the manufacturing processes, which is a big challenge in the adhesion promoter industry. Inadequate surface preparation, improper application, and many others lead to suboptimal adhesion performance, thereby reducing the interest of end users in the product. However, this incompatibility is also leading to potential product failure which is also a challenge in the industry.
Segmentation Analysis
The global adhesion promoter market can be segmented into type, applications, end-users, and region.
By Type Insights
On the basis of type, the market can be segmented into titanate & zirconate, chlorinated polyolefins, maleic anhydride, silane, and others. The silane segment accounts for the largest share of the adhesion promoter industry. Silane-based adhesion promoters are versatile in nature and, therefore, can easily combine with substrates like plastic, ceramics, glass, metal, and composites. These are used heavily in different end-user sectors like electronics, automotive, construction, and packaging. Silane also works as a coupling agent, thereby encouraging adhesions between these similar materials. These materials increase the spreading and wetting of coatings, therefore leading to more strong bonds.
Additionally, these additional promoters are moisture resistant. It means they can bind easily with other materials in the presence of moisture. It makes it ideal for applications that are highly exposed to humidity and moisture. Silane is very compatible with a range of adhesive substrates and coating systems, which further makes it popular among users.
Furthermore, these offer excellent chemical stability, thereby offering long-term performance and durability when exposed to heat or harsh chemicals. These materials are also environmentally friendly which means they help companies easily comply with the regulatory standards. All these factors are likely to accentuate the growth of the segment in the forthcoming years.
By Applications Insights
On the basis of applications, the market can be segmented into metals, adhesives, rubber, paints & coatings, plastics & composites, and others. The paints & coatings segment is likely to dominate the global adhesion promoter market during the forecast period. Paints and coatings are used in various industries like industrial equipment, marine, aerospace, construction, and automotive.
These adhesions help in forming strong bonds between the coating surface and substrate surface, thereby enhancing the overall performance. These adhesions are important additives in the paint and coating formulations for establishing compatibility and long-term performance of the coating system. These adhesives are widely adopted in paints and coatings where the surface is subjected to extreme environmental conditions and chemical exposures. Also, these additions prevent blistering, delamination, and coating failures by offering a durable bond with the substrate.
By End-Users Insights
On the basis of end-users, the market can be segmented into electronics, packaging, automotive & transportation, building & construction, and others. The automotive & transportation sector is anticipated to witness significant developments in the coming years in the adhesion promoter industry. Companies are emphasizing the need to lower vehicle weight to meet government regulations, which increases the demand for the adoption of lightweight materials like plastics.
Therefore, promoters play an important role in ensuring the bond between the lightweight material and substrate like steel. The automobile sector depends heavily on these adhesives for noise reduction, corrosion, resistance surface protection, and structural bonding. These helps improve the adhesion’s durability and performance of the vehicles. The ongoing shift towards autonomous and electric vehicles is further boosting the scope of the segment by posing huge requirements for these materials in the automotive sector.
Report Scope
Report Attribute |
Details |
Market Size in 2023 |
USD 3,678.30 Million |
Projected Market Size in 2032 |
USD 4,883.80 Million |
CAGR Growth Rate |
3.20% CAGR |
Base Year |
2023 |
Forecast Years |
2024-2032 |
Key Market Players |
DuPont, Evonik Industries AG, BASF SE, Air Products and Chemicals Inc., Arkema SA, Dow, Atlanta AG, Akzo Nobel N.V., Eastman Chemical Company, Momentive, Arkema, 3M, and Others. |
Key Segment |
By Type, By Applications, By End-Users, and By Region |
Major Regions Covered |
North America, Europe, Asia Pacific, Latin America, and the Middle East &, Africa |
Purchase Options |
Request customized purchase options to meet your research needs. Explore purchase options |
Regional Analysis
- North America to dominate the global market
North America accounts for the largest share of the global adhesion promoter market. The region is driven by the fast-growing manufacturing sector, particularly in the electronics, automotive, and construction industries. The region is likely to see high demand for these adhesion promoters because of the growing need for high-performance materials in different applications. The transportation and automotive sectors are promoting the use of adhesion in vehicle assembly and aftermarket applications because of its ability to improve bonding. The research and development activities in the region are further likely to promote the adhesion formulations. Companies are investing heavily to come up with eco-friendly and high performing alternatives.
Moreover, innovation in application methods, surface treatment technologies, and material science are further expected to contribute towards the growth of the regional market. Also, the fast-changing regulatory standards like compliance, VOC emission limits, and many others are likely to positively impact the regional market in the coming years. The fast-growing construction sector in the region further drives the demand for promoters like silanes. These promoters also offer architectural coatings and structural bonding applications.
Asia Pacific is another major region expected to see significant development in the adhesion promoter industry in the forthcoming years. Growing industrialization is one of the major factors for the high demand for adhesion promoters in the region. Growing economies like China, South Korea, Japan, and India are witnessing fast growth in end-user industries like electronics, automotive, construction, and packaging. The region is the largest hub for automotive manufacturing, which further poses a huge demand for adhesion promoters because of the growing demand for vehicles.
Urbanization and rising disposable income of people are other major factors positively impacting the growth trajectory of the regional market. The largest manufacturers of electronic components, like Japan, China, Taiwan, and South Korea, are likely to contribute heavily towards the growth of the regional market in the coming years. Adhesion promoters are vital to improve the performance, reliability, and longevity of electronic components. For instance, PPG Industries Inc. came up with ADPRO MAX in April 2022. It is a pigmented adhesion promoter, especially for the markets of the US and Canada. It saves time by offering the results in one coat.
Competitive Analysis
The key players in the global adhesion promoter market include:
- DuPont
- Evonik Industries AG
- BASF SE
- Air Products and Chemicals Inc.
- Arkema SA
- Dow
- Atlanta AG
- Akzo Nobel N.V.
- Eastman Chemical Company
- Momentive
- Arkema
- 3M
For instance, Eastman Chemical Company came up with new-gen to assist users aligned with the regulatory requirements in July 2023. The Advantis adhesions avoid hazardous components by activating formulators to produce outcomes by improving a product’s sustainability.
The global adhesion promoter market is segmented as follows:
By Type Segment Analysis
- Titanate & Zirconate
- Chlorinated Polyolefins
- Maleic Anhydride
- Silane
- Others
By Applications Segment Analysis
- Metals
- Adhesives
- Rubber
- Paints & Coatings
- Plastics & Composites
- Others
By End-Users Segment Analysis
- Electronics
- Packaging
- Automotive & Transportation
- Building & Construction
- Others
By Regional Segment Analysis
- North America
- The U.S.
- Canada
- Mexico
- Europe
- France
- The UK
- Spain
- Germany
- Italy
- Rest of Europe
- Asia Pacific
- China
- Japan
- India
- Australia
- Southeast Asia
- Rest of Asia Pacific
- The Middle East & Africa
- Saudi Arabia
- UAE
- Egypt
- Kuwait
- South Africa
- Rest of the Middle East & Africa
- Latin America
- Brazil
- Argentina
- Rest of Latin America
Table of Content
Industry Major Market Players
- DuPont
- Evonik Industries AG
- BASF SE
- Air Products and Chemicals Inc.
- Arkema SA
- Dow
- Atlanta AG
- Akzo Nobel N.V.
- Eastman Chemical Company
- Momentive
- Arkema
- 3M


Copyright © 2025 - 2026, All Rights Reserved, Facts and Factors