Search Market Research Report

Discover Our Latest Reports
Discover Our Featured Reports
Discover Top Selling Reports

Packaged Food Market Size, Share Global Analysis Report, 2021 – 2026

report img

Packaged Food Market By Product Type (Bakery & Confectionery Products, Beverages, Breakfast Cereals, Dairy Products, Ice Creams & Frozen Novelties, Processed Meats, Ready-to-Eat Meals, Rice, Pasta, & Noodles, Sauces, Dressings, & Condiments, Snacks & Nutritional Bars, and Others), Distribution Channel (Hypermarkets and Supermarkets, Convenience Store, Online Retailers, and Others): The U.S. Industry Perspective, Comprehensive Analysis, and Forecast 2021 – 2026

Industry Insights

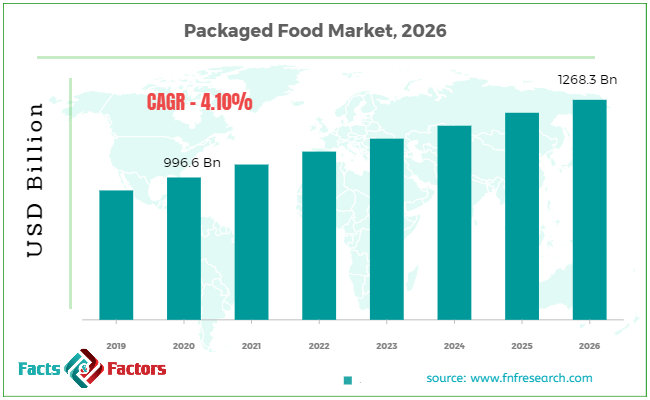
[197+ Pages Report] According to a research survey released by Facts and Factors Research, the demand for Packaged Food Market in the United States stood at USD 996.6 billion in the year 2020 and is projected to cross USD 1268.3 billion by the end of the year 2026, rising at a CAGR of nearly 4.10% between 2021 and 2026.

Packaged Food Market Size

To know more about this report | Request Free Sample Copy

logoU.S. Packaged Food Market: Overview        

Packaged food is any food for retail sale, which was produced and packaged into cartons or containers for marketing in advance. Raw ingredients and meals served in restaurants and cafés are not included in this list of food products. Packaged foods are simple to handle, prepare, and eat. They are gaining popularity in both developed and developing nations since they are extremely handy for urban residents.

Packaged Food Market

To know more about this report | Request Free Sample Copy

logoU.S. Packaged Food Market: Growth Factors

United States consumers' demanding work and personal schedules, as well as their growing preference for convenience, have driven the industry throughout the years. Furthermore, the growing use of e-commerce in the United States promotes goods sales across the country. Furthermore, rising innovations in food packaging, plant-based goods, robust tastes, and nutritious ingredients are projected to help the market's growth in the coming years in the United States. The expanding vegan population in the country has increased the demand for plant-based products, opening up new growth prospects for industry participants Organic, natural, clean, and whole-food items have seen a surge in popularity among health and environment-conscious U.S. customers who are less price-sensitive in recent years. The organic product sector is becoming a popular food category, thanks to the rising organic trend in the food and beverage business. Furthermore, U.S. consumers want more transparency in the source and supply chain of the items they buy. As a result, industry participants are becoming more open by giving extensive product information on labels.

logoU.S. Packaged Food Market: Segmentation

The U.S. Packaged Food market can be segregated based on product type, and distribution channel. Based on product type, the U.S. packaged food industry is categorized into bakery & confectionery products, beverages, breakfast cereals, dairy products, ice creams & frozen novelties, processed meats, ready-to-eat meals, rice, pasta, & noodles, sauces, dressings, & condiments, snacks & nutritional bars, and others. Based on distribution channels, the U.S. packaged food industry is categorized into hypermarkets and supermarkets, convenience stores, online retailers, and others.

logoU.S. Packaged Food Market: Regional Analysis

According to research, the United States packaged food and beverage supply in 2020 was ultra-processed and usually unhealthy, exposing people to items high in calories, saturated fat, sugar, and salt. The main drivers of U.S. regional market growth are rising disposable income, changing lifestyles, and expenditures in foody products. The market in the United States is very competitive, with a significant number of well-established firms spread around the country. Consumers have shown a preference for businesses that prioritize sustainable production and environmentally friendly packaging.

logoReport Scope

Report Attribute

Details

Market Size in 2020

USD 996.6 billion

Projected Market Size in 2026

USD 1268.3 billion

CAGR Growth Rate

4.10%

Base Year

2020

Forecast Years

2021-2026

Key Market Players

Cargill, Incorporated, Conagra Brands, Inc., General Mills Inc., Hormel Foods Corporation, JBS Foods S.A., Kellogg Co., Kraft Foods Group, Inc., Maple Leaf Foods, Inc., Mars, Incorporated, Nestlé S.A., PepsiCo, Smithfield Food, Inc., The Coca-Cola Company, The Kraft Heinz Company, and Tyson Foods, Inc., amongst others.

Key Segment

By Product Type, By Distribution Channel, By Region

Major Regions Covered

North America, Europe, Asia Pacific, Latin America, and the Middle East & Africa

Purchase Options

Request customized purchase options to meet your research needs. Explore purchase options

As a result, some businesses are concentrating on environmentally friendly packaging and a transparent supply chain. To capitalize on the potential, many industry players, including Danone S.A, Nestlé, and Unilever, have entered the plant-based field. Furthermore, pioneering vegan firms like Impossible Foods Inc. and Beyond Meat have propelled the industry's growth. According to the United States Department of Health and Human Services, about 30 million individuals in the United States will be lactose intolerant by 2020. As a result, plant-based dairy substitutes have gained popularity among the country's lactose-intolerant customers.

logoU.S. Packaged Food Market: Competitive Players

  • Cargill
  • Incorporated
  • Conagra Brands Inc.
  • General Mills Inc.
  • Hormel Foods Corporation
  • JBS Foods S.A.
  • Kellogg Co.
  • Kraft Foods Group Inc.
  • Maple Leaf Foods Inc.
  • Mars
  • Incorporated
  • Nestlé S.A.
  • PepsiCo
  • Smithfield Food Inc.
  • The Coca-Cola Company
  • The Kraft Heinz Company
  • Tyson Foods Inc.

Companies have been investing extensively to study and modify their product and marketing strategies accordingly, the changing requirements and preferences of customers. Moreover, mergers and alliances have been turned into a typical growth strategy, enabling smaller firms to increase their prospects in the packaged food industry.

logoU.S. Packaged Food Market: By Product Type

  • Bakery & Confectionery Products
  • Beverages
  • Breakfast Cereals
  • Dairy Products
  • Ice Creams & Frozen Novelties
  • Processed Meats
  • Ready-to-Eat Meals
  • Rice, Pasta, & Noodles
  • Sauces, Dressings, & Condiments
  • Snacks & Nutritional Bars
  • Others

logoU.S. Packaged Food Market: By Distribution Channel

  • Hypermarkets and Supermarkets
  • Convenience Store
  • Online Retailers
  • Others

logoU.S. Packaged Food Market: By Region

  • U.S.

Table of Content

  1. Chapter 1 Executive Summary
    1. 1.1. Introduction of Packaged Food
    2. 1.2. U.S. Packaged Food Market, 2020 & 2026 (USD Billion)
    3. 1.3. U.S. Packaged Food Market, 2016 – 2026 (USD Billion)
    4. 1.4. U.S. Packaged Food Market Absolute Revenue Opportunity, 2016 – 2026 (USD Billion)
    5. 1.5. U.S. Packaged Food Market Incremental Revenue Opportunity, 2020 – 2026 (USD Billion)
  2. Chapter 2 Packaged Food Market – Type Analysis
    1. 2.1. U.S. Packaged Food Market – Type Overview
    2. 2.2. U.S. Packaged Food Market Share, by Type, 2020 & 2026 (USD Billion)
    3. 2.3. Bakery & Confectionery Products
      1. 2.3.1. U.S. Bakery & Confectionery Products Packaged Food Market, 2016 – 2026 (USD Billion)
    4. 2.4. Beverages
      1. 2.4.1. U.S. Beverages Packaged Food Market, 2016 – 2026 (USD Billion)
    5. 2.5. Breakfast Cereals
      1. 2.5.1. U.S. Breakfast Cereals Packaged Food Market, 2016 – 2026 (USD Billion)
    6. 2.6. Dairy Products
      1. 2.6.1. U.S. Dairy Products Packaged Food Market, 2016 – 2026 (USD Billion)
    7. 2.7. Ice Creams & Frozen Novelties
      1. 2.7.1. U.S. Ice Creams & Frozen Novelties Packaged Food Market, 2016 – 2026 (USD Billion)
    8. 2.8. Processed Meats
      1. 2.8.1. U.S. Processed Meats Packaged Food Market, 2016 – 2026 (USD Billion)
    9. 2.9. Ready-to-Eat Meals
      1. 2.9.1. U.S. Ready-to-Eat Meals Packaged Food Market, 2016 – 2026 (USD Billion)
    10. 2.10. Rice, Pasta, & Noodles
      1. 2.10.1. U.S. Rice, Pasta, & Noodles Packaged Food Market, 2016 – 2026 (USD Billion)
    11. 2.11. Sauces, Dressings, & Condiments
      1. 2.11.1. U.S. Sauces, Dressings, & Condiments Packaged Food Market, 2016 – 2026 (USD Billion)
    12. 2.12. Snacks & Nutritional Bars
      1. 2.12.1. U.S. Snacks & Nutritional Bars Packaged Food Market, 2016 – 2026 (USD Billion)
    13. 2.13. Others
      1. 2.13.1. U.S. Others Packaged Food Market, 2016 – 2026 (USD Billion)
  3. Chapter 3 Packaged Food Market – Distribution Channel Analysis
    1. 3.1. U.S. Packaged Food Market – Distribution Channel Overview
    2. 3.2. U.S. Packaged Food Market Share, by Distribution Channel, 2020 & 2026 (USD Billion)
    3. 3.3. Hypermarkets and Supermarkets
      1. 3.3.1. U.S. Hypermarkets and Supermarkets Packaged Food Market, 2016 – 2026 (USD Billion)
    4. 3.4. Convenience Store
      1. 3.4.1. U.S. Convenience Store Packaged Food Market, 2016 – 2026 (USD Billion)
    5. 3.5. Online Retailers
      1. 3.5.1. U.S. Online Retailers Packaged Food Market, 2016 – 2026 (USD Billion)
    6. 3.6. Others
      1. 3.6.1. U.S. Others Packaged Food Market, 2016 – 2026 (USD Billion)
  4. Chapter 4 Packaged Food Market – Competitive Landscape
    1. 4.1. Competitor Market Share – Revenue
    2. 4.2. Market Concentration Rate Analysis, Top 3 and Top 5 Players
    3. 4.3. Strategic Developments
      1. 4.3.1. Acquisitions and Mergers
      2. 4.3.2. New Products
      3. 4.3.3. Research & Development Activities
  5. Chapter 5 Company Profiles
    1. 5.1. Cargill, Incorporated
      1. 5.1.1. Company Overview
      2. 5.1.2. Product/Service Portfolio
      3. 5.1.3. Cargill, Incorporated Sales, Revenue, and Gross Margin
      4. 5.1.4. Cargill, Incorporated Revenue and Growth Rate
      5. 5.1.5. Cargill, Incorporated Market Share
      6. 5.1.6. Recent Initiatives, Funding/VC Activities, and Technological Innovations
    2. 5.2. Conagra Brands, Inc.
      1. 5.2.1. Company Overview
      2. 5.2.2. Product/Service Portfolio
      3. 5.2.3. Conagra Brands, Inc. Sales, Revenue, and Gross Margin
      4. 5.2.4. Conagra Brands, Inc. Revenue and Growth Rate
      5. 5.2.5. Conagra Brands, Inc. Market Share
      6. 5.2.6. Recent Initiatives, Funding/VC Activities, and Technological Innovations
    3. 5.3. General Mills Inc.
      1. 5.3.1. Company Overview
      2. 5.3.2. Product/Service Portfolio
      3. 5.3.3. General Mills Inc. Sales, Revenue, and Gross Margin
      4. 5.3.4. General Mills Inc. Revenue and Growth Rate
      5. 5.3.5. General Mills Inc. Market Share
      6. 5.3.6. Recent Initiatives, Funding/VC Activities, and Technological Innovations
    4. 5.4. Hormel Foods Corporation
      1. 5.4.1. Company Overview
      2. 5.4.2. Product/Service Portfolio
      3. 5.4.3. Hormel Foods Corporation Sales, Revenue, and Gross Margin
      4. 5.4.4. Hormel Foods Corporation Revenue and Growth Rate
      5. 5.4.5. Hormel Foods Corporation Market Share
      6. 5.4.6. Recent Initiatives, Funding/VC Activities, and Technological Innovations
    5. 5.5. JBS Foods S.A.
      1. 5.5.1. Company Overview
      2. 5.5.2. Product/Service Portfolio
      3. 5.5.3. JBS Foods S.A. Sales, Revenue, and Gross Margin
      4. 5.5.4. JBS Foods S.A. Revenue and Growth Rate
      5. 5.5.5. JBS Foods S.A. Market Share
      6. 5.5.6. Recent Initiatives, Funding/VC Activities, and Technological Innovations
    6. 5.6. Kellogg Co.
      1. 5.6.1. Company Overview
      2. 5.6.2. Product/Service Portfolio
      3. 5.6.3. Kellogg Co. Sales, Revenue, and Gross Margin
      4. 5.6.4. Kellogg Co. Revenue and Growth Rate
      5. 5.6.5. Kellogg Co. Market Share
      6. 5.6.6. Recent Initiatives, Funding/VC Activities, and Technological Innovations
    7. 5.7. Kraft Foods Group, Inc.
      1. 5.7.1. Company Overview
      2. 5.7.2. Product/Service Portfolio
      3. 5.7.3. Kraft Foods Group, Inc. Sales, Revenue, and Gross Margin
      4. 5.7.4. Kraft Foods Group, Inc. Revenue and Growth Rate
      5. 5.7.5. Kraft Foods Group, Inc. Market Share
      6. 5.7.6. Recent Initiatives, Funding/VC Activities, and Technological Innovations
    8. 5.8. Maple Leaf Foods, Inc.
      1. 5.8.1. Company Overview
      2. 5.8.2. Product/Service Portfolio
      3. 5.8.3. Maple Leaf Foods, Inc. Sales, Revenue, and Gross Margin
      4. 5.8.4. Maple Leaf Foods, Inc. Revenue and Growth Rate
      5. 5.8.5. Maple Leaf Foods, Inc. Market Share
      6. 5.8.6. Recent Initiatives, Funding/VC Activities, and Technological Innovations
    9. 5.9. Mars, Incorporated
      1. 5.9.1. Company Overview
      2. 5.9.2. Product/Service Portfolio
      3. 5.9.3. Mars, Incorporated Sales, Revenue, and Gross Margin
      4. 5.9.4. Mars, Incorporated Revenue and Growth Rate
      5. 5.9.5. Mars, Incorporated Market Share
      6. 5.9.6. Recent Initiatives, Funding/VC Activities, and Technological Innovations
    10. 5.10. Nestlé S.A.
      1. 5.10.1. Company Overview
      2. 5.10.2. Product/Service Portfolio
      3. 5.10.3. Nestlé S.A. Sales, Revenue, and Gross Margin
      4. 5.10.4. Nestlé S.A. Revenue and Growth Rate
      5. 5.10.5. Nestlé S.A. Market Share
      6. 5.10.6. Recent Initiatives, Funding/VC Activities, and Technological Innovations
    11. 5.11. PepsiCo
      1. 5.11.1. Company Overview
      2. 5.11.2. Product/Service Portfolio
      3. 5.11.3. PepsiCo Sales, Revenue, and Gross Margin
      4. 5.11.4. PepsiCo Revenue and Growth Rate
      5. 5.11.5. PepsiCo Market Share
      6. 5.11.6. Recent Initiatives, Funding/VC Activities, and Technological Innovations
    12. 5.12. Smithfield Food, Inc.
      1. 5.12.1. Company Overview
      2. 5.12.2. Product/Service Portfolio
      3. 5.12.3. Smithfield Food, Inc. Sales, Revenue, and Gross Margin
      4. 5.12.4. Smithfield Food, Inc. Revenue and Growth Rate
      5. 5.12.5. Smithfield Food, Inc. Market Share
      6. 5.12.6. Recent Initiatives, Funding/VC Activities, and Technological Innovations
    13. 5.13. The Coca-Cola Company
      1. 5.13.1. Company Overview
      2. 5.13.2. Product/Service Portfolio
      3. 5.13.3. The Coca-Cola Company Sales, Revenue, and Gross Margin
      4. 5.13.4. The Coca-Cola Company Revenue and Growth Rate
      5. 5.13.5. The Coca-Cola Company Market Share
      6. 5.13.6. Recent Initiatives, Funding/VC Activities, and Technological Innovations
    14. 5.14. The Kraft Heinz Company
      1. 5.14.1. Company Overview
      2. 5.14.2. Product/Service Portfolio
      3. 5.14.3. The Kraft Heinz Company Sales, Revenue, and Gross Margin
      4. 5.14.4. The Kraft Heinz Company Revenue and Growth Rate
      5. 5.14.5. The Kraft Heinz Company Market Share
      6. 5.14.6. Recent Initiatives, Funding/VC Activities, and Technological Innovations
    15. 5.15. Tyson Foods, Inc.
      1. 5.15.1. Company Overview
      2. 5.15.2. Product/Service Portfolio
      3. 5.15.3. Tyson Foods, Inc. Sales, Revenue, and Gross Margin
      4. 5.15.4. Tyson Foods, Inc. Revenue and Growth Rate
      5. 5.15.5. Tyson Foods, Inc. Market Share
      6. 5.15.6. Recent Initiatives, Funding/VC Activities, and Technological Innovations
  6. Chapter 6 Packaged Food — Industry Analysis
    1. 6.1. Introduction and Taxonomy
    2. 6.2. Packaged Food Market – Key Trends
      1. 6.2.1. Market Drivers
      2. 6.2.2. Market Restraints
      3. 6.2.3. Market Opportunities
    3. 6.3. Value Chain Analysis
    4. 6.4. Key Mandates and Regulations
    5. 6.5. Technology Roadmap and Timeline
    6. 6.6. Packaged Food Market – Attractiveness Analysis
      1. 6.6.1. By Type
      2. 6.6.2. By Distribution Channel
  7. Chapter 7 Industrial Chain, Sourcing Strategy, and Downstream Buyers
    1. 7.1. Packaged Food Industrial Chain Analysis
    2. 7.2. Downstream Buyers
    3. 7.3. Distributors/Traders List
  8. Chapter 8 Marketing Strategy Analysis
    1. 8.1. Marketing Channel
    2. 8.2. Direct Marketing
    3. 8.3. Indirect Marketing
    4. 8.4. Marketing Channel Development Trends
    5. 8.5. Economic/Political Environmental Change
  9. Chapter 9 Report Conclusion & Key Insights
    1. 9.1. Key Insights from Primary Interviews & Surveys Respondents
    2. 9.2. Key Takeaways from Analysts, Consultants, and Industry Leaders
  10. Chapter 10 Research Approach & Methodology
    1. 10.1. Report Description
    2. 10.2. Research Scope
    3. 10.3. Research Methodology
      1. 10.3.1. Secondary Research
      2. 10.3.2. Primary Research
      3. 10.3.3. Statistical Models
        1. 10.3.3.1. Company Share Analysis Model
        2. 10.3.3.2. Revenue Based Modeling
      4. 10.3.4. Research Limitations

      List of Figures

      Fig.1	Product Picture of Packaged Food
      Fig.2	U.S. Packaged Food Market, 2016 – 2026 (USD Billion)
      Fig.3	U.S. Packaged Food Market Absolute Revenue Opportunity, 2016 – 2026 (USD Billion)
      Fig.4	U.S. Packaged Food Market Incremental Revenue Opportunity, 2020 – 2026 (USD Billion)
      Fig.5	U.S. Packaged Food Market Share, by Type, 2020 & 2026 (USD Billion)
      Fig.6	U.S. Bakery & Confectionery Products Packaged Food Market, 2016 – 2026 (USD Billion)
      Fig.7	U.S. Beverages Packaged Food Market, 2016 – 2026 (USD Billion)
      Fig.8	U.S. Breakfast Cereals Packaged Food Market, 2016 – 2026 (USD Billion)
      Fig.9	U.S. Dairy Products Packaged Food Market, 2016 – 2026 (USD Billion)
      Fig.10	U.S. Ice Creams & Frozen Novelties Packaged Food Market, 2016 – 2026 (USD Billion)
      Fig.11	U.S. Processed Meats Packaged Food Market, 2016 – 2026 (USD Billion)
      Fig.12	U.S. Ready-to-Eat Meals Packaged Food Market, 2016 – 2026 (USD Billion)
      Fig.13	U.S. Rice, Pasta, & Noodles Packaged Food Market, 2016 – 2026 (USD Billion)
      Fig.14	U.S. Sauces, Dressings, & Condiments Packaged Food Market, 2016 – 2026 (USD Billion)
      Fig.15	U.S. Snacks & Nutritional Bars Packaged Food Market, 2016 – 2026 (USD Billion)
      Fig.16	U.S. Others Packaged Food Market, 2016 – 2026 (USD Billion)
      Fig.17	U.S. Packaged Food Market Share, by  Distribution Channel, 2020 & 2026 (USD Billion)
      Fig.18	U.S. Hypermarkets and Supermarkets Packaged Food Market, 2016 – 2026 (USD Billion)
      Fig.19	U.S. Convenience Store Packaged Food Market, 2016 – 2026 (USD Billion)
      Fig.20	U.S. Online Retailers Packaged Food Market, 2016 – 2026 (USD Billion)
      Fig.21	U.S. Others Packaged Food Market, 2016 – 2026 (USD Billion)
      Fig.22	Competitor Market Share – Revenue
      Fig.23	Cargill, Incorporated Revenue and Growth Rate
      Fig.24	Cargill, Incorporated Market Share
      Fig.25	Conagra Brands, Inc. Revenue and Growth Rate
      Fig.26	Conagra Brands, Inc. Market Share
      Fig.27	General Mills Inc. Revenue and Growth Rate
      Fig.28	General Mills Inc. Market Share
      Fig.29	Hormel Foods Corporation Revenue and Growth Rate
      Fig.30	Hormel Foods Corporation Market Share
      Fig.31	JBS Foods S.A. Revenue and Growth Rate
      Fig.32	JBS Foods S.A. Market Share
      Fig.33	Kellogg Co. Revenue and Growth Rate
      Fig.34	Kellogg Co. Market Share
      Fig.35	Kraft Foods Group, Inc. Revenue and Growth Rate
      Fig.36	Kraft Foods Group, Inc. Market Share
      Fig.37	Maple Leaf Foods, Inc. Revenue and Growth Rate
      Fig.38	Maple Leaf Foods, Inc. Market Share
      Fig.39	Mars, Incorporated Revenue and Growth Rate
      Fig.40	Mars, Incorporated Market Share
      Fig.41	Nestlé S.A. Revenue and Growth Rate
      Fig.42	Nestlé S.A. Market Share
      Fig.43	PepsiCo Revenue and Growth Rate
      Fig.44	PepsiCo Market Share
      Fig.45	Smithfield Food, Inc. Revenue and Growth Rate
      Fig.46	Smithfield Food, Inc. Market Share
      Fig.47	The Coca-Cola Company Revenue and Growth Rate
      Fig.48	The Coca-Cola Company Market Share
      Fig.49	The Kraft Heinz Company Revenue and Growth Rate
      Fig.50	The Kraft Heinz Company Market Share
      Fig.51	Tyson Foods, Inc. Revenue and Growth Rate
      Fig.52	Tyson Foods, Inc. Market Share
      Fig.53	Market Dynamics
      Fig.54	U.S. Packaged Food – Value Chain Analysis
      Fig.55	Key Mandates and Regulations
      Fig.56	Technology Roadmap and Timeline
      Fig.57	Market Attractiveness Analysis – By Type
      Fig.58	Market Attractiveness Analysis – By  Distribution Channel
      Fig.59	Packaged Food Industrial Chain Analysis
      Fig.60	Market Channels
      Fig.61	Marketing Channel Development Trend
      Fig.62	Growth in World Gross Product, 2008-2018
      

      List of Tables

      	
      Table 1	U.S. Packaged Food Market, 2020 & 2026 (USD Billion)
      Table 2	U.S. Packaged Food Market, by Type, 2016 – 2026 (USD Billion)
      Table 3	U.S. Packaged Food Market, by  Distribution Channel, 2016 – 2026 (USD Billion)
      Table 4	U.S. Packaged Food Market - Company Revenue Analysis, 2016 – 2019 (USD Billion)
      Table 5	U.S. Packaged Food Market - Company Revenue Share Analysis, 2016 – 2019 (%)
      Table 6	Acquisitions and Mergers
      Table 7	Market Drivers – Impact Analysis
      Table 8	Market Restraints
      Table 9	Market Opportunities
      Table 10 Major Buyers of Packaged Food
      Table 11 Distributors/Traders of Packaged Food
      

Industry Major Market Players

  • Cargill
  • Incorporated
  • Conagra Brands Inc.
  • General Mills Inc.
  • Hormel Foods Corporation
  • JBS Foods S.A.
  • Kellogg Co.
  • Kraft Foods Group Inc.
  • Maple Leaf Foods Inc.
  • Mars
  • Incorporated
  • Nestlé S.A.
  • PepsiCo
  • Smithfield Food Inc.
  • The Coca-Cola Company
  • The Kraft Heinz Company
  • Tyson Foods Inc.