Search Market Research Report

Discover Our Latest Reports
Discover Our Featured Reports
Discover Top Selling Reports

Gas Engine Market Size, Share Global Analysis Report, 2021 - 2026

report img

Gas Engine Market By Product (Natural Gas, Special Gas, & Others), By Power Output (0.5 – 1 MW, 1 -2 MW, 2 - 5 MW, 5 - 10 MW, & 10 - 20 MW), By Application (Power Generation, Mechanical Drive, Cogeneration, & Others), And By Regions - Global & Regional Industry Perspective, Comprehensive Analysis, and Forecast 2021 - 2026

Industry Insights

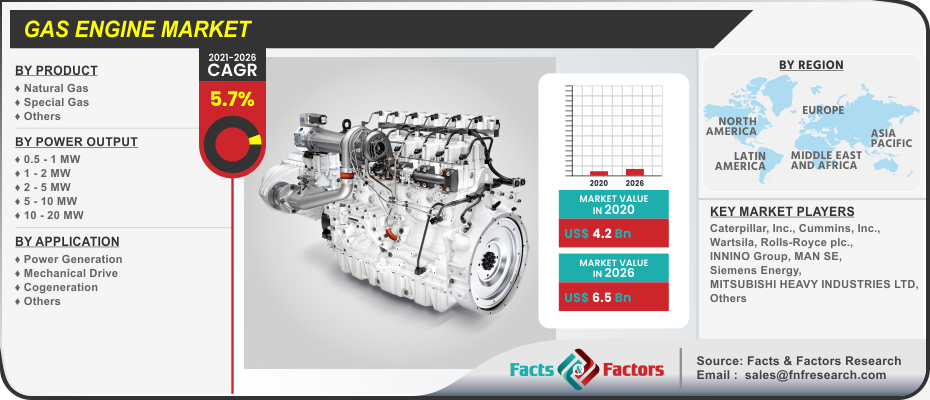
[215+ Pages Report] We at Facts & Factors have recently published a report titled “Global Gas Engine Market” that encompasses the spectacle of the market in an analytical and comprehensive manner. In this report, the global gas engine market is expected to value around USD 6.5 Billion by 2026 from an initial value of USD 4.2 Billion in the year 2020 at a CAGR value of 5.7%.

logoMarket Overview

Gas engines are a form of internal combustion engines that run on a variety of fuels such as coal based fuel, producer based fuel, biogas, landfill based gas, and natural gas. Gas engines are used for running continuously at full load speeds for longer amounts of periods such as 8,760 hours per year on average. The typical power output for gas engines is 10kW (13hp) to 4 MW (5,364 hp) on average. Generally speaking, natural gas is emerging as the commonly used fuel among its counterparts owing to its popularity and availability.

logoIndustry Growth Factors

The primary driving factors for the significant growth of the global gas engine market can be contributed to rising demand for clean and efficient power generation technologies coupled with increasing implementation of stricter emission based regulations to name a few. Additionally, a shifting focus ongas-fired power plants coupled with rising energy distribution sources is expected to increase the footprint of the global gas engine market during the advent of the forecast duration. Moreover, rising reliability among gas powered engines coupled with increasing demand from vessels aimed at associating with offshore drilling activities is expected to fuel the growth of the global gas engine market during the advent of the forecast.

The global gas engine market is expected to be driven by the latest iteration of development among power generation technologies coupled with rising population levels demanding increased power generation to name a few. The increased integration of gas powered engines inthe sector of power generation coupled with rising urbanization is expected to push the boundaries of the global gas engine market during the advent of the forecast period. However, limited natural resources coupled with extreme price differences between a global purview is expected to hamper the growth of the global gas engine market during the advent of the forecast period.

Gas Engine Market

To know more about this report | Request Free Sample Copy

logoSegmentation Analysis

The global gas engine market is segmented intoproduct, power output, application, and regions.

The global gas engine market is divided intonatural gas, special gas, and others on the basis of product. The segment pertaining to natural gas is expected to witness the largest market share during the advent of the forecast owing tothe fuel being the cleanest burning fuel among its counterparts coupled with lowest carbon emissions among others. Additionally, factors pertaining to the absence of particulate matter leading to reduced engine wear and tear are expected to cement the growth of the segment during the forecast period. On the basis of power output, theglobal gas engine market is categorized into 0.5 – 1 MW, 1 -2 MW, 2 - 5 MW, 5 - 10 MW, and 10 - 20 MW. The 1 - 2 MW segment is expected to witness the largest market share during the advent of the forecast period owing to the current power generation associated with the power generation and cogeneration coupled with increased integration among the sector of space and water heating to name a few. Based on application, the global gas engine market is fragmented into power generation, mechanical drive, cogeneration, and others. The power generation category is expected to witness the largest market share during the advent of the forecast owing to rising demands from the sector of manufacturing plants, commercial buildings, power buildings, and utilities for on-site and off-site plants coupled with rising spending across the globe for constructing new gas-fired power plants to name a few.

logo Report Scope

Report Attribute

Details

Market Size in 2020

USD 4.2 Billion

Projected Market Size in 2026

USD 6.5 Billion

CAGR Growth Rate

5.7% CAGR

Base Year

2020

Forecast Years

2021-2026

Key Market Players

Caterpillar, Inc., Cummins, Inc., Wartsila, Rolls-Royce plc., INNINO Group, MAN SE, Siemens Energy, MITSUBISHI HEAVY INDUSTRIES LTD., Kawasaki Heavy Industries Ltd., IHI Power Systems Co. Ltd., JFE Engineering Corporation, Hyundai Heavy Industries Co. Ltd., Liebherr, and R Schmitt Enertec GmbH, among others.

Key Segments

Products, Power Output, Applications, and Region

Major Regions Covered

North America, Europe, Asia Pacific, Latin America, and Middle East & Africa

Purchase Options

Request customized purchase options to meet your research needs. Explore purchase options

logo Regional Analysis

North America is expected to witness the largest market share during the advent of the forecast owing to the region being the primary source of natural gas fired power generation coupled with rising usage of gas engines forpower generating capacities to name a few. Additionally, rising shale gas production in the region coupled with increasing demand of electricity is expected to increase the footprint of the gas engine market during the advent of the forecast period. Asia-Pacific is expected to witness the fastest growing CAGR during the advent of the forecast owing to rising demand for electricity in the region due to increasing number of populous regions coupled with increasing adoption of clean and reliable energy sources from emerging economies such as India, Japan, and South Korea to name a few.

logo Competitive Players

The key market participants for the global gas engine market are:

  • Caterpillar Inc.
  • Cummins Inc.
  • Wartsila
  • Rolls-Royce plc.
  • INNINO Group
  • MAN SE
  • Siemens Energy
  • MITSUBISHI HEAVY INDUSTRIES LTD.
  • Kawasaki Heavy Industries Ltd.
  • IHI Power Systems Co. Ltd.
  • JFE Engineering Corporation
  • Hyundai Heavy Industries Co. Ltd.
  • Liebherr
  • R Schmitt Enertec GmbH

logo By Product Segment Analysis

  • Natural Gas
  • Special Gas
  • Others

logo By Power Output Segment Analysis

  • 0.5 – 1 MW
  • 1 -2 MW
  • 2 - 5 MW
  • 5 - 10 MW
  • 10 - 20 MW

logo By Application Segment Analysis

  • Power Generation
  • Mechanical Drive
  • Cogeneration
  • Others

Table of Content

  1. Chapter 1 Executive Summary
    1. 1.1. Introduction of Gas Engine
    2. 1.2. Global Gas Engine Market, 2019 & 2026 (USD Billion)
    3. 1.3. Global Gas Engine Market, 2016 – 2026 (USD Billion)
    4. 1.4. Global Gas Engine Market Absolute Revenue Opportunity, 2016 – 2026 (USD Billion)
    5. 1.5. Global Gas Engine Market Incremental Revenue Opportunity, 2020 – 2026 (USD Billion)
  2. Chapter 2 Gas Engine Market – Product Analysis
    1. 2.1. Global Gas Engine Market – Product Overview
    2. 2.2. Global Gas Engine Market Share, by Product, 2019 & 2026 (USD Billion)
    3. 2.3. Natural Gas
      1. 2.3.1. Global Natural Gas Gas Engine Market, 2016 – 2026 (USD Billion)
    4. 2.4. Special Gas
      1. 2.4.1. Global Special Gas Gas Engine Market, 2016 – 2026 (USD Billion)
    5. 2.5. Others
      1. 2.5.1. Global Others Gas Engine Market, 2016 – 2026 (USD Billion)
  3. Chapter 3 Gas Engine Market – Power Output Analysis
    1. 3.1. Global Gas Engine Market – Power Output Overview
    2. 3.2. Global Gas Engine Market Share, by Power Output, 2019 & 2026 (USD Billion)
      1. 3.3. 0.5 – 1 MW
      2. 3.3.1. Global 0.5 – 1 MW Gas Engine Market, 2016 – 2026 (USD Billion)
    3. 3.4. 1 -2 MW
      1. 3.4.1. Global 1 -2 MW Gas Engine Market, 2016 – 2026 (USD Billion)
    4. 3.5. 2 - 5 MW
      1. 3.5.1. Global 2 - 5 MW Gas Engine Market, 2016 – 2026 (USD Billion)
    5. 3.6. 5 - 10 MW
      1. 3.6.1. Global 5 - 10 MW Gas Engine Market, 2016 – 2026 (USD Billion)
    6. 3.7. 10 - 20 MW
      1. 3.7.1. Global 10 - 20 MW Gas Engine Market, 2016 – 2026 (USD Billion)
  4. Chapter 4 Gas Engine Market – Application Analysis
    1. 4.1. Global Gas Engine Market – Application Overview
    2. 4.2. Global Gas Engine Market Share, by Application, 2019 & 2026 (USD Billion)
    3. 4.3. Power Generation
      1. 4.3.1. Global Power Generation Gas Engine Market, 2016 – 2026 (USD Billion)
    4. 4.4. Mechanical Drive
      1. 4.4.1. Global Mechanical Drive Gas Engine Market, 2016 – 2026 (USD Billion)
    5. 4.5. Cogeneration
      1. 4.5.1. Global Cogeneration Gas Engine Market, 2016 – 2026 (USD Billion)
    6. 4.6. Others
      1. 4.6.1. Global Others Gas Engine Market, 2016 – 2026 (USD Billion)
  5. Chapter 5 Gas Engine Market – Regional Analysis
    1. 5.1. Global Gas Engine Market Regional Overview
    2. 5.2. Global Gas Engine Market Share, by Region, 2019 & 2026 (USD Billion)
    3. 5.3. North America
      1. 5.3.1. North America Gas Engine Market, 2016 – 2026 (USD Billion)
        1. 5.3.1.1. North America Gas Engine Market, by Country, 2016 - 2026 (USD Billion)
      2. 5.3.2. North America Gas Engine Market, by Product, 2016 – 2026
        1. 5.3.2.1. North America Gas Engine Market, by Product, 2016 – 2026 (USD Billion)
      3. 5.3.3. North America Gas Engine Market, by Power Output, 2016 – 2026
        1. 5.3.3.1. North America Gas Engine Market, by Power Output, 2016 – 2026 (USD Billion)
      4. 5.3.4. North America Gas Engine Market, by Application, 2016 – 2026
        1. 5.3.4.1. North America Gas Engine Market, by Application, 2016 – 2026 (USD Billion)
      5. 5.3.5. U.S.
        1. 5.3.5.1. U.S. Gas Engine Market, 2016 – 2026 (USD Billion)
      6. 5.3.6. Canada
        1. 5.3.6.1. Canada Gas Engine Market, 2016 – 2026 (USD Billion)
    4. 5.4. Europe
      1. 5.4.1. Europe Gas Engine Market, 2016 – 2026 (USD Billion)
        1. 5.4.1.1. Europe Gas Engine Market, by Country, 2016 - 2026 (USD Billion)
      2. 5.4.2. Europe Gas Engine Market, by Product, 2016 – 2026
        1. 5.4.2.1. Europe Gas Engine Market, by Product, 2016 – 2026 (USD Billion)
      3. 5.4.3. Europe Gas Engine Market, by Power Output, 2016 – 2026
        1. 5.4.3.1. Europe Gas Engine Market, by Power Output, 2016 – 2026 (USD Billion)
      4. 5.4.4. Europe Gas Engine Market, by Application, 2016 – 2026
        1. 5.4.4.1. Europe Gas Engine Market, by Application, 2016 – 2026 (USD Billion)
      5. 5.4.5. Germany
        1. 5.4.5.1. Germany Gas Engine Market, 2016 – 2026 (USD Billion)
      6. 5.4.6. France
        1. 5.4.6.1. France Gas Engine Market, 2016 – 2026 (USD Billion)
      7. 5.4.7. U.K.
        1. 5.4.7.1. U.K. Gas Engine Market, 2016 – 2026 (USD Billion)
      8. 5.4.8. Italy
        1. 5.4.8.1. Italy Gas Engine Market, 2016 – 2026 (USD Billion)
      9. 5.4.9. Spain
        1. 5.4.9.1. Spain Gas Engine Market, 2016 – 2026 (USD Billion)
      10. 5.4.10. Rest of Europe
        1. 5.4.10.1. Rest of Europe Gas Engine Market, 2016 – 2026 (USD Billion)
    5. 5.5. Asia Pacific
      1. 5.5.1. Asia Pacific Gas Engine Market, 2016 – 2026 (USD Billion)
        1. 5.5.1.1. Asia Pacific Gas Engine Market, by Country, 2016 - 2026 (USD Billion)
      2. 5.5.2. Asia Pacific Gas Engine Market, by Product, 2016 – 2026
        1. 5.5.2.1. Asia Pacific Gas Engine Market, by Product, 2016 – 2026 (USD Billion)
      3. 5.5.3. Asia Pacific Gas Engine Market, by Power Output, 2016 – 2026
        1. 5.5.3.1. Asia Pacific Gas Engine Market, by Power Output, 2016 – 2026 (USD Billion)
      4. 5.5.4. Asia Pacific Gas Engine Market, by Application, 2016 – 2026
        1. 5.5.4.1. Asia Pacific Gas Engine Market, by Application, 2016 – 2026 (USD Billion)
      5. 5.5.5. China
        1. 5.5.5.1. China Gas Engine Market, 2016 – 2026 (USD Billion)
      6. 5.5.6. Japan
        1. 5.5.6.1. Japan Gas Engine Market, 2016 – 2026 (USD Billion)
      7. 5.5.7. India
        1. 5.5.7.1. India Gas Engine Market, 2016 – 2026 (USD Billion)
      8. 5.5.8. South Korea
        1. 5.5.8.1. South Korea Gas Engine Market, 2016 – 2026 (USD Billion)
      9. 5.5.9. South-East Asia
        1. 5.5.9.1. South-East Asia Gas Engine Market, 2016 – 2026 (USD Billion)
      10. 5.5.10. Rest of Asia Pacific
        1. 5.5.10.1. Rest of Asia Pacific Gas Engine Market, 2016 – 2026 (USD Billion)
    6. 5.6. Latin America
      1. 5.6.1. Latin America Gas Engine Market, 2016 – 2026 (USD Billion)
        1. 5.6.1.1. Latin America Gas Engine Market, by Country, 2016 - 2026 (USD Billion)
      2. 5.6.2. Latin America Gas Engine Market, by Product, 2016 – 2026
        1. 5.6.2.1. Latin America Gas Engine Market, by Product, 2016 – 2026 (USD Billion)
      3. 5.6.3. Latin America Gas Engine Market, by Power Output, 2016 – 2026
        1. 5.6.3.1. Latin America Gas Engine Market, by Power Output, 2016 – 2026 (USD Billion)
      4. 5.6.4. Latin America Gas Engine Market, by Application, 2016 – 2026
        1. 5.6.4.1. Latin America Gas Engine Market, by Application, 2016 – 2026 (USD Billion)
      5. 5.6.5. Brazil
        1. 5.6.5.1. Brazil Gas Engine Market, 2016 – 2026 (USD Billion)
      6. 5.6.6. Mexico
        1. 5.6.6.1. Mexico Gas Engine Market, 2016 – 2026 (USD Billion)
      7. 5.6.7. Rest of Latin America
        1. 5.6.7.1. Rest of Latin America Gas Engine Market, 2016 – 2026 (USD Billion)
    7. 5.7. The Middle-East and Africa
      1. 5.7.1. The Middle-East and Africa Gas Engine Market, 2016 – 2026 (USD Billion)
        1. 5.7.1.1. The Middle-East and Africa Gas Engine Market, by Country, 2016 - 2026 (USD Billion)
      2. 5.7.2. The Middle-East and Africa Gas Engine Market, by Product, 2016 – 2026
        1. 5.7.2.1. The Middle-East and Africa Gas Engine Market, by Product, 2016 – 2026 (USD Billion)
      3. 5.7.3. The Middle-East and Africa Gas Engine Market, by Power Output, 2016 – 2026
        1. 5.7.3.1. The Middle-East and Africa Gas Engine Market, by Power Output, 2016 – 2026 (USD Billion)
      4. 5.7.4. The Middle-East and Africa Gas Engine Market, by Application, 2016 – 2026
        1. 5.7.4.1. The Middle-East and Africa Gas Engine Market, by Application, 2016 – 2026 (USD Billion)
      5. 5.7.5. GCC Countries
        1. 5.7.5.1. GCC Countries Gas Engine Market, 2016 – 2026 (USD Billion)
      6. 5.7.6. South Africa
        1. 5.7.6.1. South Africa Gas Engine Market, 2016 – 2026 (USD Billion)
      7. 5.7.7. Rest of Middle-East Africa
        1. 5.7.7.1. Rest of Middle-East Africa Gas Engine Market, 2016 – 2026 (USD Billion)
  6. Chapter 6 Gas Engine Market – Competitive Landscape
    1. 6.1. Competitor Market Share – Revenue
    2. 6.2. Market Concentration Rate Analysis, Top 3 and Top 5 Players
    3. 6.3. Strategic Developments
      1. 6.3.1. Acquisitions and Mergers
      2. 6.3.2. New Products
      3. 6.3.3. Research & Development Activities
  7. Chapter 7 Company Profiles
    1. 7.1. Caterpillar Inc
      1. 7.1.1. Company Overview
      2. 7.1.2. Product/Service Portfolio
      3. 7.1.3. Caterpillar Inc Sales, Revenue, and Gross Margin
      4. 7.1.4. Caterpillar Inc Revenue and Growth Rate
      5. 7.1.5. Caterpillar Inc Market Share
      6. 7.1.6. Recent Initiatives, Funding/VC Activities, and Technological Innovations
    2. 7.2. Cummins Inc
      1. 7.2.1. Company Overview
      2. 7.2.2. Product/Service Portfolio
      3. 7.2.3. Cummins Inc Sales, Revenue, and Gross Margin
      4. 7.2.4. Cummins Inc Revenue and Growth Rate
      5. 7.2.5. Cummins Inc Market Share
      6. 7.2.6. Recent Initiatives, Funding/VC Activities, and Technological Innovations
    3. 7.3. Wartsila
      1. 7.3.1. Company Overview
      2. 7.3.2. Product/Service Portfolio
      3. 7.3.3. Wartsila Sales, Revenue, and Gross Margin
      4. 7.3.4. Wartsila Revenue and Growth Rate
      5. 7.3.5. Wartsila Market Share
      6. 7.3.6. Recent Initiatives, Funding/VC Activities, and Technological Innovations
    4. 7.4. Rolls-Royce plc
      1. 7.4.1. Company Overview
      2. 7.4.2. Product/Service Portfolio
      3. 7.4.3. Rolls-Royce plc Sales, Revenue, and Gross Margin
      4. 7.4.4. Rolls-Royce plc Revenue and Growth Rate
      5. 7.4.5. Rolls-Royce plc Market Share
      6. 7.4.6. Recent Initiatives, Funding/VC Activities, and Technological Innovations
    5. 7.5. INNINO Group
      1. 7.5.1. Company Overview
      2. 7.5.2. Product/Service Portfolio
      3. 7.5.3. INNINO Group Sales, Revenue, and Gross Margin
      4. 7.5.4. INNINO Group Revenue and Growth Rate
      5. 7.5.5. INNINO Group Market Share
      6. 7.5.6. Recent Initiatives, Funding/VC Activities, and Technological Innovations
    6. 7.6. MAN SE
      1. 7.6.1. Company Overview
      2. 7.6.2. Product/Service Portfolio
      3. 7.6.3. MAN SE Sales, Revenue, and Gross Margin
      4. 7.6.4. MAN SE Revenue and Growth Rate
      5. 7.6.5. MAN SE Market Share
      6. 7.6.6. Recent Initiatives, Funding/VC Activities, and Technological Innovations
    7. 7.7. Siemens Energy
      1. 7.7.1. Company Overview
      2. 7.7.2. Product/Service Portfolio
      3. 7.7.3. Siemens Energy Sales, Revenue, and Gross Margin
      4. 7.7.4. Siemens Energy Revenue and Growth Rate
      5. 7.7.5. Siemens Energy Market Share
      6. 7.7.6. Recent Initiatives, Funding/VC Activities, and Technological Innovations
    8. 7.8. MITSUBISHI HEAVY INDUSTRIES LTD
      1. 7.8.1. Company Overview
      2. 7.8.2. Product/Service Portfolio
      3. 7.8.3. MITSUBISHI HEAVY INDUSTRIES LTD Sales, Revenue, and Gross Margin
      4. 7.8.4. MITSUBISHI HEAVY INDUSTRIES LTD Revenue and Growth Rate
      5. 7.8.5. MITSUBISHI HEAVY INDUSTRIES LTD Market Share
      6. 7.8.6. Recent Initiatives, Funding/VC Activities, and Technological Innovations
    9. 7.9. Kawasaki Heavy Industries Ltd
      1. 7.9.1. Company Overview
      2. 7.9.2. Product/Service Portfolio
      3. 7.9.3. Kawasaki Heavy Industries Ltd Sales, Revenue, and Gross Margin
      4. 7.9.4. Kawasaki Heavy Industries Ltd Revenue and Growth Rate
      5. 7.9.5. Kawasaki Heavy Industries Ltd Market Share
      6. 7.9.6. Recent Initiatives, Funding/VC Activities, and Technological Innovations
    10. 7.10. IHI Power Systems Co. Ltd
      1. 7.10.1. Company Overview
      2. 7.10.2. Product/Service Portfolio
      3. 7.10.3. IHI Power Systems Co. Ltd Sales, Revenue, and Gross Margin
      4. 7.10.4. IHI Power Systems Co. Ltd Revenue and Growth Rate
      5. 7.10.5. IHI Power Systems Co. Ltd Market Share
      6. 7.10.6. Recent Initiatives, Funding/VC Activities, and Technological Innovations
    11. 7.11. JFE Engineering Corporation
      1. 7.11.1. Company Overview
      2. 7.11.2. Product/Service Portfolio
      3. 7.11.3. JFE Engineering Corporation Sales, Revenue, and Gross Margin
      4. 7.11.4. JFE Engineering Corporation Revenue and Growth Rate
      5. 7.11.5. JFE Engineering Corporation Market Share
      6. 7.11.6. Recent Initiatives, Funding/VC Activities, and Technological Innovations
    12. 7.12. Hyundai Heavy Industries Co. Ltd
      1. 7.12.1. Company Overview
      2. 7.12.2. Product/Service Portfolio
      3. 7.12.3. Hyundai Heavy Industries Co. Ltd Sales, Revenue, and Gross Margin
      4. 7.12.4. Hyundai Heavy Industries Co. Ltd Revenue and Growth Rate
      5. 7.12.5. Hyundai Heavy Industries Co. Ltd Market Share
      6. 7.12.6. Recent Initiatives, Funding/VC Activities, and Technological Innovations
    13. 7.13. Liebherr
      1. 7.13.1. Company Overview
      2. 7.13.2. Product/Service Portfolio
      3. 7.13.3. Liebherr Sales, Revenue, and Gross Margin
      4. 7.13.4. Liebherr Revenue and Growth Rate
      5. 7.13.5. Liebherr Market Share
      6. 7.13.6. Recent Initiatives, Funding/VC Activities, and Technological Innovations
    14. 7.14. R Schmitt Enertec GmbH
      1. 7.14.1. Company Overview
      2. 7.14.2. Product/Service Portfolio
      3. 7.14.3. R Schmitt Enertec GmbH Sales, Revenue, and Gross Margin
      4. 7.14.4. R Schmitt Enertec GmbH Revenue and Growth Rate
      5. 7.14.5. R Schmitt Enertec GmbH Market Share
      6. 7.14.6. Recent Initiatives, Funding/VC Activities, and Technological Innovations
  8. Chapter 8 Gas Engine — Industry Analysis
    1. 8.1. Introduction and Taxonomy
    2. 8.2. Gas Engine Market – Key Trends
      1. 8.2.1. Market Drivers
      2. 8.2.2. Market Restraints
      3. 8.2.3. Market Opportunities
    3. 8.3. Value Chain Analysis
    4. 8.4. Key Mandates and Regulations
    5. 8.5. Technology Roadmap and Timeline
    6. 8.6. Gas Engine Market – Attractiveness Analysis
      1. 8.6.1. By Product
      2. 8.6.2. By Power Output
      3. 8.6.3. By Application
      4. 8.6.4. By Region
  9. Chapter 9 Industrial Chain, Sourcing Strategy, and Downstream Buyers
    1. 9.1. Gas Engine Industrial Chain Analysis
    2. 9.2. Downstream Buyers
    3. 9.3. Distributors/Traders List
  10. Chapter 10 Marketing Strategy Analysis
    1. 10.1. Marketing Channel
    2. 10.2. Direct Marketing
    3. 10.3. Indirect Marketing
    4. 10.4. Marketing Channel Development Trends
    5. 10.5. Economic/Political Environmental Change
  11. Chapter 11 Report Conclusion & Key Insights
    1. 11.1. Key Insights from Primary Interviews & Surveys Respondents
    2. 11.2. Key Takeaways from Analysts, Consultants, and Industry Leaders
  12. Chapter 12 Research Approach & Methodology
    1. 12.1. Report Description
    2. 12.2. Research Scope
    3. 12.3. Research Methodology
      1. 12.3.1. Secondary Research
      2. 12.3.2. Primary Research
      3. 12.3.3. Statistical Models
        1. 12.3.3.1. Company Share Analysis Model
        2. 12.3.3.2. Revenue Based Modeling
      4. 12.3.4. Research Limitations

      List of Figures

      Fig.1	Product Picture of Gas Engine
      Fig.2	Global Gas Engine Market, 2016 – 2026 (USD Billion)
      Fig.3	Global Gas Engine Market Absolute Revenue Opportunity, 2016 – 2026 (USD Billion)
      Fig.4	Global Gas Engine Market Incremental Revenue Opportunity, 2020 – 2026 (USD Billion)
      Fig.5	Global Gas Engine Market Share, by Product, 2019 & 2026 (USD Billion)
      Fig.6	Global Natural Gas  Gas Engine Market, 2016 – 2026 (USD Billion)
      Fig.7	Global Special Gas  Gas Engine Market, 2016 – 2026 (USD Billion)
      Fig.8	Global Others Gas Engine Market, 2016 – 2026 (USD Billion)
      Fig.9	Global Gas Engine Market Share, by Power Output, 2019 & 2026 (USD Billion)
      Fig.10	Global 0.5 – 1 MW Gas Engine Market, 2016 – 2026 (USD Billion)
      Fig.11	Global 1 -2 MW  Gas Engine Market, 2016 – 2026 (USD Billion)
      Fig.12	Global 2 - 5 MW  Gas Engine Market, 2016 – 2026 (USD Billion)
      Fig.13	Global 5 - 10 MW  Gas Engine Market, 2016 – 2026 (USD Billion)
      Fig.14	Global 10 - 20 MW Gas Engine Market, 2016 – 2026 (USD Billion)
      Fig.15	Global Gas Engine Market Share, by Application, 2019 & 2026 (USD Billion)
      Fig.16	Global Power Generation Gas Engine Market, 2016 – 2026 (USD Billion)
      Fig.17	Global Mechanical Drive  Gas Engine Market, 2016 – 2026 (USD Billion)
      Fig.18	Global Cogeneration  Gas Engine Market, 2016 – 2026 (USD Billion)
      Fig.19	Global Others Gas Engine Market, 2016 – 2026 (USD Billion)
      Fig.20	Global Gas Engine Market Share, by Region, 2019 & 2026 (USD Billion)
      Fig.21	North America Gas Engine Market, 2016 – 2026 (USD Billion)
      Fig.22	U.S. Gas Engine Market, 2016 – 2026 (USD Billion)
      Fig.23	Canada Gas Engine Market, 2016 – 2026 (USD Billion)
      Fig.24	Europe Gas Engine Market, 2016 – 2026 (USD Billion)
      Fig.25	Germany Gas Engine Market, 2016 – 2026 (USD Billion)
      Fig.26	France Gas Engine Market, 2016 – 2026 (USD Billion)
      Fig.27	U.K. Gas Engine Market, 2016 – 2026 (USD Billion)
      Fig.28	Italy Gas Engine Market, 2016 – 2026 (USD Billion)
      Fig.29	Spain Gas Engine Market, 2016 – 2026 (USD Billion)
      Fig.30	Rest of Europe Gas Engine Market, 2016 – 2026 (USD Billion)
      Fig.31	Asia Pacific Gas Engine Market, 2016 – 2026 (USD Billion)
      Fig.32	China Gas Engine Market, 2016 – 2026 (USD Billion)
      Fig.33	Japan Gas Engine Market, 2016 – 2026 (USD Billion)
      Fig.34	India Gas Engine Market, 2016 – 2026 (USD Billion)
      Fig.35	South  Korea Gas Engine Market, 2016 – 2026 (USD Billion)
      Fig.36	South-East Asia Gas Engine Market, 2016 – 2026 (USD Billion)
      Fig.37	Rest of Asia Pacific Gas Engine Market, 2016 – 2026 (USD Billion)
      Fig.38	Latin America Gas Engine Market, 2016 – 2026 (USD Billion)
      Fig.39	Brazil Gas Engine Market, 2016 – 2026 (USD Billion)
      Fig.40	Mexico Gas Engine Market, 2016 – 2026 (USD Billion)
      Fig.41	Rest of Latin America Gas Engine Market, 2016 – 2026 (USD Billion)
      Fig.42	The Middle-East and Africa Gas Engine Market, 2016 – 2026 (USD Billion)
      Fig.43	GCC Countries Gas Engine Market, 2016 – 2026 (USD Billion)
      Fig.44	South Africa Gas Engine Market, 2016 – 2026 (USD Billion)
      Fig.45	Rest of Middle-East Africa Gas Engine Market, 2016 – 2026 (USD Billion)
      Fig.46	Competitor Market Share – Revenue
      Fig.47	Caterpillar Inc Revenue and Growth Rate
      Fig.48	Caterpillar Inc Market Share
      Fig.49	Cummins Inc Revenue and Growth Rate
      Fig.50	Cummins Inc Market Share
      Fig.51	Wartsila Revenue and Growth Rate
      Fig.52	Wartsila Market Share
      Fig.53	Rolls-Royce plc Revenue and Growth Rate
      Fig.54	Rolls-Royce plc Market Share
      Fig.55	INNINO Group Revenue and Growth Rate
      Fig.56	INNINO Group Market Share
      Fig.57	MAN SE Revenue and Growth Rate
      Fig.58	MAN SE Market Share
      Fig.59	Siemens Energy Revenue and Growth Rate
      Fig.60	Siemens Energy Market Share
      Fig.61	MITSUBISHI HEAVY INDUSTRIES LTD Revenue and Growth Rate
      Fig.62	MITSUBISHI HEAVY INDUSTRIES LTD Market Share
      Fig.63	Kawasaki Heavy Industries Ltd Revenue and Growth Rate
      Fig.64	Kawasaki Heavy Industries Ltd Market Share
      Fig.65	IHI Power Systems Co. Ltd Revenue and Growth Rate
      Fig.66	IHI Power Systems Co. Ltd Market Share
      Fig.67	JFE Engineering Corporation Revenue and Growth Rate
      Fig.68	JFE Engineering Corporation Market Share
      Fig.69	Hyundai Heavy Industries Co. Ltd Revenue and Growth Rate
      Fig.70	Hyundai Heavy Industries Co. Ltd Market Share
      Fig.71	Liebherr Revenue and Growth Rate
      Fig.72	Liebherr Market Share
      Fig.73	R Schmitt Enertec GmbH Revenue and Growth Rate
      Fig.74	R Schmitt Enertec GmbH Market Share
      Fig.75	Market Dynamics
      Fig.76	Global Gas Engine – Value Chain Analysis
      Fig.77	Key Mandates and Regulations
      Fig.78	Technology Roadmap and Timeline
      Fig.79	Market Attractiveness Analysis – By Product
      Fig.80	Market Attractiveness Analysis – By Power Output
      Fig.81	Market Attractiveness Analysis – By Application
      Fig.82	Market Attractiveness Analysis – By Region
      Fig.83	Gas Engine Industrial Chain Analysis
      Fig.84	Market Channels
      Fig.85	Marketing Channel Development Trend
      Fig.86	Growth in World Gross Product, 2008-2018
      

      List of Tables

      Table 1	Global Gas Engine Market, 2019 & 2026 (USD Billion)
      Table 2	Global Gas Engine Market, by Product, 2016 – 2026 (USD Billion)
      Table 3	Global Gas Engine Market, by Power Output, 2016 – 2026 (USD Billion)
      Table 4	Global Gas Engine Market, by Application, 2016 – 2026 (USD Billion)
      Table 5	Global Gas Engine Market, by Region, 2016 – 2026 (USD Billion)
      Table 6	North America Gas Engine Market, by Country, 2016 – 2026 (USD Billion)
      Table 7	North America Gas Engine Market, by Product, 2016 – 2026 (USD Billion)
      Table 8	North America Gas Engine Market, by Power Output, 2016 – 2026 (USD Billion)
      Table 9	North America Gas Engine Market, by Application, 2016 – 2026 (USD Billion)
      Table 10 Europe Gas Engine Market, by Country, 2016 – 2026 (USD Billion)
      Table 11 Europe Gas Engine Market, by Product, 2016 – 2026 (USD Billion)
      Table 12 Europe Gas Engine Market, by Power Output, 2016 – 2026 (USD Billion)
      Table 13 Europe Gas Engine Market, by Application, 2016 – 2026 (USD Billion)
      Table 14 Asia Pacific Gas Engine Market, by Country, 2016 – 2026 (USD Billion)
      Table 15 Asia Pacific Gas Engine Market, by Product, 2016 – 2026 (USD Billion)
      Table 16 Asia Pacific Gas Engine Market, by Power Output, 2016 – 2026 (USD Billion)
      Table 17 Asia Pacific Gas Engine Market, by Application, 2016 – 2026 (USD Billion)
      Table 18 Latin America Gas Engine Market, by Country, 2016 – 2026 (USD Billion)
      Table 19 Latin America Gas Engine Market, by Product, 2016 – 2026 (USD Billion)
      Table 20 Latin America Gas Engine Market, by Power Output, 2016 – 2026 (USD Billion)
      Table 21 Latin America Gas Engine Market, by Application, 2016 – 2026 (USD Billion)
      Table 22 The Middle-East and Africa Gas Engine Market, by Country, 2016 – 2026 (USD Billion)
      Table 23 The Middle-East and Africa Gas Engine Market, by Product, 2016 – 2026 (USD Billion)
      Table 24 The Middle-East and Africa Gas Engine Market, by Power Output, 2016 – 2026 (USD Billion)
      Table 25 The Middle-East and Africa Gas Engine Market, by Application, 2016 – 2026 (USD Billion)
      Table 26 Global Gas Engine Market - Company Revenue Analysis, 2016 – 2019 (USD Billion)
      Table 27 Global Gas Engine Market - Company Revenue Share Analysis, 2016 – 2019 (%)
      Table 28 Acquisitions and Mergers
      Table 29 Market Drivers – Impact Analysis
      Table 30 Market Restraints
      Table 31 Market Opportunities
      Table 32 Major Buyers of Gas Engine
      Table 33 Distributors/Traders of Gas Engine by Region
      

Industry Major Market Players

  • Caterpillar Inc.
  • Cummins Inc.
  • Wartsila
  • Rolls-Royce plc.
  • INNINO Group
  • MAN SE
  • Siemens Energy
  • MITSUBISHI HEAVY INDUSTRIES LTD.
  • Kawasaki Heavy Industries Ltd.
  • IHI Power Systems Co. Ltd.
  • JFE Engineering Corporation
  • Hyundai Heavy Industries Co. Ltd.
  • Liebherr
  • R Schmitt Enertec GmbH