Search Market Research Report

Discover Our Latest Reports
Discover Our Featured Reports
Discover Top Selling Reports

Electric Bike Market Size, Share Global Analysis Report, , 2021 – 2028

report img

Electric Bike Market by Product (Pedelecs, Speed Pedelecs, Throttle on Demand), by Drive Mechanism (Hub Motor, Mid-drive and Others), by Battery Type (Lead acid, Li ion And Others), By Region: Global & Regional Industry Perspective, Comprehensive Analysis, and Forecast, 2021 – 2028

Industry Insights

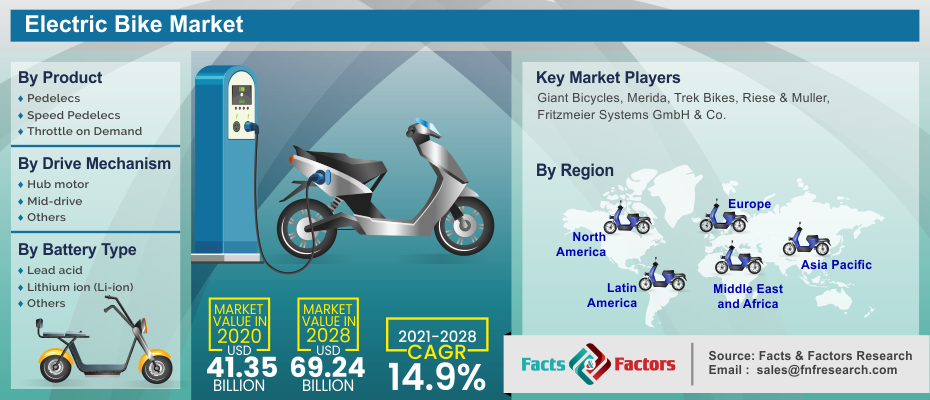
[235+ Pages Report] According to Facts and Factors, the global electric bikes market was valued at USD 41.35 Billion in 2020 and is anticipated to cross USD 69.24 Billion by the end of 2028, growing at a CAGR of 14.9% between 2021 and 2028.

logoGlobal E-Bike Market: Market Overview:

E-bikes, e-bicycles, pedelecs, and power-assisted (bi)cycles are ordinary bicycles with an electric motor, a battery, and a transmission. These bikes can either be pedaled or powered by rechargeable batteries. There are three types of rechargeable batteries: lead-acid, lithium-ion (Li-ion), and nickel-metal hydride (NiMH). The most common type of battery is lead-acid, which can travel large distances on a single charge. These bikes are easy to ride, suitable for people of all ages, and a cost-effective alternative to motorized cars as an environmentally responsible mode of transportation. Electric bicycles are a versatile, eco-friendly, and fashionable form of transportation. Consumers regard them as a viable alternative to scooters, smart cars, and public transportation.

These bikes can help with traffic congestion because of their smaller size, ability to reach higher speeds with less effort, and health advantages from pedaling. These considerations have resulted in an increase in the popularity of electric bikes around the world. There have been technological breakthroughs in the field of e-bikes as the popularity of e-bikes has grown. One such breakthrough is the linked e-bike, which uses a SIM module to send and receive data to and from the cloud without the use of a smartphone. Automatic emergency calls, integrated navigation, social media connection, an anti-theft system, and remote diagnostics are just a few of the significant features given by the linked e-bike.

logoGlobal E-Bike Market: Covid-19 Impact:

Commuters are avoiding public transit due to the COVID-19 pandemic. E-bikes are regarded as a safe, convenient, and cost-effective mode of mobility. According to industry analysts and e-bike manufacturers such as Rad Power Bike, VanMoof, and Lectric e-bike, e-bikes are becoming a more popular method of transportation as cities in the United States and Europe emerge from quarantine. Furthermore, due to government limits on public transit as a result of social-discrimination guidelines, commuters are turning to the bicycle as a form of daily mobility. However, in the first quarter of 2020, e-bike sales were hampered by the closure of e-bike retailers owing to lockdown.

logoGlobal E-Bike Market: Growth Factors

Over the projection period, factors such as rapid urbanization and traffic congestion in cities are likely to fuel demand for e-bikes. Government rules encouraging the use of electric bikes, consumer preference for e-bikes as an environmentally responsible and efficient mode of transportation, and rising gasoline prices are all factors positively impacting the market's growth.

Because of the COVID-19 epidemic, shared mobility is unlikely to be favored for transportation. E-bikes are regarded as a safe, convenient, and cost-effective mode of mobility. To relieve the strain on public transportation systems, most countries are promoting e-bikes through subsidies and legal adjustments.

E-bikes are also less expensive, easier to charge, and do not require large expenditures in supporting infrastructure when compared to other modes of mobility. As a result, there is a rise in demand for e-bikes. Cycling's growing popularity as a leisure activity is one of the key elements fuelling the industry's growth. Cycling has a number of physical and mental health benefits, including improved cardiovascular performance, muscle strength, and endurance, as well as reduced stress and depression risk. Young people are increasingly choosing adventure activities, which is fuelling the growth of the e-bike sector.

Electric Bike Market

To know more about this report | Request Free Sample Copy

logoGlobal E-Bike Market: Market Segmentation

The throttle section has the largest market share in the world. Traditional bicycles are responsible for a significant portion of air pollution. This has increased demand for low-cost, zero-emission e-bikes that are also lighter and more environmentally friendly. Governments in developing countries have established strict regulations to replace traditional bicycles by 2025. The throttle category is expected to be driven by rising gasoline prices globally as a result of the US-China trade war and customers' increased preference for e-bikes over the forecast period. Over the projected period, the pedal-assist segment is predicted to develop at a healthy rate. Pedelecs have various advantages over traditional bicycles, including increased mobility, which is beneficial for old persons while climbing hills, the ability to cover more distances in less time than standard bicycles, and the need for less effort while riding uphill or against the wind.

The majority of e-bike manufacturers in Europe and North America concentrate on mid-motor e-bikes. The mid-drive hub motor sector will dominate the hub motor position segment in 2020, as it is the best design for pedelec e-bikes and pedal-assisted e-bikes, which are widely used worldwide. There's a reason for this: producing these types of e-bikes is more profitable for them. These bikes are lighter, smaller, and can travel greater distances while using very little battery power. As a result, the mid-motor sector is expected to grow at a faster rate over the forecast period.

During the forecast period, the lithium-ion battery category is likely to dominate the market. These batteries are smaller, lighter, and have a longer range than lead-acid batteries. They can also start in harsh weather. They also necessitate less upkeep. These are some of the factors that are expected to keep this segment's dominance over the projection period. Various governments have established strict regulations for the usage of lead-acid batteries because their chemicals emit hazardous fumes that might cause major environmental problems. The emission of lead into groundwater has the potential to be harmful to human health.

logoReport Scope

Report Attribute

Details

Market Size in 2020

USD 41.35 Billion

Projected Market Size in 2028

USD 69.24 Billion

CAGR Growth Rate

14.9% CAGR

Base Year

2020

Forecast Years

2021-2028

Key Market Players

Giant Bicycles, Merida, Trek Bikes, Riese & Muller, Fritzmeier Systems GmbH & Co. Kg, and Others

Key Segment

By Product, By Drive Mechanism, By Battery Type, and By Region

Major Regions Covered

North America, Europe, Asia Pacific, Latin America, and the Middle East & Africa

Purchase Options

Request customized purchase options to meet your research needs. Explore purchase options

logoGlobal E-Bike Market: Regional Segment

The North American e-bike industry is expected to grow at a high rate between 2021 and 2028, propelled by demand from Canada and the United States. The industry's expansion in Canada is being aided by rising demand from retired clients, as well as a growing preference for leisure activities.

The European market accounts for roughly 39% of the total e-bike market. Germany was the most powerful country in Europe, followed by France and Italy. E-bikes are a popular means of transportation in Germany. In this country, e-bikes are also employed for sports and pleasure. In the country, they serve as a clean, quiet, and space-saving option for city logistics.

During the projected period, Asia Pacific is predicted to be the largest market for e-bikes. Due to rising e-bike sales in these nations, China, Japan, India, and Taiwan are prospective markets in this region. In China, the use of electric bikes has exploded in the last decade, and the industry is expected to be one of the fastest-growing marketplaces in the world, with prospects in a variety of sectors and categories.

logoGlobal E-Bike Market: Key Market Players

The e-bike market is highly fragmented, with the biggest companies accounting for only a small portion of the entire market.

some of the key market players:

  • Giant Bicycles
  • Merida
  • Trek Bikes
  • Riese & Muller
  • Fritzmeier Systems GmbH & Co. Kg 

The major company in this market is Giant Bicycles. The majority of these companies' operations are located on China, with Europe and North America serving as secondary markets. Companies are broadening their product portfolios through innovations and new launches in order to maintain their market leadership positions.

logoGlobal E-Bike Market: By Product Segment Analysis

  • Pedelecs
  • Speed Pedelecs
  • Throttle on Demand

logoGlobal E-Bike Market: By Drive Mechanism Segment Analysis

  • Hub motor
  • Mid-drive
  • Others

logoGlobal E-Bike Market: By Battery Type Segment Analysis

  • Lead acid
  • Lithium ion (Li-ion)
  • Others

logoGlobal E-Bike Market: By Region Segment Analysis

  • North America
    • The U.S.
    • Canada
  • Europe
    • France
    • The UK
    • Spain
    • Germany
    • Italy
    • Rest of Europe
  • Asia Pacific
    • China
    • Japan
    • India
    • South Korea
    • Southeast Asia
    • Rest of Asia Pacific
  • Latin America
    • Brazil
    • Mexico
    • Rest of Latin America
  • Middle East & Africa
    • GCC
    • South Africa
    • Rest of Middle East & Africa

Table of Content

  1. Chapter 1 Executive Summary
    1. 1.1. Introduction of Electric Bike
    2. 1.2. Global Electric Bike Market, 2020 & 2028 (USD Billion)
    3. 1.3. Global Electric Bike Market, 2017 – 2028 (USD Billion)
    4. 1.4. Global Electric Bike Market Absolute Revenue Opportunity, 2017 – 2028 (USD Billion)
    5. 1.5. Global Electric Bike Market Incremental Revenue Opportunity, 2020 – 2028 (USD Billion)
    6. 1.6. COVID-19 Impacts on Electric Bike Market
      1. 1.6.1. COVID-19 Impact on the Players
      2. 1.6.2. Business Strategies and Recommendations
  2. Chapter 2 Electric Bike Market – Product Analysis
    1. 2.1. Global Electric Bike Market – Product Overview
    2. 2.2. Global Electric Bike Market Share, by Product, 2020 & 2028 (USD Billion)
    3. 2.3. Pedelecs
      1. 2.3.1. Global Pedelecs Electric Bike Market, 2017 – 2028 (USD Billion)
    4. 2.4. Speed Pedelecs
      1. 2.4.1. Global Speed Pedelecs Electric Bike Market, 2017 – 2028 (USD Billion)
    5. 2.5. Throttle on Demand
      1. 2.5.1. Global Throttle on Demand Electric Bike Market, 2017 – 2028 (USD Billion)
  3. Chapter 3 Electric Bike Market – Drive Mechanism Analysis
    1. 3.1. Global Electric Bike Market – Drive Mechanism Overview
    2. 3.2. Global Electric Bike Market Share, by Drive Mechanism, 2020 & 2028 (USD Billion)
    3. 3.3. Hub Motor
      1. 3.3.1. Global Hub Motor Electric Bike Market, 2017 – 2028 (USD Billion)
    4. 3.4. Mid-Drive
      1. 3.4.1. Global Mid-Drive Electric Bike Market, 2017 – 2028 (USD Billion)
    5. 3.5. Others
      1. 3.5.1. Global Others Electric Bike Market, 2017 – 2028 (USD Billion)
  4. Chapter 4 Electric Bike Market – Battery Type Analysis
    1. 4.1. Global Electric Bike Market – Battery Type Overview
    2. 4.2. Global Electric Bike Market Share, by Battery Type, 2020 & 2028 (USD Billion)
    3. 4.3. Lead Acid
      1. 4.3.1. Global Lead Acid Electric Bike Market, 2017 – 2028 (USD Billion)
    4. 4.4. Lithium ion (Li-ion)
      1. 4.4.1. Global Lithium ion (Li-ion) Electric Bike Market, 2017 – 2028 (USD Billion)
    5. 4.5. Others
      1. 4.5.1. Global Others Electric Bike Market, 2017 – 2028 (USD Billion)
  5. Chapter 5 Electric Bike Market – Regional Analysis
    1. 5.1. Global Electric Bike Market Regional Overview
    2. 5.2. Global Electric Bike Market Share, by Region, 2020 & 2028 (USD Billion)
    3. 5.3. North America
      1. 5.3.1. North America Electric Bike Market, 2017 – 2028 (USD Billion)
        1. 5.3.1.1. North America Electric Bike Market, by Country, 2017 - 2028 (USD Billion)
      2. 5.3.2. North America Electric Bike Market, by Product, 2017 – 2028
        1. 5.3.2.1. North America Electric Bike Market, by Product, 2017 – 2028 (USD Billion)
      3. 5.3.3. North America Electric Bike Market, by Drive Mechanism, 2017 – 2028
        1. 5.3.3.1. North America Electric Bike Market, by Drive Mechanism, 2017 – 2028 (USD Billion)
      4. 5.3.4. North America Electric Bike Market, by Battery Type, 2017 – 2028
        1. 5.3.4.1. North America Electric Bike Market, by Battery Type, 2017 – 2028 (USD Billion)
      5. 5.3.5. U.S.
        1. 5.3.5.1. U.S. Electric Bike Market, 2017 – 2028 (USD Billion)
      6. 5.3.6. Canada
        1. 5.3.6.1. Canada Electric Bike Market, 2017 – 2028 (USD Billion)
    4. 5.4. Europe
      1. 5.4.1. Europe Electric Bike Market, 2017 – 2028 (USD Billion)
        1. 5.4.1.1. Europe Electric Bike Market, by Country, 2017 - 2028 (USD Billion)
      2. 5.4.2. Europe Electric Bike Market, by Product, 2017 – 2028
        1. 5.4.2.1. Europe Electric Bike Market, by Product, 2017 – 2028 (USD Billion)
      3. 5.4.3. Europe Electric Bike Market, by Drive Mechanism, 2017 – 2028
        1. 5.4.3.1. Europe Electric Bike Market, by Drive Mechanism, 2017 – 2028 (USD Billion)
      4. 5.4.4. Europe Electric Bike Market, by Battery Type, 2017 – 2028
        1. 5.4.4.1. Europe Electric Bike Market, by Battery Type, 2017 – 2028 (USD Billion)
      5. 5.4.5. Germany
        1. 5.4.5.1. Germany Electric Bike Market, 2017 – 2028 (USD Billion)
      6. 5.4.6. France
        1. 5.4.6.1. France Electric Bike Market, 2017 – 2028 (USD Billion)
      7. 5.4.7. U.K.
        1. 5.4.7.1. U.K. Electric Bike Market, 2017 – 2028 (USD Billion)
      8. 5.4.8. Italy
        1. 5.4.8.1. Italy Electric Bike Market, 2017 – 2028 (USD Billion)
      9. 5.4.9. Spain
        1. 5.4.9.1. Spain Electric Bike Market, 2017 – 2028 (USD Billion)
      10. 5.4.10. Rest of Europe
        1. 5.4.10.1. Rest of Europe Electric Bike Market, 2017 – 2028 (USD Billion)
    5. 5.5. Asia Pacific
      1. 5.5.1. Asia Pacific Electric Bike Market, 2017 – 2028 (USD Billion)
        1. 5.5.1.1. Asia Pacific Electric Bike Market, by Country, 2017 - 2028 (USD Billion)
      2. 5.5.2. Asia Pacific Electric Bike Market, by Product, 2017 – 2028
        1. 5.5.2.1. Asia Pacific Electric Bike Market, by Product, 2017 – 2028 (USD Billion)
      3. 5.5.3. Asia Pacific Electric Bike Market, by Drive Mechanism, 2017 – 2028
        1. 5.5.3.1. Asia Pacific Electric Bike Market, by Drive Mechanism, 2017 – 2028 (USD Billion)
      4. 5.5.4. Asia Pacific Electric Bike Market, by Battery Type, 2017 – 2028
        1. 5.5.4.1. Asia Pacific Electric Bike Market, by Battery Type, 2017 – 2028 (USD Billion)
      5. 5.5.5. China
        1. 5.5.5.1. China Electric Bike Market, 2017 – 2028 (USD Billion)
      6. 5.5.6. Japan
        1. 5.5.6.1. Japan Electric Bike Market, 2017 – 2028 (USD Billion)
      7. 5.5.7. India
        1. 5.5.7.1. India Electric Bike Market, 2017 – 2028 (USD Billion)
      8. 5.5.8. South Korea
        1. 5.5.8.1. South Korea Electric Bike Market, 2017 – 2028 (USD Billion)
      9. 5.5.9. South-East Asia
        1. 5.5.9.1. South-East Asia Electric Bike Market, 2017 – 2028 (USD Billion)
      10. 5.5.10. Rest of Asia Pacific
        1. 5.5.10.1. Rest of Asia Pacific Electric Bike Market, 2017 – 2028 (USD Billion)
    6. 5.6. Latin America
      1. 5.6.1. Latin America Electric Bike Market, 2017 – 2028 (USD Billion)
        1. 5.6.1.1. Latin America Electric Bike Market, by Country, 2017 - 2028 (USD Billion)
      2. 5.6.2. Latin America Electric Bike Market, by Product, 2017 – 2028
        1. 5.6.2.1. Latin America Electric Bike Market, by Product, 2017 – 2028 (USD Billion)
      3. 5.6.3. Latin America Electric Bike Market, by Drive Mechanism, 2017 – 2028
        1. 5.6.3.1. Latin America Electric Bike Market, by Drive Mechanism, 2017 – 2028 (USD Billion)
      4. 5.6.4. Latin America Electric Bike Market, by Battery Type, 2017 – 2028
        1. 5.6.4.1. Latin America Electric Bike Market, by Battery Type, 2017 – 2028 (USD Billion)
      5. 5.6.5. Brazil
        1. 5.6.5.1. Brazil Electric Bike Market, 2017 – 2028 (USD Billion)
      6. 5.6.6. Mexico
        1. 5.6.6.1. Mexico Electric Bike Market, 2017 – 2028 (USD Billion)
      7. 5.6.7. Rest of Latin America
        1. 5.6.7.1. Rest of Latin America Electric Bike Market, 2017 – 2028 (USD Billion)
    7. 5.7. The Middle-East and Africa
      1. 5.7.1. The Middle-East and Africa Electric Bike Market, 2017 – 2028 (USD Billion)
        1. 5.7.1.1. The Middle-East and Africa Electric Bike Market, by Country, 2017 - 2028 (USD Billion)
      2. 5.7.2. The Middle-East and Africa Electric Bike Market, by Product, 2017 – 2028
        1. 5.7.2.1. The Middle-East and Africa Electric Bike Market, by Product, 2017 – 2028 (USD Billion)
      3. 5.7.3. The Middle-East and Africa Electric Bike Market, by Drive Mechanism, 2017 – 2028
        1. 5.7.3.1. The Middle-East and Africa Electric Bike Market, by Drive Mechanism, 2017 – 2028 (USD Billion)
      4. 5.7.4. The Middle-East and Africa Electric Bike Market, by Battery Type, 2017 – 2028
        1. 5.7.4.1. The Middle-East and Africa Electric Bike Market, by Battery Type, 2017 – 2028 (USD Billion)
      5. 5.7.5. GCC Countries
        1. 5.7.5.1. GCC Countries Electric Bike Market, 2017 – 2028 (USD Billion)
      6. 5.7.6. South Africa
        1. 5.7.6.1. South Africa Electric Bike Market, 2017 – 2028 (USD Billion)
      7. 5.7.7. Rest of Middle-East Africa
        1. 5.7.7.1. Rest of Middle-East Africa Electric Bike Market, 2017 – 2028 (USD Billion)
  6. Chapter 6 Electric Bike Market – Competitive Landscape
    1. 6.1. Competitor Market Share – Revenue
    2. 6.2. Market Concentration Rate Analysis, Top 3 and Top 5 Players
    3. 6.3. Strategic Developments
      1. 6.3.1. Acquisitions and Mergers
      2. 6.3.2. New Products
      3. 6.3.3. Research & Development Activities
  7. Chapter 7 Company Profiles
    1. 7.1. Giant Bicycles
      1. 7.1.1. Company Overview
      2. 7.1.2. Product/Service Portfolio
      3. 7.1.3. Giant Bicycles Sales, Revenue, and Gross Margin
      4. 7.1.4. Giant Bicycles Revenue and Growth Rate
      5. 7.1.5. Giant Bicycles Market Share
      6. 7.1.6. Recent Initiatives, Funding/VC Activities, and Technological Innovations
    2. 7.2. Merida
      1. 7.2.1. Company Overview
      2. 7.2.2. Product/Service Portfolio
      3. 7.2.3. Merida Sales, Revenue, and Gross Margin
      4. 7.2.4. Merida Revenue and Growth Rate
      5. 7.2.5. Merida Market Share
      6. 7.2.6. Recent Initiatives, Funding/VC Activities, and Technological Innovations
    3. 7.3. Trek Bikes
      1. 7.3.1. Company Overview
      2. 7.3.2. Product/Service Portfolio
      3. 7.3.3. Trek Bikes Sales, Revenue, and Gross Margin
      4. 7.3.4. Trek Bikes Revenue and Growth Rate
      5. 7.3.5. Trek Bikes Market Share
      6. 7.3.6. Recent Initiatives, Funding/VC Activities, and Technological Innovations
    4. 7.4. Riese & Muller
      1. 7.4.1. Company Overview
      2. 7.4.2. Product/Service Portfolio
      3. 7.4.3. Riese & Muller Sales, Revenue, and Gross Margin
      4. 7.4.4. Riese & Muller Revenue and Growth Rate
      5. 7.4.5. Riese & Muller Market Share
      6. 7.4.6. Recent Initiatives, Funding/VC Activities, and Technological Innovations
    5. 7.5. Fritzmeier Systems GmbH & Co. Kg
      1. 7.5.1. Company Overview
      2. 7.5.2. Product/Service Portfolio
      3. 7.5.3. Fritzmeier Systems GmbH & Co. Kg Sales, Revenue, and Gross Margin
      4. 7.5.4. Fritzmeier Systems GmbH & Co. Kg Revenue and Growth Rate
      5. 7.5.5. Fritzmeier Systems GmbH & Co. Kg Market Share
      6. 7.5.6. Recent Initiatives, Funding/VC Activities, and Technological Innovations
    6. 7.6. Accell Group
      1. 7.6.1. Company Overview
      2. 7.6.2. Product/Service Portfolio
      3. 7.6.3. Accell Group Sales, Revenue, and Gross Margin
      4. 7.6.4. Accell Group Revenue and Growth Rate
      5. 7.6.5. Accell Group Market Share
      6. 7.6.6. Recent Initiatives, Funding/VC Activities, and Technological Innovations
    7. 7.7. Derby Cycle
      1. 7.7.1. Company Overview
      2. 7.7.2. Product/Service Portfolio
      3. 7.7.3. Derby Cycle Sales, Revenue, and Gross Margin
      4. 7.7.4. Derby Cycle Revenue and Growth Rate
      5. 7.7.5. Derby Cycle Market Share
      6. 7.7.6. Recent Initiatives, Funding/VC Activities, and Technological Innovations
    8. 7.8. Fuji-ta Bicycle Co., Ltd.
      1. 7.8.1. Company Overview
      2. 7.8.2. Product/Service Portfolio
      3. 7.8.3. Fuji-ta Bicycle Co., Ltd. Sales, Revenue, and Gross Margin
      4. 7.8.4. Fuji-ta Bicycle Co., Ltd. Revenue and Growth Rate
      5. 7.8.5. Fuji-ta Bicycle Co., Ltd. Market Share
      6. 7.8.6. Recent Initiatives, Funding/VC Activities, and Technological Innovations
    9. 7.9. Jiangsu Xinri E-Vehicle Co., Ltd.
      1. 7.9.1. Company Overview
      2. 7.9.2. Product/Service Portfolio
      3. 7.9.3. Jiangsu Xinri E-Vehicle Co., Ltd. Sales, Revenue, and Gross Margin
      4. 7.9.4. Jiangsu Xinri E-Vehicle Co., Ltd. Revenue and Growth Rate
      5. 7.9.5. Jiangsu Xinri E-Vehicle Co., Ltd. Market Share
      6. 7.9.6. Recent Initiatives, Funding/VC Activities, and Technological Innovations
    10. 7.10. Mahindra & Mahindra Ltd.
      1. 7.10.1. Company Overview
      2. 7.10.2. Product/Service Portfolio
      3. 7.10.3. Mahindra & Mahindra Ltd. Sales, Revenue, and Gross Margin
      4. 7.10.4. Mahindra & Mahindra Ltd. Revenue and Growth Rate
      5. 7.10.5. Mahindra & Mahindra Ltd. Market Share
      6. 7.10.6. Recent Initiatives, Funding/VC Activities, and Technological Innovations
    11. 7.11. Prodecotech, LLC,
      1. 7.11.1. Company Overview
      2. 7.11.2. Product/Service Portfolio
      3. 7.11.3. Prodecotech, LLC, Sales, Revenue, and Gross Margin
      4. 7.11.4. Prodecotech, LLC, Revenue and Growth Rate
      5. 7.11.5. Prodecotech, LLC, Market Share
      6. 7.11.6. Recent Initiatives, Funding/VC Activities, and Technological Innovations
    12. 7.12. Tianjin Golden Wheel Group Co., Ltd.
      1. 7.12.1. Company Overview
      2. 7.12.2. Product/Service Portfolio
      3. 7.12.3. Tianjin Golden Wheel Group Co., Ltd. Sales, Revenue, and Gross Margin
      4. 7.12.4. Tianjin Golden Wheel Group Co., Ltd. Revenue and Growth Rate
      5. 7.12.5. Tianjin Golden Wheel Group Co., Ltd. Market Share
      6. 7.12.6. Recent Initiatives, Funding/VC Activities, and Technological Innovations
    13. 7.13. Yamaha Motor Co., Ltd
      1. 7.13.1. Company Overview
      2. 7.13.2. Product/Service Portfolio
      3. 7.13.3. Yamaha Motor Co., Ltd Sales, Revenue, and Gross Margin
      4. 7.13.4. Yamaha Motor Co., Ltd Revenue and Growth Rate
      5. 7.13.5. Yamaha Motor Co., Ltd Market Share
      6. 7.13.6. Recent Initiatives, Funding/VC Activities, and Technological Innovations
  8. Chapter 8 Electric Bike — Industry Analysis
    1. 8.1. Introduction and Taxonomy
    2. 8.2. Electric Bike Market – Key Trends
      1. 8.2.1. Market Drivers
      2. 8.2.2. Market Restraints
      3. 8.2.3. Market Opportunities
    3. 8.3. Value Chain Analysis
    4. 8.4. Key Mandates and Regulations
    5. 8.5. Technology Roadmap and Timeline
    6. 8.6. Electric Bike Market – Attractiveness Analysis
      1. 8.6.1. By Product
      2. 8.6.2. By Drive Mechanism
      3. 8.6.3. By Battery Type
      4. 8.6.4. By Region
  9. Chapter 9 Industrial Chain, Sourcing Strategy, and Downstream Buyers
    1. 9.1. Electric Bike Industrial Chain Analysis
    2. 9.2. Downstream Buyers
    3. 9.3. Distributors/Traders List
  10. Chapter 10 Marketing Strategy Analysis
    1. 10.1. Marketing Channel
    2. 10.2. Direct Marketing
    3. 10.3. Indirect Marketing
    4. 10.4. Marketing Channel Development Trends
    5. 10.5. Economic/Political Environmental Change
  11. Chapter 11 Report Conclusion & Key Insights
    1. 11.1. Key Insights from Primary Interviews & Surveys Respondents
    2. 11.2. Key Takeaways from Analysts, Consultants, and Industry Leaders
  12. Chapter 12 Research Approach & Methodology
    1. 12.1. Report Description
    2. 12.2. Research Scope
    3. 12.3. Research Methodology
      1. 12.3.1. Secondary Research
      2. 12.3.2. Primary Research
      3. 12.3.3. Statistical Models
        1. 12.3.3.1. Company Share Analysis Model
        2. 12.3.3.2. Revenue Based Modeling
      4. 12.3.4. Research Limitations

      List of Figures

      Fig.1	Product Picture of Electric Bike
      Fig.2	Global Electric Bike Market, 2017 – 2028 (USD Billion)
      Fig.3	Global Electric Bike Market Absolute Revenue Opportunity, 2017 – 2028 (USD Billion)
      Fig.4	Global Electric Bike Market Incremental Revenue Opportunity, 2020 – 2028 (USD Billion)
      Fig.5	COVID-19 Impacts on Electric Bike Market
      Fig.6	COVID-19 Impact on the Players
      Fig.7	Business Strategies and Recommendations
      Fig.8	Global Electric Bike Market Share, by Product, 2020 & 2028 (USD Billion)
      Fig.9	Global Pedelecs Electric Bike Market, 2017 – 2028 (USD Billion)
      Fig.10	Global Speed Pedelecs Electric Bike Market, 2017 – 2028 (USD Billion)
      Fig.11	Global Throttle on Demand Electric Bike Market, 2017 – 2028 (USD Billion)
      Fig.12	Global Electric Bike Market Share, by Drive Mechanism, 2020 & 2028 (USD Billion)
      Fig.13	Global Hub Motor Electric Bike Market, 2017 – 2028 (USD Billion)
      Fig.14	Global Mid-Drive Electric Bike Market, 2017 – 2028 (USD Billion)
      Fig.15	Global Others Electric Bike Market, 2017 – 2028 (USD Billion)
      Fig.16	Global Electric Bike Market Share, by Battery Type, 2020 & 2028 (USD Billion)
      Fig.17	Global Lead Acid Electric Bike Market, 2017 – 2028 (USD Billion)
      Fig.18	Global Lithium ion (Li-ion) Electric Bike Market, 2017 – 2028 (USD Billion)
      Fig.19	Global Others Electric Bike Market, 2017 – 2028 (USD Billion)
      Fig.20	Global Electric Bike Market Share, by Region, 2020 & 2028 (USD Billion)
      Fig.21	North America Electric Bike Market, 2017 – 2028 (USD Billion)
      Fig.22	U.S. Electric Bike Market, 2017 – 2028 (USD Billion)
      Fig.23	Canada Electric Bike Market, 2017 – 2028 (USD Billion)
      Fig.24	Europe Electric Bike Market, 2017 – 2028 (USD Billion)
      Fig.25	Germany Electric Bike Market, 2017 – 2028 (USD Billion)
      Fig.26	France Electric Bike Market, 2017 – 2028 (USD Billion)
      Fig.27	U.K. Electric Bike Market, 2017 – 2028 (USD Billion)
      Fig.28	Italy Electric Bike Market, 2017 – 2028 (USD Billion)
      Fig.29	Spain Electric Bike Market, 2017 – 2028 (USD Billion)
      Fig.30	Rest of Europe Electric Bike Market, 2017 – 2028 (USD Billion)
      Fig.31	Asia Pacific Electric Bike Market, 2017 – 2028 (USD Billion)
      Fig.32	China Electric Bike Market, 2017 – 2028 (USD Billion)
      Fig.33	Japan Electric Bike Market, 2017 – 2028 (USD Billion)
      Fig.34	India Electric Bike Market, 2017 – 2028 (USD Billion)
      Fig.35	South  Korea Electric Bike Market, 2017 – 2028 (USD Billion)
      Fig.36	South-East Asia Electric Bike Market, 2017 – 2028 (USD Billion)
      Fig.37	Rest of Asia Pacific Electric Bike Market, 2017 – 2028 (USD Billion)
      Fig.38	Latin America Electric Bike Market, 2017 – 2028 (USD Billion)
      Fig.39	Brazil Electric Bike Market, 2017 – 2028 (USD Billion)
      Fig.40	Mexico Electric Bike Market, 2017 – 2028 (USD Billion)
      Fig.41	Rest of Latin America Electric Bike Market, 2017 – 2028 (USD Billion)
      Fig.42	The Middle-East and Africa Electric Bike Market, 2017 – 2028 (USD Billion)
      Fig.43	GCC Countries Electric Bike Market, 2017 – 2028 (USD Billion)
      Fig.44	South Africa Electric Bike Market, 2017 – 2028 (USD Billion)
      Fig.45	Rest of Middle-East Africa Electric Bike Market, 2017 – 2028 (USD Billion)
      Fig.46	Competitor Market Share – Revenue
      Fig.47	Giant Bicycles Revenue and Growth Rate
      Fig.48	Giant Bicycles Market Share
      Fig.49	Merida Revenue and Growth Rate
      Fig.50	Merida Market Share
      Fig.51	Trek Bikes Revenue and Growth Rate
      Fig.52	Trek Bikes Market Share
      Fig.53	Riese & Muller Revenue and Growth Rate
      Fig.54	Riese & Muller Market Share
      Fig.55	Fritzmeier Systems GmbH & Co. Kg Revenue and Growth Rate
      Fig.56	Fritzmeier Systems GmbH & Co. Kg Market Share
      Fig.57	Accell Group Revenue and Growth Rate
      Fig.58	Accell Group Market Share
      Fig.59	Derby Cycle Revenue and Growth Rate
      Fig.60	Derby Cycle Market Share
      Fig.61	Fuji-ta Bicycle Co., Ltd. Revenue and Growth Rate
      Fig.62	Fuji-ta Bicycle Co., Ltd. Market Share
      Fig.63	Jiangsu Xinri E-Vehicle Co., Ltd. Revenue and Growth Rate
      Fig.64	Jiangsu Xinri E-Vehicle Co., Ltd. Market Share
      Fig.65	Mahindra & Mahindra Ltd. Revenue and Growth Rate
      Fig.66	Mahindra & Mahindra Ltd. Market Share
      Fig.67	Prodecotech, LLC, Revenue and Growth Rate
      Fig.68	Prodecotech, LLC, Market Share
      Fig.69	Tianjin Golden Wheel Group Co., Ltd. Revenue and Growth Rate
      Fig.70	Tianjin Golden Wheel Group Co., Ltd. Market Share
      Fig.71	Yamaha Motor Co., Ltd Revenue and Growth Rate
      Fig.72	Yamaha Motor Co., Ltd Market Share
      Fig.73	Market Dynamics
      Fig.74	Global Electric Bike – Value Chain Analysis
      Fig.75	Key Mandates and Regulations
      Fig.76	Technology Roadmap and Timeline
      Fig.77	Market Attractiveness Analysis – By Product
      Fig.78	Market Attractiveness Analysis – By Drive Mechanism
      Fig.79	Market Attractiveness Analysis – By Battery Type
      Fig.80	Market Attractiveness Analysis – By Region
      Fig.81	Electric Bike Industrial Chain Analysis
      Fig.82	Market Channels
      Fig.83	Marketing Channel Development Trend
      Fig.84	Growth in World Gross Product, 2008-2018
      

      List of Tables

      	
      Table 1	Global Electric Bike Market, 2020 & 2028 (USD Billion)
      Table 2	Global Electric Bike Market, by Product, 2017 – 2028 (USD Billion)
      Table 3	Global Electric Bike Market, by Drive Mechanism, 2017 – 2028 (USD Billion)
      Table 4	Global Electric Bike Market, by Battery Type, 2017 – 2028 (USD Billion)
      Table 5	Global Electric Bike Market, by Region, 2017 – 2028 (USD Billion)
      Table 6	North America Electric Bike Market, by Country, 2017 – 2028 (USD Billion)
      Table 7	North America Electric Bike Market, by Product, 2017 – 2028 (USD Billion)
      Table 8	North America Electric Bike Market, by Drive Mechanism, 2017 – 2028 (USD Billion)
      Table 9 North America Electric Bike Market, by Battery Type, 2017 – 2028 (USD Billion)
      Table 10 Europe Electric Bike Market, by Country, 2017 – 2028 (USD Billion)
      Table 11 Europe Electric Bike Market, by Product, 2017 – 2028 (USD Billion)
      Table 12 Europe Electric Bike Market, by Drive Mechanism, 2017 – 2028 (USD Billion)
      Table 13 Europe Electric Bike Market, by Battery Type, 2017 – 2028 (USD Billion)
      Table 14 Asia Pacific Electric Bike Market, by Country, 2017 – 2028 (USD Billion)
      Table 15 Asia Pacific Electric Bike Market, by Product, 2017 – 2028 (USD Billion)
      Table 16 Asia Pacific Electric Bike Market, by Drive Mechanism, 2017 – 2028 (USD Billion)
      Table 17 Asia Pacific Electric Bike Market, by Battery Type, 2017 – 2028 (USD Billion)
      Table 18 Latin America Electric Bike Market, by Country, 2017 – 2028 (USD Billion)
      Table 19 Latin America Electric Bike Market, by Product, 2017 – 2028 (USD Billion)
      Table 20 Latin America Electric Bike Market, by Drive Mechanism, 2017 – 2028 (USD Billion)
      Table 21 Latin America Electric Bike Market, by Battery Type, 2017 – 2028 (USD Billion)
      Table 22 The Middle-East and Africa Electric Bike Market, by Country, 2017 – 2028 (USD Billion)
      Table 23 The Middle-East and Africa Electric Bike Market, by Product, 2017 – 2028 (USD Billion)
      Table 24 The Middle-East and Africa Electric Bike Market, by Drive Mechanism, 2017 – 2028 (USD Billion)
      Table 25 The Middle-East and Africa Electric Bike Market, by Battery Type, 2017 – 2028 (USD Billion)
      Table 26 Global Electric Bike Market - Company Revenue Analysis, 2017 – 2019 (USD Billion)
      Table 27 Global Electric Bike Market - Company Revenue Share Analysis, 2017 – 2019 (%)
      Table 28 Acquisitions and Mergers
      Table 29 Market Drivers – Impact Analysis
      Table 30 Market Restraints
      Table 31 Market Opportunities
      Table 32 Major Buyers of Electric Bike
      Table 33 Distributors/Traders of Electric Bike by Region
      

Industry Major Market Players

  • Giant Bicycles
  • Merida
  • Trek Bikes
  • Riese & Muller
  • Fritzmeier Systems GmbH & Co. Kg