Search Market Research Report

Discover Our Latest Reports
Discover Our Featured Reports
Discover Top Selling Reports

CBD-Infused Beverages Market Size, Share & Growth Analysis Forecast 2022-2028

report img

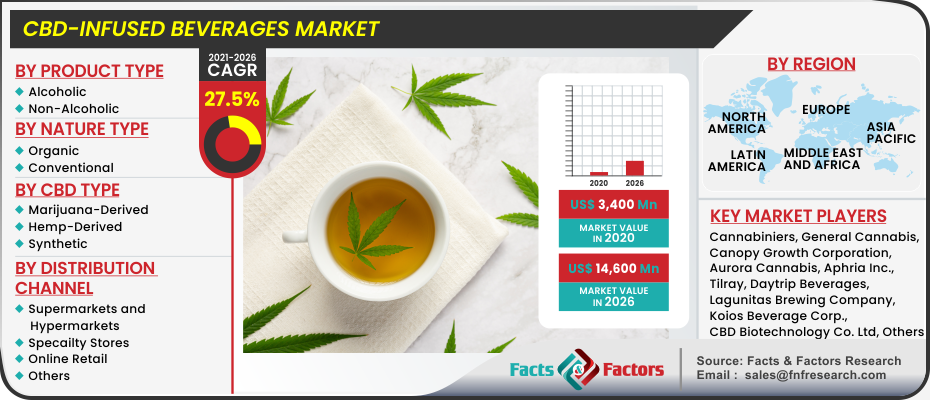
CBD-Infused Beverages Market by Product Type (Alcoholic and Non-Alcoholic), By Nature Type (Organic and Conventional), By CBD Type (Marijuana-Derived, Hemp-Derived, and Synthetic), By Distribution Channel (Supermarkets and Hypermarkets, Specialty Stores, Online Retail, and Others) By Region: Global and Regional Industry Perspective, Comprehensive Analysis, and Forecast 2021 – 2026

Industry Insights

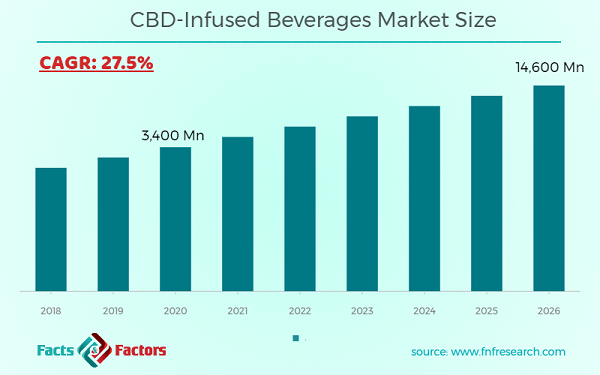
[194+ Pages Report] According to the report published by Facts and Factors, the global CBD-infused beverage market size was valued around USD 3,400 million in 2020 and is expected to grow to around USD 14,600 million by 2026 with a compound annual growth rate (CAGR) of roughly 27.5% between 2021 and 2026. The report analyzes the global CBD-infused beverage market drivers, challenges, and the impact they have on the demands during the forecast period. In addition, the report explores emerging opportunities in the CBD-infused beverage market.

CBD-Infused Beverages Market Size

To know more about this report | Request Free Sample Copy

logoMarket Overview

CBD is the abbreviation for cannabidiol. It's the second most common active component in cannabis (marijuana). CBD is extracted directly from the hemp plant, which is a relative of the marijuana plant and is an important component of medicinal marijuana. Despite the fact that CBD is a component of marijuana, it has no hallucinogenic effects on the human mind. "In people, CBD displays no effects suggestive of any misuse or dependency potential," according to a World Health Organization report. To date, there has been no evidence of public health issues linked to the use of pure CBD and its derivatives.

Water is injected with CBD particles to create CBD-infused beverages. The end product is a canned, usually sparkling beverage that tastes like flavored sparkling water or spiked seltzer. There are some “CBD-only” drinks on the market, but finding one without a trace of THC can be difficult. This is due to the difficulty of extracting pure CBD from cannabis plants without some THC remaining. CBD beverages are becoming more popular as cannabis-infused goods, such as medicinal and recreational marijuana, become legalized across the United States and around the world. CBD's appeal has been fuelled by its expanding availability combined with a growing health trend, with more and more people opting for "better-for-you" alternatives to sugary drinks. CBD-infused drinks of various types provide a great alternative, with health advantages to boot, because CBD beverages are sourced from a natural source.

CBD-Infused Beverages Market

To know more about this report | Request Free Sample Copy

logoIndustry Growth Factors

The market for CBD-infused drinks is largely driven by the rising authorization and certification for recreational cannabis in countries, such as the United States and Canada. Furthermore, because of the increasing incidence of numerous respiratory disorders, there is a growing movement away from smoking cannabis and adopting healthier edible options, which is pushing the market growth. Furthermore, the common accessibility of CBD-infused drinks such as coffee, fruit punch, cannabis cola tea, and other CBD-infused beverages across various legal marijuana outlets further augments the global industry.

Several key players manufacturing CBD-infused beverages also prefer investing in developing newly flavored beverages. For instance, in June 2018,  US craft brewer Lagunitas, a subsidiary of Heineken, launched a 5mg CBD-infused beverage named a Hi-Fi Hops. The company aimed at providing a no-calorie beverage infused with cannabis as a new innovative product for the company’s growth in the future.

Aside from that, the rising usage of CBD-infused drinks in cancer patients to treat nausea, weight loss, and poor appetite is fueling market expansion. Furthermore, its growing popularity as a functional drink among athletes and sportspeople has resulted in increased product demand in the sports nutrition industry. Numerous advancements in cannabis microdosing have resulted in the creation of alcohol-free beer produced from CBD, which is likely to fuel market expansion.

However, the market is expected to be hampered by stringent regulation and a lengthy approval procedure for CBD products, as well as severe negative effects associated with CBD intake. Nevertheless, the growing prevalence of the consumers towards organically sourced CBD usage in the beverages provides lucrative market growth opportunities for the market.

logoSegmentation Analysis

The global market is segregated based on product type, nature type, CBD type, distribution channel, and region

Based on type, the CBD-infused beverage market is divided into non-alcoholic and alcoholic categories. The market is increasing as more businesses enter the alcohol brewing industry to infuse the beer with CBD. People who utilize cannabis and alcoholic beverages are also contributing to the rise. Furthermore, the rising desire for spirits and beer among cannabis consumers is expected to boost product demand in the coming years.

logo Report Scope

Report Attribute

Details

Market Size in 2020

USD 3,400 Million

Projected Market Size in 2026

USD 14,600 Million

CAGR Growth Rate

27.5% CAGR

Base Year

2020

Forecast Years

2021-2026

Key Market Players

Cannabiniers, General Cannabis, Canopy Growth Corporation, Aurora Cannabis, Aphria Inc., Tilray, Daytrip Beverages, Lagunitas Brewing Company, Koios Beverage Corp., CBD Biotechnology Co. Ltd, G&Juice, K-Zen Beverages Inc., NewAge Inc., Alkaline88, LLC, Phivida Holdings Inc., CANNABIS SATIVA, INC, Puration and Honeydrop Beverages amongst others.

Key Segment

By Product Type, By Nature Type, By CBD Type, By Distribution Channel, and By Region

Major Regions Covered

North America, Europe, Asia Pacific, Latin America, and the Middle East & Africa

Purchase Options

Request customized purchase options to meet your research needs. Explore purchase options

logo Regional Analysis

North America, followed by Europe, accounted for the biggest proportion of the market in 2020. The easy accessibility of cannabis as per the requirement, technological advancements in the production of CBD-infused drinks, availability of CBD consumers along with their growing perception toward CBD consumption for numerous health benefits, and increasing investments from leading players are all factors that contribute to this region's large share.

The second-largest market for CBD-infused beverages in Europe as the number of people willing to experience CBD-infused drinks is surging and manufacturers are also fulfilling the growing demand by introducing new flavored CBD-infused beverages. For instance, in November 2019 Endo Sport entered the CBD market by launching the UK’s first CBD-infused sports drink with two flavors: berry and orange consisting of 10mg CBD per 500ml bottle. The company claimed that their drink would help in muscle recovery and improve sleep aid. These drinks were made available by the brand in local convenience stores.

logo Competitive Players

Some main participants of the global CBD-infused beverages industry are :

  • Cannabiniers
  • General Cannabis
  • Canopy Growth Corporation
  • Aurora Cannabis
  • Aphria Inc.
  • Tilray
  • Daytrip Beverages
  • Lagunitas Brewing Company
  • Koios Beverage Corp.
  • CBD Biotechnology Co. Ltd
  • G&Juice
  • K-Zen Beverages Inc.
  • NewAge Inc.
  • Alkaline88 LLC
  • Phivida Holdings Inc.
  • CANNABIS SATIVA INC
  • Puration
  • Honeydrop Beverages

logo By Product Type Segment Analysis

  • Alcoholic
  • Non-Alcoholic

logo By Nature Type Segment Analysis

  • Organic
  • Conventional

logo By CBD Type Segment Analysis

  • Marijuana-Derived
  • Hemp-Derived
  • Synthetic

logo By Distribution Channel Segment Analysis

  • Supermarkets and Hypermarkets
  • Specailty Stores
  • Online Retail
  • Others

logo By Regional Segment Analysis

  • North America
    • The U.S.
    • Canada
  • Europe
    • France
    • The UK
    • Spain
    • Germany
    • Italy
    • Rest of Europe
  • Asia Pacific
    • China
    • Japan
    • India
    • South Korea
    • Southeast Asia
    • Rest of Asia Pacific
  • Latin America
    • Brazil
    • Mexico
    • Rest of Latin America
  • Middle East & Africa
    • GCC Countries
    • South Africa
    • Rest of Middle East & Africa

Table of Content

  1. Chapter 1 Executive Summary
    1. 1.1. Introduction of CBD-Infused Beverages
    2. 1.2. Global CBD-Infused Beverages Market, 2020 & 2026 (USD Million)
    3. 1.3. Global CBD-Infused Beverages Market, 2016 – 2026 (USD Million)
    4. 1.4. Global CBD-Infused Beverages Market Absolute Revenue Opportunity, 2016 – 2026 (USD Million)
    5. 1.5. Global CBD-Infused Beverages Market Incremental Revenue Opportunity, 2020 – 2026 (USD Million)
  2. Chapter 2 CBD-Infused Beverages Market – Product Type Analysis
    1. 2.1. Global CBD-Infused Beverages Market – Product Type Overview
    2. 2.2. Global CBD-Infused Beverages Market Share, by Product Type, 2020 & 2026 (USD Million)
    3. 2.3. Alcoholic
      1. 2.3.1. Global Alcoholic CBD-Infused Beverages Market, 2016 – 2026 (USD Million)
    4. 2.4. Non-Alcoholic
      1. 2.4.1. Global Non-Alcoholic CBD-Infused Beverages Market, 2016 – 2026 (USD Million)
  3. Chapter 3 CBD-Infused Beverages Market – Nature Type Analysis
    1. 3.1. Global CBD-Infused Beverages Market – Nature Type Overview
    2. 3.2. Global CBD-Infused Beverages Market Share, by Nature Type, 2020 & 2026 (USD Million)
    3. 3.3. Organic
      1. 3.3.1. Global Organic CBD-Infused Beverages Market, 2016 – 2026 (USD Million)
    4. 3.4. Conventional
      1. 3.4.1. Global Conventional CBD-Infused Beverages Market, 2016 – 2026 (USD Million)
  4. Chapter 4 CBD-Infused Beverages Market – CBD Type Analysis
    1. 4.1. Global CBD-Infused Beverages Market – CBD Type Overview
    2. 4.2. Global CBD-Infused Beverages Market Share, by CBD Type, 2020 & 2026 (USD Million)
    3. 4.3. Marijuana-Derived
      1. 4.3.1. Global Marijuana-Derived CBD-Infused Beverages Market, 2016 – 2026 (USD Million)
    4. 4.4. Hemp-Derived
      1. 4.4.1. Global Hemp-Derived CBD-Infused Beverages Market, 2016 – 2026 (USD Million)
    5. 4.5. Synthetic
      1. 4.5.1. Global Synthetic CBD-Infused Beverages Market, 2016 – 2026 (USD Million)
  5. Chapter 5 CBD-Infused Beverages Market – Distribution Channel Analysis
    1. 5.1. Global CBD-Infused Beverages Market – Distribution Channel Overview
    2. 5.2. Global CBD-Infused Beverages Market Share, by Distribution Channel, 2020 & 2026 (USD Million)
    3. 5.3. Supermarkets and Hypermarkets
      1. 5.3.1. Global Supermarkets and Hypermarkets CBD-Infused Beverages Market, 2016 – 2026 (USD Million)
    4. 5.4. Specialty Stores
      1. 5.4.1. Global Specialty Stores CBD-Infused Beverages Market, 2016 – 2026 (USD Million)
    5. 5.5. Online Retail
      1. 5.5.1. Global Online Retail CBD-Infused Beverages Market, 2016 – 2026 (USD Million)
    6. 5.6. Others
      1. 5.6.1. Global Others CBD-Infused Beverages Market, 2016 – 2026 (USD Million)
  6. Chapter 6 CBD-Infused Beverages Market – Regional Analysis
    1. 6.1. Global CBD-Infused Beverages Market Regional Overview
    2. 6.2. Global CBD-Infused Beverages Market Share, by Region, 2020 & 2026 (USD Million)
    3. 6.3. North America
      1. 6.3.1. North America CBD-Infused Beverages Market, 2016 – 2026 (USD Million)
        1. 6.3.1.1. North America CBD-Infused Beverages Market, by Country, 2016 - 2026 (USD Million)
      2. 6.3.2. North America CBD-Infused Beverages Market, by Product Type, 2016 – 2026
        1. 6.3.2.1. North America CBD-Infused Beverages Market, by Product Type, 2016 – 2026 (USD Million)
      3. 6.3.3. North America CBD-Infused Beverages Market, by Nature Type, 2016 – 2026
        1. 6.3.3.1. North America CBD-Infused Beverages Market, by Nature Type, 2016 – 2026 (USD Million)
      4. 6.3.4. North America CBD-Infused Beverages Market, by CBD Type, 2016 – 2026
        1. 6.3.4.1. North America CBD-Infused Beverages Market, by CBD Type, 2016 – 2026 (USD Million)
      5. 6.3.5. North America CBD-Infused Beverages Market, by Distribution Channel, 2016 – 2026
        1. 6.3.5.1. North America CBD-Infused Beverages Market, by Distribution Channel, 2016 – 2026 (USD Million)
      6. 6.3.6. U.S.
        1. 6.3.6.1. U.S. CBD-Infused Beverages Market, 2016 – 2026 (USD Million)
      7. 6.3.7. Canada
        1. 6.3.7.1. Canada CBD-Infused Beverages Market, 2016 – 2026 (USD Million)
    4. 6.4. Europe
      1. 6.4.1. Europe CBD-Infused Beverages Market, 2016 – 2026 (USD Million)
        1. 6.4.1.1. Europe CBD-Infused Beverages Market, by Country, 2016 - 2026 (USD Million)
      2. 6.4.2. Europe CBD-Infused Beverages Market, by Product Type, 2016 – 2026
        1. 6.4.2.1. Europe CBD-Infused Beverages Market, by Product Type, 2016 – 2026 (USD Million)
      3. 6.4.3. Europe CBD-Infused Beverages Market, by Nature Type, 2016 – 2026
        1. 6.4.3.1. Europe CBD-Infused Beverages Market, by Nature Type, 2016 – 2026 (USD Million)
      4. 6.4.4. Europe CBD-Infused Beverages Market, by CBD Type, 2016 – 2026
        1. 6.4.4.1. Europe CBD-Infused Beverages Market, by CBD Type, 2016 – 2026 (USD Million)
      5. 6.4.5. Europe CBD-Infused Beverages Market, by Distribution Channel, 2016 – 2026
        1. 6.4.5.1. Europe CBD-Infused Beverages Market, by Distribution Channel, 2016 – 2026 (USD Million)
      6. 6.4.6. Germany
        1. 6.4.6.1. Germany CBD-Infused Beverages Market, 2016 – 2026 (USD Million)
      7. 6.4.7. France
        1. 6.4.7.1. France CBD-Infused Beverages Market, 2016 – 2026 (USD Million)
      8. 6.4.8. U.K.
        1. 6.4.8.1. U.K. CBD-Infused Beverages Market, 2016 – 2026 (USD Million)
      9. 6.4.9. Italy
        1. 6.4.9.1. Italy CBD-Infused Beverages Market, 2016 – 2026 (USD Million)
      10. 6.4.10. Spain
        1. 6.4.10.1. Spain CBD-Infused Beverages Market, 2016 – 2026 (USD Million)
      11. 6.4.11. Rest of Europe
        1. 6.4.11.1. Rest of Europe CBD-Infused Beverages Market, 2016 – 2026 (USD Million)
    5. 6.5. Asia Pacific
      1. 6.5.1. Asia Pacific CBD-Infused Beverages Market, 2016 – 2026 (USD Million)
        1. 6.5.1.1. Asia Pacific CBD-Infused Beverages Market, by Country, 2016 - 2026 (USD Million)
      2. 6.5.2. Asia Pacific CBD-Infused Beverages Market, by Product Type, 2016 – 2026
        1. 6.5.2.1. Asia Pacific CBD-Infused Beverages Market, by Product Type, 2016 – 2026 (USD Million)
      3. 6.5.3. Asia Pacific CBD-Infused Beverages Market, by Nature Type, 2016 – 2026
        1. 6.5.3.1. Asia Pacific CBD-Infused Beverages Market, by Nature Type, 2016 – 2026 (USD Million)
      4. 6.5.4. Asia Pacific CBD-Infused Beverages Market, by CBD Type, 2016 – 2026
        1. 6.5.4.1. Asia Pacific CBD-Infused Beverages Market, by CBD Type, 2016 – 2026 (USD Million)
      5. 6.5.5. Asia Pacific CBD-Infused Beverages Market, by Distribution Channel, 2016 – 2026
        1. 6.5.5.1. Asia Pacific CBD-Infused Beverages Market, by Distribution Channel, 2016 – 2026 (USD Million)
      6. 6.5.6. China
        1. 6.5.6.1. China CBD-Infused Beverages Market, 2016 – 2026 (USD Million)
      7. 6.5.7. Japan
        1. 6.5.7.1. Japan CBD-Infused Beverages Market, 2016 – 2026 (USD Million)
      8. 6.5.8. India
        1. 6.5.8.1. India CBD-Infused Beverages Market, 2016 – 2026 (USD Million)
      9. 6.5.9. South Korea
        1. 6.5.9.1. South Korea CBD-Infused Beverages Market, 2016 – 2026 (USD Million)
      10. 6.5.10. South-East Asia
        1. 6.5.10.1. South-East Asia CBD-Infused Beverages Market, 2016 – 2026 (USD Million)
      11. 6.5.11. Rest of Asia Pacific
        1. 6.5.11.1. Rest of Asia Pacific CBD-Infused Beverages Market, 2016 – 2026 (USD Million)
    6. 6.6. Latin America
      1. 6.6.1. Latin America CBD-Infused Beverages Market, 2016 – 2026 (USD Million)
        1. 6.6.1.1. Latin America CBD-Infused Beverages Market, by Country, 2016 - 2026 (USD Million)
      2. 6.6.2. Latin America CBD-Infused Beverages Market, by Product Type, 2016 – 2026
        1. 6.6.2.1. Latin America CBD-Infused Beverages Market, by Product Type, 2016 – 2026 (USD Million)
      3. 6.6.3. Latin America CBD-Infused Beverages Market, by Nature Type, 2016 – 2026
        1. 6.6.3.1. Latin America CBD-Infused Beverages Market, by Nature Type, 2016 – 2026 (USD Million)
      4. 6.6.4. Latin America CBD-Infused Beverages Market, by CBD Type, 2016 – 2026
        1. 6.6.4.1. Latin America CBD-Infused Beverages Market, by CBD Type, 2016 – 2026 (USD Million)
      5. 6.6.5. Latin America CBD-Infused Beverages Market, by Distribution Channel, 2016 – 2026
        1. 6.6.5.1. Latin America CBD-Infused Beverages Market, by Distribution Channel, 2016 – 2026 (USD Million)
      6. 6.6.6. Brazil
        1. 6.6.6.1. Brazil CBD-Infused Beverages Market, 2016 – 2026 (USD Million)
      7. 6.6.7. Mexico
        1. 6.6.7.1. Mexico CBD-Infused Beverages Market, 2016 – 2026 (USD Million)
      8. 6.6.8. Rest of Latin America
        1. 6.6.8.1. Rest of Latin America CBD-Infused Beverages Market, 2016 – 2026 (USD Million)
    7. 6.7. The Middle-East and Africa
      1. 6.7.1. The Middle-East and Africa CBD-Infused Beverages Market, 2016 – 2026 (USD Million)
        1. 6.7.1.1. The Middle-East and Africa CBD-Infused Beverages Market, by Country, 2016 - 2026 (USD Million)
      2. 6.7.2. The Middle-East and Africa CBD-Infused Beverages Market, by Product Type, 2016 – 2026
        1. 6.7.2.1. The Middle-East and Africa CBD-Infused Beverages Market, by Product Type, 2016 – 2026 (USD Million)
      3. 6.7.3. The Middle-East and Africa CBD-Infused Beverages Market, by Nature Type, 2016 – 2026
        1. 6.7.3.1. The Middle-East and Africa CBD-Infused Beverages Market, by Nature Type, 2016 – 2026 (USD Million)
      4. 6.7.4. The Middle-East and Africa CBD-Infused Beverages Market, by CBD Type, 2016 – 2026
        1. 6.7.4.1. The Middle-East and Africa CBD-Infused Beverages Market, by CBD Type, 2016 – 2026 (USD Million)
      5. 6.7.5. The Middle-East and Africa CBD-Infused Beverages Market, by Distribution Channel, 2016 – 2026
        1. 6.7.5.1. The Middle-East and Africa CBD-Infused Beverages Market, by Distribution Channel, 2016 – 2026 (USD Million)
      6. 6.7.6. GCC Countries
        1. 6.7.6.1. GCC Countries CBD-Infused Beverages Market, 2016 – 2026 (USD Million)
      7. 6.7.7. South Africa
        1. 6.7.7.1. South Africa CBD-Infused Beverages Market, 2016 – 2026 (USD Million)
      8. 6.7.8. Rest of Middle-East Africa
        1. 6.7.8.1. Rest of Middle-East Africa CBD-Infused Beverages Market, 2016 – 2026 (USD Million)
  7. Chapter 7 CBD-Infused Beverages Market – Competitive Landscape
    1. 7.1. Competitor Market Share – Revenue
    2. 7.2. Market Concentration Rate Analysis, Top 3 and Top 5 Players
    3. 7.3. Strategic Developments
      1. 7.3.1. Acquisitions and Mergers
      2. 7.3.2. New Products
      3. 7.3.3. Research & Development Activities
  8. Chapter 8 Company Profiles
    1. 8.1. Cannabiniers
      1. 8.1.1. Company Overview
      2. 8.1.2. Product/Service Portfolio
      3. 8.1.3. Cannabiniers Sales, Revenue, and Gross Margin
      4. 8.1.4. Cannabiniers Revenue and Growth Rate
      5. 8.1.5. Cannabiniers Market Share
      6. 8.1.6. Recent Initiatives, Funding/VC Activities, and Technological Innovations
    2. 8.2. General Cannabis
      1. 8.2.1. Company Overview
      2. 8.2.2. Product/Service Portfolio
      3. 8.2.3. General Cannabis Sales, Revenue, and Gross Margin
      4. 8.2.4. General Cannabis Revenue and Growth Rate
      5. 8.2.5. General Cannabis Market Share
      6. 8.2.6. Recent Initiatives, Funding/VC Activities, and Technological Innovations
    3. 8.3. Canopy Growth Corporation
      1. 8.3.1. Company Overview
      2. 8.3.2. Product/Service Portfolio
      3. 8.3.3. Canopy Growth Corporation Sales, Revenue, and Gross Margin
      4. 8.3.4. Canopy Growth Corporation Revenue and Growth Rate
      5. 8.3.5. Canopy Growth Corporation Market Share
      6. 8.3.6. Recent Initiatives, Funding/VC Activities, and Technological Innovations
    4. 8.4. Aurora Cannabis
      1. 8.4.1. Company Overview
      2. 8.4.2. Product/Service Portfolio
      3. 8.4.3. Aurora Cannabis Sales, Revenue, and Gross Margin
      4. 8.4.4. Aurora Cannabis Revenue and Growth Rate
      5. 8.4.5. Aurora Cannabis Market Share
      6. 8.4.6. Recent Initiatives, Funding/VC Activities, and Technological Innovations
    5. 8.5. Aphria Inc.
      1. 8.5.1. Company Overview
      2. 8.5.2. Product/Service Portfolio
      3. 8.5.3. Aphria Inc. Sales, Revenue, and Gross Margin
      4. 8.5.4. Aphria Inc. Revenue and Growth Rate
      5. 8.5.5. Aphria Inc. Market Share
      6. 8.5.6. Recent Initiatives, Funding/VC Activities, and Technological Innovations
    6. 8.6. Tilray
      1. 8.6.1. Company Overview
      2. 8.6.2. Product/Service Portfolio
      3. 8.6.3. Tilray Sales, Revenue, and Gross Margin
      4. 8.6.4. Tilray Revenue and Growth Rate
      5. 8.6.5. Tilray Market Share
      6. 8.6.6. Recent Initiatives, Funding/VC Activities, and Technological Innovations
    7. 8.7. Daytrip Beverages
      1. 8.7.1. Company Overview
      2. 8.7.2. Product/Service Portfolio
      3. 8.7.3. Daytrip Beverages Sales, Revenue, and Gross Margin
      4. 8.7.4. Daytrip Beverages Revenue and Growth Rate
      5. 8.7.5. Daytrip Beverages Market Share
      6. 8.7.6. Recent Initiatives, Funding/VC Activities, and Technological Innovations
    8. 8.8. Lagunitas Brewing Company
      1. 8.8.1. Company Overview
      2. 8.8.2. Product/Service Portfolio
      3. 8.8.3. Lagunitas Brewing Company Sales, Revenue, and Gross Margin
      4. 8.8.4. Lagunitas Brewing Company Revenue and Growth Rate
      5. 8.8.5. Lagunitas Brewing Company Market Share
      6. 8.8.6. Recent Initiatives, Funding/VC Activities, and Technological Innovations
    9. 8.9. Koios Beverage Corp.
      1. 8.9.1. Company Overview
      2. 8.9.2. Product/Service Portfolio
      3. 8.9.3. Koios Beverage Corp. Sales, Revenue, and Gross Margin
      4. 8.9.4. Koios Beverage Corp. Revenue and Growth Rate
      5. 8.9.5. Koios Beverage Corp. Market Share
      6. 8.9.6. Recent Initiatives, Funding/VC Activities, and Technological Innovations
    10. 8.10. CBD Biotechnology Co. Ltd
      1. 8.10.1. Company Overview
      2. 8.10.2. Product/Service Portfolio
      3. 8.10.3. CBD Biotechnology Co. Ltd Sales, Revenue, and Gross Margin
      4. 8.10.4. CBD Biotechnology Co. Ltd Revenue and Growth Rate
      5. 8.10.5. CBD Biotechnology Co. Ltd Market Share
      6. 8.10.6. Recent Initiatives, Funding/VC Activities, and Technological Innovations
    11. 8.11. G&Juice
      1. 8.11.1. Company Overview
      2. 8.11.2. Product/Service Portfolio
      3. 8.11.3. G&Juice Sales, Revenue, and Gross Margin
      4. 8.11.4. G&Juice Revenue and Growth Rate
      5. 8.11.5. G&Juice Market Share
      6. 8.11.6. Recent Initiatives, Funding/VC Activities, and Technological Innovations
    12. 8.12. K-Zen Beverages Inc.
      1. 8.12.1. Company Overview
      2. 8.12.2. Product/Service Portfolio
      3. 8.12.3. K-Zen Beverages Inc. Sales, Revenue, and Gross Margin
      4. 8.12.4. K-Zen Beverages Inc. Revenue and Growth Rate
      5. 8.12.5. K-Zen Beverages Inc. Market Share
      6. 8.12.6. Recent Initiatives, Funding/VC Activities, and Technological Innovations
    13. 8.13. NewAge Inc.
      1. 8.13.1. Company Overview
      2. 8.13.2. Product/Service Portfolio
      3. 8.13.3. NewAge Inc. Sales, Revenue, and Gross Margin
      4. 8.13.4. NewAge Inc. Revenue and Growth Rate
      5. 8.13.5. NewAge Inc. Market Share
      6. 8.13.6. Recent Initiatives, Funding/VC Activities, and Technological Innovations
    14. 8.14. Alkaline88, LLC
      1. 8.14.1. Company Overview
      2. 8.14.2. Product/Service Portfolio
      3. 8.14.3. Alkaline88, LLC Sales, Revenue, and Gross Margin
      4. 8.14.4. Alkaline88, LLC Revenue and Growth Rate
      5. 8.14.5. Alkaline88, LLC Market Share
      6. 8.14.6. Recent Initiatives, Funding/VC Activities, and Technological Innovations
    15. 8.15. Phivida Holdings Inc.
      1. 8.15.1. Company Overview
      2. 8.15.2. Product/Service Portfolio
      3. 8.15.3. Phivida Holdings Inc. Sales, Revenue, and Gross Margin
      4. 8.15.4. Phivida Holdings Inc. Revenue and Growth Rate
      5. 8.15.5. Phivida Holdings Inc. Market Share
      6. 8.15.6. Recent Initiatives, Funding/VC Activities, and Technological Innovations
    16. 8.16. CANNABIS SATIVA, INC
      1. 8.16.1. Company Overview
      2. 8.16.2. Product/Service Portfolio
      3. 8.16.3. CANNABIS SATIVA, INC Sales, Revenue, and Gross Margin
      4. 8.16.4. CANNABIS SATIVA, INC Revenue and Growth Rate
      5. 8.16.5. CANNABIS SATIVA, INC Market Share
      6. 8.16.6. Recent Initiatives, Funding/VC Activities, and Technological Innovations
    17. 8.17. Puration
      1. 8.17.1. Company Overview
      2. 8.17.2. Product/Service Portfolio
      3. 8.17.3. Puration Sales, Revenue, and Gross Margin
      4. 8.17.4. Puration Revenue and Growth Rate
      5. 8.17.5. Puration Market Share
      6. 8.17.6. Recent Initiatives, Funding/VC Activities, and Technological Innovations
    18. 8.18. Honeydrop Beverages
      1. 8.18.1. Company Overview
      2. 8.18.2. Product/Service Portfolio
      3. 8.18.3. Honeydrop Beverages Sales, Revenue, and Gross Margin
      4. 8.18.4. Honeydrop Beverages Revenue and Growth Rate
      5. 8.18.5. Honeydrop Beverages Market Share
      6. 8.18.6. Recent Initiatives, Funding/VC Activities, and Technological Innovations
    19. 8.19. Others
      1. 8.19.1. Company Overview
      2. 8.19.2. Product/Service Portfolio
      3. 8.19.3. Others Sales, Revenue, and Gross Margin
      4. 8.19.4. Others Revenue and Growth Rate
      5. 8.19.5. Others Market Share
      6. 8.19.6. Recent Initiatives, Funding/VC Activities, and Technological Innovations
  9. Chapter 9 CBD-Infused Beverages — Industry Analysis
    1. 9.1. Introduction and Taxonomy
    2. 9.2. CBD-Infused Beverages Market – Key Trends
      1. 9.2.1. Market Drivers
      2. 9.2.2. Market Restraints
      3. 9.2.3. Market Opportunities
    3. 9.3. Value Chain Analysis
    4. 9.4. Key Mandates and Regulations
    5. 9.5. Technology Roadmap and Timeline
    6. 9.6. CBD-Infused Beverages Market – Attractiveness Analysis
      1. 9.6.1. By Product Type
      2. 9.6.2. By Nature Type
      3. 9.6.3. By CBD Type
      4. 9.6.4. By Distribution Channel
      5. 9.6.5. By Region
  10. Chapter 10 Industrial Chain, Sourcing Strategy, and Downstream Buyers
    1. 10.1. CBD-Infused Beverages Industrial Chain Analysis
    2. 10.2. Downstream Buyers
    3. 10.3. Distributors/Traders List
  11. Chapter 11 Marketing Strategy Analysis
    1. 11.1. Marketing Channel
    2. 11.2. Direct Marketing
    3. 11.3. Indirect Marketing
    4. 11.4. Marketing Channel Development Trends
    5. 11.5. Economic/Political Environmental Change
  12. Chapter 12 Report Conclusion & Key Insights
    1. 12.1. Key Insights from Primary Interviews & Surveys Respondents
    2. 12.2. Key Takeaways from Analysts, Consultants, and Industry Leaders
  13. Chapter 13 Research Approach & Methodology
    1. 13.1. Report Description
    2. 13.2. Research Scope
    3. 13.3. Research Methodology
      1. 13.3.1. Secondary Research
      2. 13.3.2. Primary Research
      3. 13.3.3. Statistical Models
        1. 13.3.3.1. Company Share Analysis Model
        2. 13.3.3.2. Revenue Based Modeling
      4. 13.3.4. Research Limitations

      List of Figures

      Fig.1	Product Picture of CBD-Infused Beverages
      Fig.2	Global CBD-Infused Beverages Market, 2016 – 2026 (USD Million)
      Fig.3	Global CBD-Infused Beverages Market Absolute Revenue Opportunity, 2016 – 2026 (USD Million)
      Fig.4	Global CBD-Infused Beverages Market Incremental Revenue Opportunity, 2020 – 2026 (USD Million)
      Fig.5	Global CBD-Infused Beverages Market Share, by Product Type, 2020 & 2026 (USD Million)
      Fig.6	Global Alcoholic CBD-Infused Beverages Market, 2016 – 2026 (USD Million)
      Fig.7	Global Non-Alcoholic CBD-Infused Beverages Market, 2016 – 2026 (USD Million)
      Fig.8	Global CBD-Infused Beverages Market Share, by Nature Type, 2020 & 2026 (USD Million)
      Fig.9	Global Organic CBD-Infused Beverages Market, 2016 – 2026 (USD Million)
      Fig.10	Global Conventional CBD-Infused Beverages Market, 2016 – 2026 (USD Million)
      Fig.11	Global CBD-Infused Beverages Market Share, by CBD Type, 2020 & 2026 (USD Million)
      Fig.12	Global Marijuana-Derived CBD-Infused Beverages Market, 2016 – 2026 (USD Million)
      Fig.13	Global Hemp-Derived CBD-Infused Beverages Market, 2016 – 2026 (USD Million)
      Fig.14	Global Synthetic CBD-Infused Beverages Market, 2016 – 2026 (USD Million)
      Fig.15	Global CBD-Infused Beverages Market Share, by Distribution Channel, 2020 & 2026 (USD Million)
      Fig.16	Global Supermarkets and Hypermarkets CBD-Infused Beverages Market, 2016 – 2026 (USD Million)
      Fig.17	Global Specialty Stores CBD-Infused Beverages Market, 2016 – 2026 (USD Million)
      Fig.18	Global Online Retail CBD-Infused Beverages Market, 2016 – 2026 (USD Million)
      Fig.19	Global Others CBD-Infused Beverages Market, 2016 – 2026 (USD Million)
      Fig.20	Global CBD-Infused Beverages Market Share, by Region, 2020 & 2026 (USD Million)
      Fig.21	North America CBD-Infused Beverages Market, 2016 – 2026 (USD Million)
      Fig.22	U.S. CBD-Infused Beverages Market, 2016 – 2026 (USD Million)
      Fig.23	Canada CBD-Infused Beverages Market, 2016 – 2026 (USD Million)
      Fig.24	Europe CBD-Infused Beverages Market, 2016 – 2026 (USD Million)
      Fig.25	Germany CBD-Infused Beverages Market, 2016 – 2026 (USD Million)
      Fig.26	France CBD-Infused Beverages Market, 2016 – 2026 (USD Million)
      Fig.27	U.K. CBD-Infused Beverages Market, 2016 – 2026 (USD Million)
      Fig.28	Italy CBD-Infused Beverages Market, 2016 – 2026 (USD Million)
      Fig.29	Spain CBD-Infused Beverages Market, 2016 – 2026 (USD Million)
      Fig.30	Rest of Europe CBD-Infused Beverages Market, 2016 – 2026 (USD Million)
      Fig.31	Asia Pacific CBD-Infused Beverages Market, 2016 – 2026 (USD Million)
      Fig.32	China CBD-Infused Beverages Market, 2016 – 2026 (USD Million)
      Fig.33	Japan CBD-Infused Beverages Market, 2016 – 2026 (USD Million)
      Fig.34	India CBD-Infused Beverages Market, 2016 – 2026 (USD Million)
      Fig.35	South  Korea CBD-Infused Beverages Market, 2016 – 2026 (USD Million)
      Fig.36	South-East Asia CBD-Infused Beverages Market, 2016 – 2026 (USD Million)
      Fig.37	Rest of Asia Pacific CBD-Infused Beverages Market, 2016 – 2026 (USD Million)
      Fig.38	Latin America CBD-Infused Beverages Market, 2016 – 2026 (USD Million)
      Fig.39	Brazil CBD-Infused Beverages Market, 2016 – 2026 (USD Million)
      Fig.40	Mexico CBD-Infused Beverages Market, 2016 – 2026 (USD Million)
      Fig.41	Rest of Latin America CBD-Infused Beverages Market, 2016 – 2026 (USD Million)
      Fig.42	The Middle-East and Africa CBD-Infused Beverages Market, 2016 – 2026 (USD Million)
      Fig.43	GCC Countries CBD-Infused Beverages Market, 2016 – 2026 (USD Million)
      Fig.44	South Africa CBD-Infused Beverages Market, 2016 – 2026 (USD Million)
      Fig.45	Rest of Middle-East Africa CBD-Infused Beverages Market, 2016 – 2026 (USD Million)
      Fig.46	Competitor Market Share – Revenue
      Fig.47	Cannabiniers Revenue and Growth Rate
      Fig.48	Cannabiniers Market Share
      Fig.49	General Cannabis Revenue and Growth Rate
      Fig.50	General Cannabis Market Share
      Fig.51	Canopy Growth Corporation Revenue and Growth Rate
      Fig.52	Canopy Growth Corporation Market Share
      Fig.53	Aurora Cannabis Revenue and Growth Rate
      Fig.54	Aurora Cannabis Market Share
      Fig.55	Aphria Inc. Revenue and Growth Rate
      Fig.56	Aphria Inc. Market Share
      Fig.57	Tilray Revenue and Growth Rate
      Fig.58	Tilray Market Share
      Fig.59	Daytrip Beverages Revenue and Growth Rate
      Fig.60	Daytrip Beverages Market Share
      Fig.61	Lagunitas Brewing Company Revenue and Growth Rate
      Fig.62	Lagunitas Brewing Company Market Share
      Fig.63	Koios Beverage Corp. Revenue and Growth Rate
      Fig.64	Koios Beverage Corp. Market Share
      Fig.65	CBD Biotechnology Co. Ltd Revenue and Growth Rate
      Fig.66	CBD Biotechnology Co. Ltd Market Share
      Fig.67	G&Juice Revenue and Growth Rate
      Fig.68	G&Juice Market Share
      Fig.69	K-Zen Beverages Inc. Revenue and Growth Rate
      Fig.70	K-Zen Beverages Inc. Market Share
      Fig.71	NewAge Inc. Revenue and Growth Rate
      Fig.72	NewAge Inc. Market Share
      Fig.73	Alkaline88, LLC Revenue and Growth Rate
      Fig.74	Alkaline88, LLC Market Share
      Fig.75	Phivida Holdings Inc. Revenue and Growth Rate
      Fig.76	Phivida Holdings Inc. Market Share
      Fig.77	CANNABIS SATIVA, INC Revenue and Growth Rate
      Fig.78	CANNABIS SATIVA, INC Market Share
      Fig.79	Puration Revenue and Growth Rate
      Fig.80	Puration Market Share
      Fig.81	Honeydrop Beverages Revenue and Growth Rate
      Fig.82	Honeydrop Beverages Market Share
      Fig.83	Others Revenue and Growth Rate
      Fig.84	Others Market Share
      Fig.85	Market Dynamics
      Fig.86	Global CBD-Infused Beverages – Value Chain Analysis
      Fig.87	Key Mandates and Regulations
      Fig.88	Technology Roadmap and Timeline
      Fig.89	Market Attractiveness Analysis – By Product Type
      Fig.90	Market Attractiveness Analysis – By Nature Type
      Fig.91	Market Attractiveness Analysis – By CBD Type
      Fig.92	Market Attractiveness Analysis – By Distribution Channel
      Fig.93	Market Attractiveness Analysis – By Region
      Fig.94	CBD-Infused Beverages Industrial Chain Analysis
      Fig.95	Market Channels
      Fig.96	Marketing Channel Development Trend
      Fig.97	Growth in World Gross Product, 2008-2018
      

      List of Tables

      	
      Table 1	Global CBD-Infused Beverages Market, 2020 & 2026 (USD Million)
      Table 2	Global CBD-Infused Beverages Market, by Product Type, 2016 – 2026 (USD Million)
      Table 3	Global CBD-Infused Beverages Market, by Nature Type, 2016 – 2026 (USD Million)
      Table 4	Global CBD-Infused Beverages Market, by CBD Type, 2016 – 2026 (USD Million)
      Table 5	Global CBD-Infused Beverages Market, by Distribution Channel, 2016 – 2026 (USD Million)
      Table 6	Global CBD-Infused Beverages Market, by Region, 2016 – 2026 (USD Million)
      Table 7	North America CBD-Infused Beverages Market, by Country, 2016 – 2026 (USD Million)
      Table 8	North America CBD-Infused Beverages Market, by Product Type, 2016 – 2026 (USD Million)
      Table 9 North America CBD-Infused Beverages Market, by Nature Type, 2016 – 2026 (USD Million)
      Table 10 North America CBD-Infused Beverages Market, by CBD Type, 2016 – 2026 (USD Million)
      Table 11 North America CBD-Infused Beverages Market, by Distribution Channel, 2016 – 2026 (USD Million)
      Table 12 Europe CBD-Infused Beverages Market, by Country, 2016 – 2026 (USD Million)
      Table 13 Europe CBD-Infused Beverages Market, by Product Type, 2016 – 2026 (USD Million)
      Table 14 Europe CBD-Infused Beverages Market, by Nature Type, 2016 – 2026 (USD Million)
      Table 15 Europe CBD-Infused Beverages Market, by CBD Type, 2016 – 2026 (USD Million)
      Table 16 Europe CBD-Infused Beverages Market, by Distribution Channel, 2016 – 2026 (USD Million)
      Table 17 Asia Pacific CBD-Infused Beverages Market, by Country, 2016 – 2026 (USD Million)
      Table 18 Asia Pacific CBD-Infused Beverages Market, by Product Type, 2016 – 2026 (USD Million)
      Table 19 Asia Pacific CBD-Infused Beverages Market, by Nature Type, 2016 – 2026 (USD Million)
      Table 20 Asia Pacific CBD-Infused Beverages Market, by CBD Type, 2016 – 2026 (USD Million)
      Table 21 Asia Pacific CBD-Infused Beverages Market, by Distribution Channel, 2016 – 2026 (USD Million)
      Table 22 Latin America CBD-Infused Beverages Market, by Country, 2016 – 2026 (USD Million)
      Table 23 Latin America CBD-Infused Beverages Market, by Product Type, 2016 – 2026 (USD Million)
      Table 24 Latin America CBD-Infused Beverages Market, by Nature Type, 2016 – 2026 (USD Million)
      Table 25 Latin America CBD-Infused Beverages Market, by CBD Type, 2016 – 2026 (USD Million)
      Table 26 Latin America CBD-Infused Beverages Market, by Distribution Channel, 2016 – 2026 (USD Million)
      Table 27 The Middle-East and Africa CBD-Infused Beverages Market, by Country, 2016 – 2026 (USD Million)
      Table 28 The Middle-East and Africa CBD-Infused Beverages Market, by Product Type, 2016 – 2026 (USD Million)
      Table 29 The Middle-East and Africa CBD-Infused Beverages Market, by Nature Type, 2016 – 2026 (USD Million)
      Table 30 The Middle-East and Africa CBD-Infused Beverages Market, by CBD Type, 2016 – 2026 (USD Million)
      Table 31 The Middle-East and Africa CBD-Infused Beverages Market, by Distribution Channel, 2016 – 2026 (USD Million)
      Table 32 Global CBD-Infused Beverages Market - Company Revenue Analysis, 2016 – 2019 (USD Million)
      Table 33 Global CBD-Infused Beverages Market - Company Revenue Share Analysis, 2016 – 2019 (%)
      Table 34 Acquisitions and Mergers
      Table 35 Market Drivers – Impact Analysis
      Table 36 Market Restraints
      Table 37 Market Opportunities
      Table 38 Major Buyers of CBD-Infused Beverages
      Table 39 Distributors/Traders of CBD-Infused Beverages by Region
      

Industry Major Market Players

  • Cannabiniers
  • General Cannabis
  • Canopy Growth Corporation
  • Aurora Cannabis
  • Aphria Inc.
  • Tilray
  • Daytrip Beverages
  • Lagunitas Brewing Company
  • Koios Beverage Corp.
  • CBD Biotechnology Co. Ltd
  • G&Juice
  • K-Zen Beverages Inc.
  • NewAge Inc.
  • Alkaline88 LLC
  • Phivida Holdings Inc.
  • CANNABIS SATIVA INC
  • Puration
  • Honeydrop Beverages