Search Market Research Report

Discover Our Latest Reports
Discover Our Featured Reports
Discover Top Selling Reports

Caps and Closures Market Size, Share Global Analysis Report, 2021–2026

report img

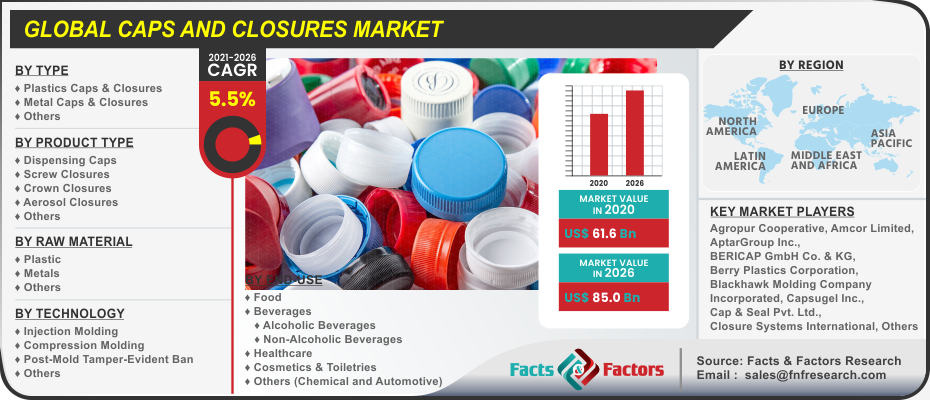
Caps and Closures Market Size, Share & Trends Analysis Report By Type (Plastics Caps & Closures, Metal Caps & Closures, Others), By Product Type (Dispensing Caps, Screw Closures, Crown Closures, Aerosol Closures, Others), By Raw Material (Plastic, Metals, Others), By Technology (Injection Molding, Compression Molding, Post-Mold Tamper-Evident Ban, Others), By End-use Industry (Food, Beverages, Healthcare, Cosmetics & Toiletries, Others), By Region, And Segment Forecast 2021–2026

Industry Insights

According to facts and factors, the worldwide demand for the global caps and closures market was valued at approximately USD 61.6 billion in 2020 and is predicted to create revenue of roughly USD 85.0 billion by the end of 2026, with a CAGR of approximately 5.5% between 2021 and 2026.

logoMarket Overview     

Caps and closures made from metal, plastic, and other materials are closing systems used in containers, cartons, bottles, jars, and other packaging formats for packaging and sealing applications. The growing production output from various end-use industries, coupled with design enhancement in caps and closures are driving its sales in the market. The final components of the packaging process are the Caps and closures. They also represent one of the most vital parts of the entire process on which the product integrity depends upon. Plastic caps and closures are important components in product packaging and play a key role in enhancing the functionality and aesthetics of the products. They are currently used across a number of different industries such as household goods, food and beverages, pharmaceuticals, cosmetic products, etc.

Meanwhile, sales of caps and closures are largely driven by marketing activities such as partnerships, product maximization, investments, acquisitions, and others. Furthermore, production, recyclability, and the introduction of sustainable and recyclable caps and closures are building lucrative opportunities for key manufacturers. Basically, manufacturers are focusing on circular packaging with the incorporation of caps and closures, which are made up from post-consumer resin (PCR) and other recyclable materials. With this, caps and closures manufacturers are upgrading their recycling initiatives, attracting eco-conscious customers, and achieving sustainability targets in the market. This turn is propelling sales of caps and closures, and the trend is projected to continue over the forecast period.

Global Caps and Closures Market

To know more about this report | Request Free Sample Copy

logoIndustry Growth Factors

In recent years, there has been a significant rise in demand for child resistant packaging over safety concerns and regulations. Owing to increasing mandatory safety regulations for child resistant packaging, caps and closures manufacturers are producing child-resistant (CR) caps and closures on a large scale. The increase in demand for demographic trends, easy-to-open and sustainable packs and rapid urbanization contribute to the demand and adoption rate of caps & closures. These are widely utilized in the food & beverage industry for various applications, such as carbonated drinks, ketchup, mayonnaise, bottled water, and alcoholic beverages. Caps & closures help the extend shelf life of products, balance the oxygen content of the packed product and provide a barrier to dirt and moisture. Export & import of caps & closures has been attaining importance with its increasing demand.

logo Covid-19 Analysis

The COVID-19 pandemic harmed the market growth, particularly caps and closures of productions. Caps & closures are used in pharmaceuticals, food & beverages, cosmetic products, household goods, and others. They are the final components of packaging and are accountable for maintaining the integrity of the packing of the product. Caps & closures use polypropylene, polyethylene, steel, and aluminum as the primary raw materials for manufacturing

On the other hand, the industry includes companies working in processing raw food materials distribution and packaging, which include already prepared foods and packaged foods, along with alcoholic and non-alcoholic beverages. The rise in the number of on-the-go consumers and increased adoption of ready-to-eat food are the primary factors for the growth of the food & beverage industry before the COVID-19 pandemic. Steadily population increase and changing lifestyle also per capita income were other drivers of the food & beverage industry. However, some factors affecting the food & beverage industry include shutdowns of restaurants and other seating areas.

logoSegmentation Analysis

The caps and closures market is segmented based on type, product type, raw material, technology, and end-use industry:

As per type caps and closures, the market is segmented into (plastics caps & closures, metal caps & closures, others), by product type (dispensing caps, screw closures, crown closures, aerosol closures, others), by raw material (plastic, metals, others), by technology (injection molding, compression molding, post-mold tamper-evident ban, others) and by end-use industry (food, beverages, healthcare, cosmetics & toiletries, others). The plastic segment held the highest market share of over 54% in 2020, in terms of revenue, and is estimated to expand further at the fastest CAGR over the forecast period. Plastic material poses environmental concerns due to lower degradability as well as CO2 emissions taking place during its production.

logoReport Scope

Report Attribute

Details

Market Size in 2020

USD 61.6 Billion

Projected Market Size in 2026

USD 85.0 Billion

CAGR Growth Rate

5.5% CAGR

Base Year

2020

Forecast Years

2021-2026

Key Market Players

Agropur Cooperative, Amcor Limited, AptarGroup Inc., BERICAP GmbH Co. & KG, Berry Plastics Corporation, Blackhawk Molding Company Incorporated, Capsugel Inc., Cap & Seal Pvt. Ltd., Closure Systems International, Crown Holdings Incorporation, Guala Closures Group, Oriental Containers, Pact Group Holdings, Phoenix Closures, Pelliconi, Plastics Corporation, Plastic Closures Limited, Premier Vinyl Solution, Rexam PLC, Reynolds Group Holdings Limited, etc. and among others.

Key Segment

By Type, By Product Type, By Raw Material, By Technology, By End-use Industry, and By Region

Major Regions Covered

North America, Europe, Asia Pacific, Latin America, and the Middle East & Africa

Purchase Options

Request customized purchase options to meet your research needs. Explore purchase options

logo Regional Analysis

In the global market, Asia Pacific held the largest share. The Asia Pacific led the global caps & closures market. The Asia Pacific includes two high-growth economies like India and China. The standard of living is improving in this region, which is accelerating the per-capita spending on the packaging. Nowadays, hectic lifestyles result in the demand for packaged products for on-the-go consumption. This consequently leads to the demand for closures that are easy to open can be re-sealed, and keep the products fresh & new for a longer period. An economy such as Singapore, Indonesia, and Malaysia offers significant opportunities for the caps & closures market.

logo Competitive Players

Some of the essential players operating in the caps and closures market are :

  • Agropur Cooperative
  • Amcor Limited
  • AptarGroup Inc.
  • BERICAP GmbH Co. & KG
  • Berry Plastics Corporation
  • Blackhawk Molding Company Incorporated
  • Capsugel Inc.
  • Cap & Seal Pvt. Ltd.
  • Closure Systems International
  • Crown Holdings Incorporation
  • Guala Closures Group
  • Oriental Containers
  • Pact Group Holdings
  • Phoenix Closures
  • Pelliconi
  • Plastics Corporation
  • Plastic Closures Limited
  • Premier Vinyl Solution
  • Rexam PLC
  • Reynolds Group Holdings Limited

Companies are also focusing on procuring recycled materials for caps manufacturing. Post-Consumer Recycled aluminum, steel, and plastic are being explored, which can be processed further and used as raw materials. For instance, in October 2020, Closure Systems International launched a beverage closure made from 30% PCR content in partnership with Coca-Cola to increase product sustainability.

logo By Type Segment Analysis

  • Plastics Caps & Closures
  • Metal Caps & Closures
  • Others

logo By Product Type Segment Analysis

  • Dispensing Caps
  • Screw Closures
  • Crown Closures
  • Aerosol Closures
  • Others

logo By Raw Material Segment Analysis

  • Plastic
  • Metals
  • Others

logo By Technology Segment Analysis

  • Injection Molding
  • Compression Molding
  • Post-Mold Tamper-Evident Ban
  • Others

logo By End-use Industry Segment Analysis

  • Food
  • Beverages
    • Alcoholic Beverages
    • Non-Alcoholic Beverages
  • Healthcare
  • Cosmetics & Toiletries
  • Others (Chemical and Automotive)

logo Regional Segment Analysis

  • North America
    • U.S.
    • Canada
  • Europe
    • Germany
    • France
    • U.K.
    • Italy
    • Spain
    • Rest of Europe
  • Asia Pacific
    • China
    • Japan
    • India
    • South Korea
    • South-East Asia
    • Rest of Asia Pacific
  • Latin America
    • Brazil
    • Mexico
    • Rest of Latin America
  • The Middle-East and Africa
    • GCC Countries
    • South Africa
    • Rest of Middle-East Africa

Table of Content

  1. Chapter 1 Executive Summary
    1. 1.1. Introduction of Caps and Closures
    2. 1.2. Global Caps and Closures Market, 2020 & 2026 (USD Billion)
    3. 1.3. Global Caps and Closures Market, 2016 – 2026 (USD Billion) (Million Units)
    4. 1.4. Global Caps and Closures Market Absolute Revenue Opportunity, 2016 – 2026 (USD Billion)
    5. 1.5. Global Caps and Closures Market Incremental Revenue Opportunity, 2020 – 2026 (USD Billion)
  2. Chapter 2 Caps and Closures Market – Sales Channel Analysis
    1. 2.1. Global Caps and Closures Market – Sales Channel Overview
    2. 2.2. Global Caps and Closures Market Share, by Sales Channel, 2020 & 2026 (USD Billion)
    3. 2.3. Global Caps and Closures Market share, by Sales Channel, 2020 & 2026 (Million Units)
    4. 2.4. Premium Food Service
      1. 2.4.1. Global Premium Food Service Caps and Closures Market, 2016 – 2026 (USD Billion)
      2. 2.4.2. Global Premium Food Service Caps and Closures Market, 2016 – 2026 (Million Units)
    5. 2.5. Non Premium Food Service
      1. 2.5.1. Global Non Premium Food Service Caps and Closures Market, 2016 – 2026 (USD Billion)
      2. 2.5.2. Global Non Premium Food Service Caps and Closures Market, 2016 – 2026 (Million Units)
    6. 2.6. B2B
      1. 2.6.1. Global B2B Caps and Closures Market, 2016 – 2026 (USD Billion)
      2. 2.6.2. Global B2B Caps and Closures Market, 2016 – 2026 (Million Units)
  3. Chapter 3 Caps and Closures Market – Application Analysis
    1. 3.1. Global Caps and Closures Market – Application Overview
    2. 3.2. Global Caps and Closures Market Share, by Application, 2020 & 2026 (USD Billion)
    3. 3.3. Global Caps and Closures Market Share, by Application, 2020 & 2026 (Million Units)
    4. 3.4. Savory
      1. 3.4.1. Global Savory Caps and Closures Market, 2016 – 2026 (USD Billion)
      2. 3.4.2. Global Savory Caps and Closures Market, 2016 – 2026 (Million Units)
    5. 3.5. Sandwich
      1. 3.5.1. Global Sandwich Caps and Closures Market, 2016 – 2026 (USD Billion)
      2. 3.5.2. Global Sandwich Caps and Closures Market, 2016 – 2026 (Million Units)
    6. 3.6. Salad Dressings & Dip
      1. 3.6.1. Global Salad Dressings & Dip Caps and Closures Market, 2016 – 2026 (USD Billion)
      2. 3.6.2. Global Salad Dressings & Dip Caps and Closures Market, 2016 – 2026 (Million Units)
    7. 3.7. Baked Goods/Desserts
      1. 3.7.1. Global Baked Goods/Desserts Caps and Closures Market, 2016 – 2026 (USD Billion)
      2. 3.7.2. Global Baked Goods/Desserts Caps and Closures Market, 2016 – 2026 (Million Units)
    8. 3.8. Ice Creams & Smoothies
      1. 3.8.1. Global Ice Creams & Smoothies Caps and Closures Market, 2016 – 2026 (USD Billion)
      2. 3.8.2. Global Ice Creams & Smoothies Caps and Closures Market, 2016 – 2026 (Million Units)
  4. Chapter 4 Caps and Closures Market – Regional Analysis
    1. 4.1. Global Caps and Closures Market Regional Overview
    2. 4.2. Global Caps and Closures Market Share, by Region, 2020 & 2026 (USD Billion)
    3. 4.3. Global Caps and Closures Market Share, by Region, 2020 & 2026 (Million Units)
    4. 4.4. North America
      1. 4.4.1. North America Caps and Closures Market, 2016 – 2026 (USD Billion)
        1. 4.4.1.1. North America Caps and Closures Market, by Country, 2016 - 2026 (USD Billion)
      2. 4.4.2. North America Market, 2016 – 2026 (Million Units)
        1. 4.4.2.1. North America Caps and Closures Market, by Country, 2016 - 2026 (Million Units)
      3. 4.4.3. North America Caps and Closures Market, by Sales Channel, 2016 – 2026
        1. 4.4.3.1. North America Caps and Closures Market, by Sales Channel, 2016 – 2026 (USD Billion)
        2. 4.4.3.2. North America Caps and Closures Market, by Sales Channel, 2016 – 2026 (Million Units)
      4. 4.4.4. North America Caps and Closures Market, by Application, 2016 – 2026
        1. 4.4.4.1. North America Caps and Closures Market, by Application, 2016 – 2026 (USD Billion)
        2. 4.4.4.2. North America Caps and Closures Market, by Application, 2016 – 2026 (Million Units)
      5. 4.4.5. U.S.
        1. 4.4.5.1. U.S. Caps and Closures Market, 2016 – 2026 (USD Billion)
        2. 4.4.5.2. U.S. Caps and Closures Market, 2016 – 2026 (Million Units)
      6. 4.4.6. Canada
        1. 4.4.6.1. Canada Caps and Closures Market, 2016 – 2026 (USD Billion)
        2. 4.4.6.2. Canada Caps and Closures Market, 2016 – 2026 (Million Units)
    5. 4.5. Europe
      1. 4.5.1. Europe Caps and Closures Market, 2016 – 2026 (USD Billion)
        1. 4.5.1.1. Europe Caps and Closures Market, by Country, 2016 - 2026 (USD Billion)
      2. 4.5.2. Europe Caps and Closures Market, 2016 – 2026 (Million Units)
        1. 4.5.2.1. Europe Caps and Closures Market, by Country, 2016 - 2026 (Million Units)
      3. 4.5.3. Europe Caps and Closures Market, by Sales Channel, 2016 – 2026
        1. 4.5.3.1. Europe Caps and Closures Market, by Sales Channel, 2016 – 2026 (USD Billion)
        2. 4.5.3.2. Europe Caps and Closures Market, by Sales Channel, 2016 – 2026 (Million Units)
      4. 4.5.4. Europe Caps and Closures Market, by Application, 2016 – 2026
        1. 4.5.4.1. Europe Caps and Closures Market, by Application, 2016 – 2026 (USD Billion)
        2. 4.5.4.2. Europe Caps and Closures Market, by Application, 2016 – 2026 (Million Units)
      5. 4.5.5. Germany
        1. 4.5.5.1. Germany Caps and Closures Market, 2016 – 2026 (USD Billion)
        2. 4.5.5.2. Germany Caps and Closures Market, 2016 – 2026 (Million Units)
      6. 4.5.6. France
        1. 4.5.6.1. France Caps and Closures Market, 2016 – 2026 (USD Billion)
        2. 4.5.6.2. France Caps and Closures Market, 2016 – 2026 (Million Units)
      7. 4.5.7. U.K.
        1. 4.5.7.1. U.K. Caps and Closures Market, 2016 – 2026 (USD Billion)
        2. 4.5.7.2. U.K. Caps and Closures Market, 2016 – 2026 (Million Units)
      8. 4.5.8. Italy
        1. 4.5.8.1. Italy Caps and Closures Market, 2016 – 2026 (USD Billion)
        2. 4.5.8.2. Italy Caps and Closures Market, 2016 – 2026 (Million Units)
      9. 4.5.9. Spain
        1. 4.5.9.1. Spain Caps and Closures Market, 2016 – 2026 (USD Billion)
        2. 4.5.9.2. Spain Caps and Closures Market, 2016 – 2026 (Million Units)
      10. 4.5.10. Rest of Europe
        1. 4.5.10.1. Rest of Europe Caps and Closures Market, 2016 – 2026 (USD Billion)
        2. 4.5.10.2. Rest of Europe Caps and Closures Market, 2016 – 2026 (Million Units)
    6. 4.6. Asia Pacific
      1. 4.6.1. Asia Pacific Caps and Closures Market, 2016 – 2026 (USD Billion)
        1. 4.6.1.1. Asia Pacific Caps and Closures Market, by Country, 2016 - 2026 (USD Billion)
      2. 4.6.2. Asia Pacific Caps and Closures Market, 2016 – 2026 (Million Units)
        1. 4.6.2.1. Asia Pacific Caps and Closures Market, by Country, 2016 - 2026 (Million Units)
      3. 4.6.3. Asia Pacific Caps and Closures Market, by Sales Channel, 2016 – 2026
        1. 4.6.3.1. Asia Pacific Caps and Closures Market, by Sales Channel, 2016 – 2026 (USD Billion)
        2. 4.6.3.2. Asia Pacific Caps and Closures Market, by Sales Channel, 2016 – 2026 (Million Units)
      4. 4.6.4. Asia Pacific Caps and Closures Market, by Application, 2016 – 2026
        1. 4.6.4.1. Asia Pacific Caps and Closures Market, by Application, 2016 – 2026 (USD Billion)
        2. 4.6.4.2. Asia Pacific Caps and Closures Market, by Application, 2016 – 2026 (Million Units)
      5. 4.6.5. China
        1. 4.6.5.1. China Caps and Closures Market, 2016 – 2026 (USD Billion)
        2. 4.6.5.2. China Caps and Closures Market, 2016 – 2026 (Million Units)
      6. 4.6.6. India
        1. 4.6.6.1. India Caps and Closures Market, 2016 – 2026 (USD Billion)
        2. 4.6.6.2. India Caps and Closures Market, 2016 – 2026 (Million Units)
      7. 4.6.7. Japan
        1. 4.6.7.1. Japan Caps and Closures Market, 2016 – 2026 (USD Billion)
        2. 4.6.7.2. Japan Caps and Closures Market, 2016 – 2026 (Million Units)
      8. 4.6.8. South Korea
        1. 4.6.8.1. South Korea Caps and Closures Market, 2016 – 2026 (USD Billion)
        2. 4.6.8.2. South Korea Caps and Closures Market, 2016 – 2026 (Million Units)
      9. 4.6.9. South-East Asia
        1. 4.6.9.1. South-East Asia Caps and Closures Market, 2016 – 2026 (USD Billion)
        2. 4.6.9.2. South-East Asia Caps and Closures Market, 2016 – 2026 (Million Units)
      10. 4.6.10. Rest of Asia Pacific
        1. 4.6.10.1. Rest of Asia Pacific Caps and Closures Market, 2016 – 2026 (USD Billion)
        2. 4.6.10.2. Rest of Asia Pacific Caps and Closures Market, 2016 – 2026 (Million Units)
    7. 4.7. Latin America
      1. 4.7.1. Latin America Caps and Closures Market, 2016 – 2026 (USD Billion)
        1. 4.7.1.1. Latin America Caps and Closures Market, by Country, 2016 - 2026 (USD Billion)
      2. 4.7.2. Latin America Caps and Closures Market, 2016 – 2026 (Million Units)
        1. 4.7.2.1. Latin America Caps and Closures Market, by Country, 2016 - 2026 (Million Units)
      3. 4.7.3. Latin America Caps and Closures Market, by Sales Channel, 2016 – 2026
        1. 4.7.3.1. Latin America Caps and Closures Market, by Sales Channel, 2016 – 2026 (USD Billion)
        2. 4.7.3.2. Latin America Caps and Closures Market, by Sales Channel, 2016 – 2026 (Million Units)
      4. 4.7.4. Latin America Caps and Closures Market, by Application, 2016 – 2026
        1. 4.7.4.1. Latin America Caps and Closures Market, by Application, 2016 – 2026 (USD Billion)
        2. 4.7.4.2. Latin America Caps and Closures Market, by Application, 2016 – 2026 (Million Units)
      5. 4.7.5. Brazil
        1. 4.7.5.1. Brazil Caps and Closures Market, 2016 – 2026 (USD Billion)
        2. 4.7.5.2. Brazil Caps and Closures Market, 2016 – 2026 (Million Units)
      6. 4.7.6. Mexico
        1. 4.7.6.1. Mexico Caps and Closures Market, 2016 – 2026 (USD Billion)
        2. 4.7.6.2. Mexico Caps and Closures Market, 2016 – 2026 (Million Units)
      7. 4.7.7. Rest of Latin America
        1. 4.7.7.1. Rest of Latin America Caps and Closures Market, 2016 – 2026 (USD Billion)
        2. 4.7.7.2. Rest of Latin America Caps and Closures Market, 2016 – 2026 (Million Units)
    8. 4.8. Middle East & Africa
      1. 4.8.1. Middle East & Africa Caps and Closures Market, 2016 – 2026 (USD Billion)
        1. 4.8.1.1. Middle East & Africa Caps and Closures Market, by Country, 2016 - 2026 (USD Billion)
      2. 4.8.2. Middle East & Africa Caps and Closures Market, 2016 – 2026 (Million Units)
        1. 4.8.2.1. Middle East & Africa Caps and Closures Market, by Country, 2016 - 2026 (Million Units)
      3. 4.8.3. Middle East & Africa Caps and Closures Market, by Sales Channel, 2016 – 2026
        1. 4.8.3.1. Middle East & Africa Caps and Closures Market, by Sales Channel, 2016 – 2026 (USD Billion)
        2. 4.8.3.2. Middle East & Africa Caps and Closures Market, by Sales Channel, 2016 – 2026 (Million Units)
      4. 4.8.4. Middle East & Africa Caps and Closures Market, by Application, 2016 – 2026
        1. 4.8.4.1. Middle East & Africa Caps and Closures Market, by Application, 2016 – 2026 (USD Billion)
        2. 4.8.4.2. Middle East & Africa Caps and Closures Market, by Application, 2016 – 2026 (Million Units)
      5. 4.8.5. GCC
        1. 4.8.5.1. GCC Caps and Closures Market, 2016 – 2026 (USD Billion)
        2. 4.8.5.2. GCC Caps and Closures Market, 2016 – 2026 (Million Units)
      6. 4.8.6. South Africa
        1. 4.8.6.1. South Africa Caps and Closures Market, 2016 – 2026 (USD Billion)
        2. 4.8.6.2. South Africa Caps and Closures Market, 2016 – 2026 (Million Units)
      7. 4.8.7. Rest of Middle East & Africa
        1. 4.8.7.1. Rest of Middle East & Africa Caps and Closures Market, 2016 – 2026 (USD Billion)
        2. 4.8.7.2. Rest of Middle East & Africa Caps and Closures Market, 2016 – 2026 (Million Units)
  5. Chapter 5 Caps and Closures Production, Consumption, Export, Import by Regions
    1. 5.1. Global Caps and Closures Production and Consumption, 2016 – 2026 (Million Units)
    2. 5.2. Global Import and Export Analysis, by Region
  6. Chapter 6 Caps and Closures Market – Competitive Landscape
    1. 6.1. Competitor Market Share – Revenue
    2. 6.2. Market Concentration Rate Analysis, Top 3 and Top 5 Players
    3. 6.3. Competitor Market Share – Volume
    4. 6.4. Strategic Developments
      1. 6.4.1. Acquisitions and Mergers
      2. 6.4.2. New Products
      3. 6.4.3. Research & Development Activities
  7. Chapter 7 Company Profiles
    1. 7.1. Daisy Brand LLC
      1. 7.1.1. Company Overview
      2. 7.1.2. Product/Service Portfolio
      3. 7.1.3. Daisy Brand LLC Sales, Revenue, Price, and Gross Margin
      4. 7.1.4. Daisy Brand LLC Revenue and Growth Rate
      5. 7.1.5. Daisy Brand LLC Market Share
      6. 7.1.6. Recent Initiatives, Funding/VC Activities, and Technological Innovations
    2. 7.2. Dean Foods
      1. 7.2.1. Company Overview
      2. 7.2.2. Product/Service Portfolio
      3. 7.2.3. Dean Foods Sales, Revenue, Price, and Gross Margin
      4. 7.2.4. Dean Foods Revenue and Growth Rate
      5. 7.2.5. Dean Foods Market Share
      6. 7.2.6. Recent Initiatives, Funding/VC Activities, and Technological Innovations
    3. 7.3. Land O’ Lakes
      1. 7.3.1. Company Overview
      2. 7.3.2. Product/Service Portfolio
      3. 7.3.3. Land O’ Lakes Sales, Revenue, Price, and Gross Margin
      4. 7.3.4. Land O’ Lakes Revenue and Growth Rate
      5. 7.3.5. Land O’ Lakes Market Share
      6. 7.3.6. Recent Initiatives, Funding/VC Activities, and Technological Innovations
    4. 7.4. Scott Brothers Diary Inc.
      1. 7.4.1. Company Overview
      2. 7.4.2. Product/Service Portfolio
      3. 7.4.3. Scott Brothers Diary Inc. Sales, Revenue, Price, and Gross Margin
      4. 7.4.4. Scott Brothers Diary Inc. Revenue and Growth Rate
      5. 7.4.5. Scott Brothers Diary Inc. Market Share
      6. 7.4.6. Recent Initiatives, Funding/VC Activities, and Technological Innovations
    5. 7.5. Uelzena Ingredients
      1. 7.5.1. Company Overview
      2. 7.5.2. Product/Service Portfolio
      3. 7.5.3. Uelzena Ingredients Sales, Revenue, Price, and Gross Margin
      4. 7.5.4. Uelzena Ingredients Revenue and Growth Rate
      5. 7.5.5. Uelzena Ingredients Market Share
      6. 7.5.6. Recent Initiatives, Funding/VC Activities, and Technological Innovations
    6. 7.6. Compsey Creamery
      1. 7.6.1. Company Overview
      2. 7.6.2. Product/Service Portfolio
      3. 7.6.3. Compsey Creamery Sales, Revenue, Price, and Gross Margin
      4. 7.6.4. Compsey Creamery Revenue and Growth Rate
      5. 7.6.5. Compsey Creamery Market Share
      6. 7.6.6. Recent Initiatives, Funding/VC Activities, and Technological Innovations
    7. 7.7. Prairie Farms Dairy
      1. 7.7.1. Company Overview
      2. 7.7.2. Product/Service Portfolio
      3. 7.7.3. Prairie Farms Dairy Sales, Revenue, Price, and Gross Margin
      4. 7.7.4. Prairie Farms Dairy Revenue and Growth Rate
      5. 7.7.5. Prairie Farms Dairy Market Share
      6. 7.7.6. Recent Initiatives, Funding/VC Activities, and Technological Innovations
    8. 7.8. HP Hood LLC
      1. 7.8.1. Company Overview
      2. 7.8.2. Product/Service Portfolio
      3. 7.8.3. HP Hood LLC Sales, Revenue, Price, and Gross Margin
      4. 7.8.4. HP Hood LLC Revenue and Growth Rate
      5. 7.8.5. HP Hood LLC Market Share
      6. 7.8.6. Recent Initiatives, Funding/VC Activities, and Technological Innovations
    9. 7.9. Cabot Creamery
      1. 7.9.1. Company Overview
      2. 7.9.2. Product/Service Portfolio
      3. 7.9.3. Cabot Creamery Sales, Revenue, Price, and Gross Margin
      4. 7.9.4. Cabot Creamery Revenue and Growth Rate
      5. 7.9.5. Cabot Creamery Market Share
      6. 7.9.6. Recent Initiatives, Funding/VC Activities, and Technological Innovations
    10. 7.10. Barambah Organics Pty Ltd.
      1. 7.10.1. Company Overview
      2. 7.10.2. Product/Service Portfolio
      3. 7.10.3. Barambah Organics Pty Ltd. Sales, Revenue, Price, and Gross Margin
      4. 7.10.4. Barambah Organics Pty Ltd. Revenue and Growth Rate
      5. 7.10.5. Barambah Organics Pty Ltd. Market Share
      6. 7.10.6. Recent Initiatives, Funding/VC Activities, and Technological Innovations
    11. 7.11. Meggle
      1. 7.11.1. Company Overview
      2. 7.11.2. Product/Service Portfolio
      3. 7.11.3. Meggle Sales, Revenue, Price, and Gross Margin
      4. 7.11.4. Meggle Revenue and Growth Rate
      5. 7.11.5. Meggle Market Share
      6. 7.11.6. Recent Initiatives, Funding/VC Activities, and Technological Innovations
  8. Chapter 8 Caps and Closures — Industry Analysis
    1. 8.1. Introduction and Taxonomy
    2. 8.2. Caps and Closures Market – Key Trends
      1. 8.2.1. Market Drivers
      2. 8.2.2. Market Restraints
      3. 8.2.3. Market Opportunities
    3. 8.3. Value Chain Analysis
    4. 8.4. Key Mandates and Regulations
    5. 8.5. Technology Roadmap and Timeline
    6. 8.6. Caps and Closures Market – Attractiveness Analysis
      1. 8.6.1. By Sales Channel
      2. 8.6.2. By Application
      3. 8.6.3. By Region
  9. Chapter 9 Raw Material Analysis
    1. 9.1. Caps and Closures Key Raw Material Analysis
      1. 9.1.1. Key Raw Materials
      2. 9.1.2. Price Trend of Key Raw Materials
    2. 9.2. Key Suppliers of Raw Materials
    3. 9.3. Proportion of Manufacturing Cost Structure
      1. 9.3.1. Raw Materials Cost
      2. 9.3.2. Labor Cost
      3. 9.3.3. Manufacturing Expenses
      4. 9.3.4. Miscellaneous Expenses
    4. 9.4. Manufacturing Cost Analysis of Caps and Closures
  10. Chapter 10 Industrial Chain, Sourcing Strategy, and Downstream Buyers
    1. 10.1. Caps and Closures Industrial Chain Analysis
    2. 10.2. Upstream Raw Materials Sourcing
      1. 10.2.1. Risk Mitigation:
      2. 10.2.2. Supplier Relationships:
      3. 10.2.3. Business Processes:
      4. 10.2.4. Securing the Product:
    3. 10.3. Raw Materials Sources of Caps and Closures Major Manufacturers
    4. 10.4. Downstream Buyers
    5. 10.5. Distributors/Traders List
  11. Chapter 11 Marketing Strategy Analysis, Distributors
    1. 11.1. Marketing Channel
    2. 11.2. Direct Marketing
    3. 11.3. Indirect Marketing
    4. 11.4. Marketing Channel Development Trends
    5. 11.5. Economic/Political Environmental Change
  12. Chapter 12 Report Conclusion & Key Insights
    1. 12.1. Key Insights from Primary Interviews & Surveys Respondents
    2. 12.2. Key Takeaways from Analysts, Consultants, and Industry Leaders
  13. Chapter 13 Research Approach & Methodology
    1. 13.1. Report Description
    2. 13.2. Research Scope
    3. 13.3. Research Methodology
      1. 13.3.1. Secondary Research
      2. 13.3.2. Primary Research
      3. 13.3.3. Statistical Models
        1. 13.3.3.1. Company Share Analysis Model
        2. 13.3.3.2. Revenue Based Modeling
      4. 13.3.4. Research Limitations

      List of Figures

      Fig.1	Product Picture of Caps and Closures
      Fig.2	Global Caps and Closures Market, 2016 – 2026 (USD Billion)
      Fig.3	Global Caps and Closures Market, 2016 – 2026 (Million Units)
      Fig.4	Global Caps and Closures Market Absolute Revenue Opportunity, 2016 – 2026 (USD Billion)
      Fig.5	Global Caps and Closures Market Incremental Revenue Opportunity, 2020 – 2026 (USD Billion)
      Fig.6	Global Caps and Closures Market Share, by Sales Channel, 2020 & 2026 (USD Billion)
      Fig.7	Global Caps and Closures Market Share, by Sales Channel, 2020 & 2026 (Million Units)
      Fig.8	Global Premium Food Service Caps and Closures Market, 2016 – 2026 (USD Billion)
      Fig.9	Global Premium Food Service Caps and Closures Market, 2016 – 2026 (Million Units)
      Fig.10	Global Non Premium Food Service Caps and Closures Market, 2016 – 2026 (USD Billion)
      Fig.11	Global Non Premium Food Service Caps and Closures  Market, 2016 – 2026 (Million Units)
      Fig.12	Global B2B Caps and Closures Market, 2016 – 2026 (USD Billion)
      Fig.13	Global B2B Caps and Closures  Market, 2016 – 2026 (Million Units)
      Fig.14	Global Caps and Closures Market Share, by Application, 2020 & 2026 (USD Billion)
      Fig.15	Global Caps and Closures Market Share, by Application, 2020 & 2026 (Million Units)
      Fig.16	Global Savory Caps and Closures Market, 2016 – 2026 (USD Billion)
      Fig.17	Global Savory Caps and Closures  Market, 2016 – 2026 (Million Units)
      Fig.18	Global Sandwich Caps and Closures Market, 2016 – 2026 (USD Billion)
      Fig.19	Global Sandwich Caps and Closures  Market, 2016 – 2026 (Million Units)
      Fig.20	Global Salad Dressings & Dip Caps and Closures Market, 2016 – 2026 (USD Billion)
      Fig.21	Global Salad Dressings & Dip Caps and Closures  Market, 2016 – 2026 (Million Units)
      Fig.22	Global Baked Goods/Desserts Caps and Closures Market, 2016 – 2026 (USD Billion)
      Fig.23	Global Baked Goods/Desserts Caps and Closures  Market, 2016 – 2026 (Million Units)
      Fig.24	Global Ice Creams & Smoothies Caps and Closures Market, 2016 – 2026 (USD Billion)
      Fig.25	Global Ice Creams & Smoothies Caps and Closures  Market, 2016 – 2026 (Million Units)
      Fig.26	Global Caps and Closures Market Share, by Region, 2020 & 2026 (USD Billion)
      Fig.27	Global Caps and Closures Market Share, by Region, 2020 & 2026 (Million Units)
      Fig.28	North America Caps and Closures Market, 2016 – 2026 (USD Billion)
      Fig.29	North America Caps and Closures Market, 2016 – 2026 (Million Units)
      Fig.30	U.S. Caps and Closures Market, 2016 – 2026 (USD Billion)
      Fig.31	U.S. Caps and Closures  Market, 2016 – 2026 (Million Units)
      Fig.32	Canada Caps and Closures Market, 2016 – 2026 (USD Billion)
      Fig.33	Canada Caps and Closures  Market, 2016 – 2026 (Million Units)
      Fig.34	Europe Caps and Closures Market, 2016 – 2026 (USD Billion)
      Fig.35	Europe Caps and Closures  Market, 2016 – 2026 (Million Units)
      Fig.36	Germany Caps and Closures Market, 2016 – 2026 (USD Billion)
      Fig.37	Germany Caps and Closures  Market, 2016 – 2026 (Million Units)
      Fig.38	France Caps and Closures Market, 2016 – 2026 (USD Billion)
      Fig.39	France Caps and Closures  Market, 2016 – 2026 (Million Units)
      Fig.40	U.K. Caps and Closures Market, 2016 – 2026 (USD Billion)
      Fig.41	U.K. Caps and Closures  Market, 2016 – 2026 (Million Units)
      Fig.42	Italy Caps and Closures Market, 2016 – 2026 (USD Billion)
      Fig.43	Italy Caps and Closures  Market, 2016 – 2026 (Million Units)
      Fig.44	Spain Caps and Closures Market, 2016 – 2026 (USD Billion)
      Fig.45	Spain Caps and Closures  Market, 2016 – 2026 (Million Units)
      Fig.46	Rest of Europe Caps and Closures Market, 2016 – 2026 (USD Billion)
      Fig.47	Rest of Europe Caps and Closures  Market, 2016 – 2026 (Million Units)
      Fig.48	Asia Pacific Caps and Closures Market, 2016 – 2026 (USD Billion)
      Fig.49	Asia Pacific Caps and Closures  Market, 2016 – 2026 (Million Units)
      Fig.50	China Caps and Closures Market, 2016 – 2026 (USD Billion)
      Fig.51	China Caps and Closures  Market, 2016 – 2026 (Million Units)
      Fig.52	India Caps and Closures Market, 2016-2026 (USD Billion)
      Fig.53	India Caps and Closures  Market, 2016 – 2026 (Million Units)
      Fig.54	Japan Caps and Closures Market, 2016 – 2026 (USD Billion)
      Fig.55	Japan Caps and Closures  Market, 2016 – 2026 (Million Units)
      Fig.56	South Korea Caps and Closures Market, 2016 – 2026 (USD Billion)
      Fig.57	South Korea Caps and Closures  Market, 2016 – 2026 (Million Units)
      Fig.58	South-East Asia Caps and Closures Market, 2016 – 2026 (USD Billion)
      Fig.59	South-East Asia Caps and Closures  Market, 2016 – 2026 (Million Units)
      Fig.60	Rest of Asia Pacific Caps and Closures Market, 2016 – 2026 (USD Billion)
      Fig.61	Rest of Asia Pacific Caps and Closures  Market, 2016 – 2026 (Million Units)
      Fig.62	Latin America Caps and Closures Market, 2016 – 2026 (USD Billion)
      Fig.63	Latin America Caps and Closures  Market, 2016 – 2026 (Million Units)
      Fig.64	Brazil Caps and Closures Market, 2016 – 2026 (USD Billion)
      Fig.65	Brazil Caps and Closures  Market, 2016 – 2026 (Million Units)
      Fig.66	Mexico Caps and Closures Market, 2016 – 2026 (USD Billion)
      Fig.67	Mexico Caps and Closures  Market, 2016 – 2026 (Million Units)
      Fig.68	Rest of Latin America Caps and Closures Market, 2016 – 2026 (USD Billion)
      Fig.69	Rest of Latin America Caps and Closures  Market, 2016 – 2026 (Million Units)
      Fig.70	Middle East & Africa Caps and Closures Market, 2016 – 2026 (USD Billion)
      Fig.71	Middle East & Africa Caps and Closures  Market, 2016 – 2026 (Million Units)
      Fig.72	GCC Caps and Closures Market, 2016 – 2026 (USD Billion)
      Fig.73	GCC Caps and Closures Market, 2016 – 2026 (Million Units)
      Fig.74	South Africa Caps and Closures Market, 2016 – 2026 (USD Billion)
      Fig.75	South Africa Caps and Closures  Market, 2016 – 2026 (Million Units)
      Fig.76	Rest of Middle East & Africa Caps and Closures Market, 2016 – 2026 (USD Billion)
      Fig.77	Rest of Middle East & Africa Caps and Closures Market, 2016 – 2026 (Million Units)
      Fig.78	Global Caps and Closures Production and Consumption, 2016 – 2026 (Million Units)
      Fig.79	North America Caps and Closures Production and Consumption, 2016 – 2026 (Million Units)
      Fig.80	Europe Caps and Closures Production and Consumption, 2016 – 2026 (USD Billion) (Million Units)
      Fig.81	Asia Pacific Caps and Closures Production and Consumption, 2016 – 2026 (USD Billion) (Million Units)
      Fig.82	Latin America Caps and Closures Production and Consumption, 2016 – 2026 (USD Billion) (Million Units)
      Fig.83	Middle East and Africa Caps and Closures Production and Consumption, 2016 – 2026 (USD Billion) (Million Units)
      Fig.84	Competitor Market Share – Revenue
      Fig.85	Competitor Market Share – Volume
      Fig.86	Daisy Brand LLC Revenue and Growth Rate
      Fig.87	Daisy Brand LLC Market Share
      Fig.88	Market Dynamics
      Fig.89	Global Caps and Closures – Value Chain Analysis
      Fig.90	Key Mandates and Regulations
      Fig.91	Technology Roadmap and Timeline
      Fig.92	Market Attractiveness Analysis – By Sales Channel
      Fig.93	Market Attractiveness Analysis – By Application
      Fig.94	Market Attractiveness Analysis – By Region
      Fig.95	Manufacturing Cost Structure of Caps and Closures
      Fig.96	Caps and Closures Industrial Chain Analysis
      Fig.97	Market Channels
      Fig.98	Marketing Channel Development Trend
      Fig.99	Growth in World Gross Product, 2008-2018
      

      List of Tables

      Table 1	Global Caps and Closures Market, 2020 & 2026 (USD Billion)
      Table 2	Global Caps and Closures Market, by Sales Channel, 2016 – 2026 (USD Billion)
      Table 3	Global Caps and Closures Market, by Sales Channel, 2016 – 2026 (Million Units)
      Table 4	Global Caps and Closures Market, by Application, 2016 – 2026 (USD Billion)
      Table 5	Global Caps and Closures Market, by Application, 2016 – 2026 (Million Units)
      Table 6	Global Caps and Closures Market, by Region, 2016 – 2026 (USD Billion)
      Table 7	Global Caps and Closures Market, by Region, 2016 – 2026 (Million Units)
      Table 8	North America Caps and Closures Market, by Country, 2016 – 2026 (USD Billion)
      Table 9	North America Caps and Closures Market, by Country, 2016 – 2026 (Million Units)
      Table 10 North America Caps and Closures Market, by Sales Channel, 2016 – 2026 (USD Billion)
      Table 11 North America Caps and Closures Market, by Sales Channel, 2016 – 2026 (Million Units)
      Table 12 North America Caps and Closures Market, by Application, 2016 – 2026 (USD Billion)
      Table 13 North America Caps and Closures Market, by Application, 2016 – 2026 (Million Units)
      Table 14 Europe Caps and Closures Market, by Country, 2016 – 2026 (USD Billion)
      Table 15 Europe Caps and Closures Market, by Country, 2016 – 2026 (Million Units)
      Table 16 Europe Caps and Closures Market, by Sales Channel, 2016 – 2026 (USD Billion)
      Table 17 Europe Caps and Closures Market, by Sales Channel, 2016 – 2026 (Million Units)
      Table 18 Europe Caps and Closures Market, by Application, 2016 – 2026 (USD Billion)
      Table 19 Europe Caps and Closures Market, by Application, 2016 – 2026 (Million Units)
      Table 20 Asia Pacific Caps and Closures Market, by Country, 2016 – 2026 (USD Billion)
      Table 21 Europe Caps and Closures Market, by Country, 2016 – 2026 (Million Units)
      Table 22 Asia Pacific Caps and Closures Market, by Sales Channel, 2016 – 2026 (USD Billion)
      Table 23 Asia Pacific Caps and Closures Market, by Sales Channel, 2016 – 2026 (Million Units)
      Table 24 Asia Pacific Caps and Closures Market, by Application (Recipes), 2016 – 2026 (USD Billion)
      Table 25 Asia Pacific Caps and Closures Market, by Application, 2016 – 2026 (Million Units)
      Table 26 Latin America Caps and Closures Market, by Country, 2016 – 2026 (USD Billion)
      Table 27 Latin America Caps and Closures Market, by Country, 2016 – 2026 (Million Units)
      Table 28 Latin America Caps and Closures Market, by Sales Channel, 2016 – 2026 (USD Billion)
      Table 29 Latin America Caps and Closures Market, by Sales Channel, 2016 – 2026 (Million Units)
      Table 30 Latin America Caps and Closures Market, by Application, 2016 – 2026 (USD Billion)
      Table 31 Latin America Caps and Closures Market, by Application, 2016 – 2026 (Million Units)
      Table 32 Middle East & Africa Caps and Closures Market, by Country, 2016 – 2026 (USD Billion)
      Table 33 Middle East & Africa Caps and Closures Market, by Country, 2016 – 2026 (Million Units)
      Table 34 Middle East & Africa Caps and Closures Market, by Sales Channel, 2016 – 2026 (USD Billion)
      Table 35 Middle East & Africa Caps and Closures Market, by Sales Channel, 2016 – 2026 (Million Units)
      Table 36 Middle East & Africa Caps and Closures Market, by Application, 2016 – 2026 (USD Billion)
      Table 37 Middle East & Africa Caps and Closures Market, by Application, 2016 – 2026 (Million Units)
      Table 38 North America Caps and Closures Production, Consumption, Export, Import, 2016 – 2019
      Table 39 Europe Caps and Closures Production, Consumption, Export, Import, 2016 – 2019
      Table 40 Asia Pacific Caps and Closures Production, Consumption, Export, Import, 2016 – 2019
      Table 41 Latin America Caps and Closures Production, Consumption, Export, Import, 2016 – 2019
      Table 42 Middle East & Africa Caps and Closures Production, Consumption, Export, Import, 2016 – 2019
      Table 43 Global Caps and Closures Market - Company Revenue Analysis, 2016 – 2019 (USD Billion)
      Table 44 Global Caps and Closures Market - Company Revenue Share Analysis, 2016 – 2019 (%)
      Table 45 Global Caps and Closures Market - Company Volume Analysis, 2016 – 2019 (Million Units)
      Table 46 Global Caps and Closures Market - Company Volume Share Analysis, 2016 – 2019 (%)
      Table 47 Acquisitions and Mergers
      Table 48 Market Drivers – Impact Analysis
      Table 49 Market Restraints
      Table 50 Market Opportunities
      Table 51 Production Base and Market Concentration Rate of Raw Material
      Table 52 Key Suppliers of Raw Materials
      Table 53 Raw Materials Sources of Caps and Closures Major Manufacturers
      Table 54 Major Buyers of Caps and Closures
      Table 55 Distributors/Traders of Caps and Closures by Region
      

Industry Major Market Players

  • Agropur Cooperative
  • Amcor Limited
  • AptarGroup Inc.
  • BERICAP GmbH Co. & KG
  • Berry Plastics Corporation
  • Blackhawk Molding Company Incorporated
  • Capsugel Inc.
  • Cap & Seal Pvt. Ltd.
  • Closure Systems International
  • Crown Holdings Incorporation
  • Guala Closures Group
  • Oriental Containers
  • Pact Group Holdings
  • Phoenix Closures
  • Pelliconi
  • Plastics Corporation
  • Plastic Closures Limited
  • Premier Vinyl Solution
  • Rexam PLC
  • Reynolds Group Holdings Limited