Search Market Research Report

Discover Our Latest Reports
Discover Our Featured Reports
Discover Top Selling Reports

B2B Mobility Sharing Market Size, Share Global Analysis Report, , 2020 – 2026

report img

B2B Mobility Sharing Market By Type (Car Leasing/Car Rental, Ride Sourcing, and Ride Sharing), By Service Type (Passenger Transportation, and Goods Transportation), and By Vehicle Type (Passenger Vehicle, Light Commercial Vehicle, Heavy Commercial Vehicle, Shuttles, Buses/Coaches, and Others): Global Industry Perspective, Comprehensive Analysis, and Forecast, 2020 – 2026

Industry Insights

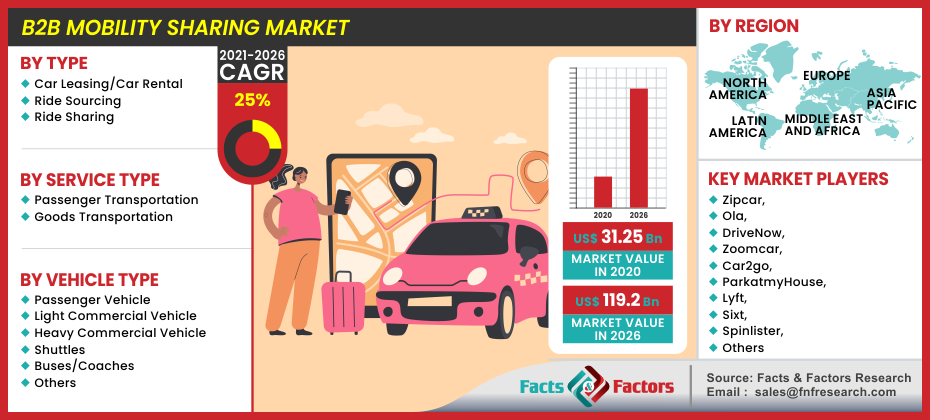
[218+ Pages Report] According to the latest report issued by Facts and Factors, the global B2B Mobility Sharing Market stood at about USD 31.25 Billion in 2020 and is expected to generate the value of an estimated USD 119.2 Billion by end of 2026, growing at a CAGR of around 25% between 2021 and 2026.

logoMarket Overview               

Customers can rent a vehicle for a specific distance or time in return for money through mobility sharing. Due to growing digitization and the rising cost of vehicle ownership, the mobility sharing market is booming. Because of the growing adoption of cell phones and the large population in APAC, the mobility sharing market is expected to expand rapidly.

logoIndustry Growth Factors

The rise in traffic congestion has pushed the market for shared mobility forward. According to a report, in 2019, the travel times in Mexico City are 52 percent longer during rush hour, rendering it the most congested city in North America. Although this number applies to extra average travel time during the day, evening peak hours make driving 87 percent longer on average. Los Angeles and Vancouver, respectively, on the West Coast, are the most congested cities in the United States and Canada. The market is being driven by an increase in demand for ride-sharing services combined with a reduction in parking space. Businesses use car-sharing systems to commute their workers regularly, reducing fleet time and parking costs. Furthermore, in Europe and North America, governments have enacted strict pollution control regulations, incentives provided by the government in the United States to use car-sharing, automobile manufacturers in Germany are increasing their investments in car sharing, heavy traffic congestion and pollution in China leading the people to opt for urban mobility. The lack of adequate public transportation infrastructure in India, as well as changing regulations in Malaysia and Singapore, are major factors that are driving the market growth substantially. In addition, owing to reduced traveling costs, people are opting for ride-sharing. The surge in the adoption of vehicles enabled with advanced technologies is also contributing to the market. For instance, BMW, a vehicle manufacturer had launched “ReachNow arm” which offers car-sharing and ride-hailing services across the USA in July 2018.

B2B Mobility Sharing Market

To know more about this report | Request Free Sample Copy

Rising vehicle ownership costs are enabling people to use solutions that enable them to share a variety of modes of transportation. Furthermore, solutions allow users to book, change, and cancel reservations in real-time. Ride-hailing services are widely used, especially in emerging economies like India and Mexico. The market's growth may be hampered by a lack of knowledge about the advantages of such service models over the forecast period. Furthermore, individuals are hesitant to share their cars with strangers in the case of ride-sharing, resulting in a decrease in the number of vehicles involved in the segment. In some low-income countries in the Middle East and Africa, poor connectivity and high costs associated with internet infrastructure growth are also preventing the market from reaching its full potential. Various government policies promoting shared resources are serving as catalysts for the industry's restructuring. For example, the European Commission and government agencies such as the Center on Regulation in Europe (CERRE) have begun to provide incentives to vehicle owners to promote the adoption of these services. Henceforth certain factors are contributing to the growth of the market in recent years and are expected to maintain the trend.

logoSegmentation Analysis

The global B2B mobility sharing market has been categorized into service type, type, vehicle type, and region. In terms of type, the industry has been categorized into car leasing or car rental, ride-sourcing, and ride-sharing. In a car rental service, businesses rent or lease a vehicle for a set period of time, while in a car-sharing service; many passengers share the same vehicle at the same time to get to their desired location. In terms of service type, the B2B mobility sharing market can be divided into two types of services: goods transportation, and passenger transportation. The services provided by businesses or organizations may be classified according to the customer's requirements. Some businesses use automobiles to transport their workers, while others use automobiles to transport their goods and services. The B2B mobility sharing market is categorized into passenger vehicles, heavy commercial vehicles, light commercial vehicles, buses/coaches, and shuttles based on vehicle type.

logo Regional Analysis

The Asia Pacific market is expected to account for the largest revenue share. In countries like India and China, on-road vehicle traffic and vehicle ownership costs are constantly rising. Furthermore, countries like India, where the urban population is growing and transportation infrastructure is improving, have a lot of room for growth in these services. From 2021 to 2026, the Middle Eastern and African market is projected to grow at a significant rate. Demand for shared transportation solutions is surging in countries like the United Arab Emirates and South Africa, owing to an increase in the number of corporate travelers. Furthermore, the UAE government's increased emphasis on developing alternative mobility forms to reduce traffic congestion and greenhouse gas (GHG) emissions is expected to boost the regional market during the forecast period. Ride-hailing services are becoming increasingly popular around the world, owing to their effectiveness in reducing the number of vehicles on the road, resulting in reduced emissions and traffic congestion. Several countries in North America and Europe are experiencing substantial traffic congestion, resulting in significant greenhouse gas emissions, which leads to an increase in global temperature. As a result, governments are focusing on shared mobility services, which is leading the B2B mobility sharing market.

logoReport Scope

Report Attribute

Details

Market Size in 2020

USD 31.25 Billion

Projected Market Size in 2026

USD 119.2 Billion

CAGR Growth Rate

25% CAGR

Base Year

2020

Forecast Years

2020-2026

Key Market Players

Zipcar, Ola, DriveNow, Zoomcar, Car2go, ParkatmyHouse, Lyft, Sixt, Spinlister, Uber, Drivezy, Volercars, SKedGo Pty Ltd, Tranzer, Rapido, Jenzabar, We Trott amongst others.

Key Segment

By Type, By Service Type, By Vehicle Type, By Region

Major Regions Covered

North America, Europe, Asia Pacific, Latin America, and the Middle East & Africa

Purchase Options

Request customized purchase options to meet your research needs. Explore purchase options

logo Competitive Players

Some main participants of the global B2B Mobility Sharing market are :

  • Zipcar
  • Ola
  • DriveNow
  • Zoomcar
  • Car2go
  • ParkatmyHouse
  • Lyft
  • Sixt
  • Spinlister
  • Uber
  • Drivezy
  • Volercars
  • SKedGo Pty Ltd
  • Tranzer
  • Rapido
  • Jenzabar

logoThe global B2B mobility sharing market is segmented as follows:

logoBy Type:

  • Car Leasing/Car Rental
  • Ride Sourcing
  • Ride Sharing

logoBy Service Type:

  • Passenger Transportation
  • Goods Transportation

logoBy Vehicle Type:

  • Passenger Vehicle
  • Light Commercial Vehicle
  • Heavy Commercial Vehicle
  • Shuttles
  • Buses/Coaches
  • Others

logoBy Region:

  • North America
    • U.S.
    • Canada
  • Europe
    • UK
    • France
    • Germany
    • Italy
    • Spain
    • Rest of Europe
  • Asia Pacific
    • China
    • Japan
    • India
    • South Korea
    • Southeast Asia
    • Rest of Asia Pacific
  • Latin America
    • Brazil
    • Mexico
    • Rest of Latin America
  • Middle East and Africa
    • GCC Countries
    • South Africa
    • Rest of MEA

Table of Content

  1. Chapter 1 Executive Summary
    1. 1.1. Introduction of B2B Mobility Sharing
    2. 1.2. Global B2B Mobility Sharing Market, 2020 - 2026 (USD Billion)
    3. 1.3. Global B2B Mobility Sharing Market, 2016 – 2026 (USD Billion)
    4. 1.4. Global B2B Mobility Sharing Market Absolute Revenue Opportunity, 2016 – 2026 (USD Billion)
    5. 1.5. Global B2B Mobility Sharing Market Incremental Revenue Opportunity, 2020 – 2026 (USD Billion)
  2. Chapter 2 B2B Mobility Sharing Market – Type Analysis
    1. 2.1. Global B2B Mobility Sharing Market – Type Overview
    2. 2.2. Global B2B Mobility Sharing Market Share, by Type, 2020 - 2026 (USD Billion)
    3. 2.3. Car Leasing/Car Rental
      1. 2.3.1. Global Car Leasing/Car Rental B2B Mobility Sharing Market, 2016 – 2026 (USD Billion)
    4. 2.4. Ride Sourcing
      1. 2.4.1. Global Ride Sourcing B2B Mobility Sharing Market, 2016 – 2026 (USD Billion)
    5. 2.5. Ride Sharing
      1. 2.5.1. Global Ride Sharing B2B Mobility Sharing Market, 2016 – 2026 (USD Billion)
  3. Chapter 3 B2B Mobility Sharing Market – Service Type Analysis
    1. 3.1. Global B2B Mobility Sharing Market – Service Type Overview
    2. 3.2. Global B2B Mobility Sharing Market Share, by Service Type, 2020 - 2026 (USD Billion)
    3. 3.3. Passenger Transportation
      1. 3.3.1. Global Passenger Transportation B2B Mobility Sharing Market, 2016 – 2026 (USD Billion)
    4. 3.4. Goods Transportation
      1. 3.4.1. Global Goods Transportation B2B Mobility Sharing Market, 2016 – 2026 (USD Billion)
  4. Chapter 4 B2B Mobility Sharing Market – Vehicle Type Analysis
    1. 4.1. Global B2B Mobility Sharing Market – Vehicle Type Overview
    2. 4.2. Global B2B Mobility Sharing Market Share, by Vehicle Type, 2020 - 2026 (USD Billion)
    3. 4.3. Passenger Vehicle
      1. 4.3.1. Global Passenger Vehicle B2B Mobility Sharing Market, 2016 – 2026 (USD Billion)
    4. 4.4. Light Commercial Vehicle
      1. 4.4.1. Global Light Commercial Vehicle B2B Mobility Sharing Market, 2016 – 2026 (USD Billion)
    5. 4.5. Heavy Commercial Vehicle
      1. 4.5.1. Global Heavy Commercial Vehicle B2B Mobility Sharing Market, 2016 – 2026 (USD Billion)
    6. 4.6. Shuttles
      1. 4.6.1. Global Shuttles B2B Mobility Sharing Market, 2016 – 2026 (USD Billion)
    7. 4.7. Buses/Coaches
      1. 4.7.1. Global Buses/Coaches B2B Mobility Sharing Market, 2016 – 2026 (USD Billion)
  5. Chapter 5 B2B Mobility Sharing Market – Regional Analysis
    1. 5.1. Global B2B Mobility Sharing Market Regional Overview
    2. 5.2. Global B2B Mobility Sharing Market Share, by Region, 2020 - 2026 (USD Billion)
    3. 5.3. North America
      1. 5.3.1. North America B2B Mobility Sharing Market, 2016 – 2026 (USD Billion)
        1. 5.3.1.1. North America B2B Mobility Sharing Market, by Country, 2016 - 2026 (USD Billion)
      2. 5.3.2. North America B2B Mobility Sharing Market, by Type, 2016 – 2026
        1. 5.3.2.1. North America B2B Mobility Sharing Market, by Type, 2016 – 2026 (USD Billion)
      3. 5.3.3. North America B2B Mobility Sharing Market, by Service Type, 2016 – 2026
        1. 5.3.3.1. North America B2B Mobility Sharing Market, by Service Type, 2016 – 2026 (USD Billion)
      4. 5.3.4. North America B2B Mobility Sharing Market, by Vehicle Type, 2016 – 2026
        1. 5.3.4.1. North America B2B Mobility Sharing Market, by Vehicle Type, 2016 – 2026 (USD Billion)
      5. 5.3.5. U.S.
        1. 5.3.5.1. U.S. B2B Mobility Sharing Market, 2016 – 2026 (USD Billion)
      6. 5.3.6. Canada
        1. 5.3.6.1. Canada B2B Mobility Sharing Market, 2016 – 2026 (USD Billion)
    4. 5.4. Europe
      1. 5.4.1. Europe B2B Mobility Sharing Market, 2016 – 2026 (USD Billion)
        1. 5.4.1.1. Europe B2B Mobility Sharing Market, by Country, 2016 - 2026 (USD Billion)
      2. 5.4.2. Europe B2B Mobility Sharing Market, by Type, 2016 – 2026
        1. 5.4.2.1. Europe B2B Mobility Sharing Market, by Type, 2016 – 2026 (USD Billion)
      3. 5.4.3. Europe B2B Mobility Sharing Market, by Service Type, 2016 – 2026
        1. 5.4.3.1. Europe B2B Mobility Sharing Market, by Service Type, 2016 – 2026 (USD Billion)
      4. 5.4.4. Europe B2B Mobility Sharing Market, by Vehicle Type, 2016 – 2026
        1. 5.4.4.1. Europe B2B Mobility Sharing Market, by Vehicle Type, 2016 – 2026 (USD Billion)
      5. 5.4.5. Germany
        1. 5.4.5.1. Germany B2B Mobility Sharing Market, 2016 – 2026 (USD Billion)
      6. 5.4.6. France
        1. 5.4.6.1. France B2B Mobility Sharing Market, 2016 – 2026 (USD Billion)
      7. 5.4.7. U.K.
        1. 5.4.7.1. U.K. B2B Mobility Sharing Market, 2016 – 2026 (USD Billion)
      8. 5.4.8. Italy
        1. 5.4.8.1. Italy B2B Mobility Sharing Market, 2016 – 2026 (USD Billion)
      9. 5.4.9. Spain
        1. 5.4.9.1. Spain B2B Mobility Sharing Market, 2016 – 2026 (USD Billion)
      10. 5.4.10. Rest of Europe
        1. 5.4.10.1. Rest of Europe B2B Mobility Sharing Market, 2016 – 2026 (USD Billion)
    5. 5.5. Asia Pacific
      1. 5.5.1. Asia Pacific B2B Mobility Sharing Market, 2016 – 2026 (USD Billion)
        1. 5.5.1.1. Asia Pacific B2B Mobility Sharing Market, by Country, 2016 - 2026 (USD Billion)
      2. 5.5.2. Asia Pacific B2B Mobility Sharing Market, by Type, 2016 – 2026
        1. 5.5.2.1. Asia Pacific B2B Mobility Sharing Market, by Type, 2016 – 2026 (USD Billion)
      3. 5.5.3. Asia Pacific B2B Mobility Sharing Market, by Service Type, 2016 – 2026
        1. 5.5.3.1. Asia Pacific B2B Mobility Sharing Market, by Service Type, 2016 – 2026 (USD Billion)
      4. 5.5.4. Asia Pacific B2B Mobility Sharing Market, by Vehicle Type, 2016 – 2026
        1. 5.5.4.1. Asia Pacific B2B Mobility Sharing Market, by Vehicle Type, 2016 – 2026 (USD Billion)
      5. 5.5.5. China
        1. 5.5.5.1. China B2B Mobility Sharing Market, 2016 – 2026 (USD Billion)
      6. 5.5.6. Japan
        1. 5.5.6.1. Japan B2B Mobility Sharing Market, 2016 – 2026 (USD Billion)
      7. 5.5.7. India
        1. 5.5.7.1. India B2B Mobility Sharing Market, 2016 – 2026 (USD Billion)
      8. 5.5.8. South Korea
        1. 5.5.8.1. South Korea B2B Mobility Sharing Market, 2016 – 2026 (USD Billion)
      9. 5.5.9. South-East Asia
        1. 5.5.9.1. South-East Asia B2B Mobility Sharing Market, 2016 – 2026 (USD Billion)
      10. 5.5.10. Rest of Asia Pacific
        1. 5.5.10.1. Rest of Asia Pacific B2B Mobility Sharing Market, 2016 – 2026 (USD Billion)
    6. 5.6. Latin America
      1. 5.6.1. Latin America B2B Mobility Sharing Market, 2016 – 2026 (USD Billion)
        1. 5.6.1.1. Latin America B2B Mobility Sharing Market, by Country, 2016 - 2026 (USD Billion)
      2. 5.6.2. Latin America B2B Mobility Sharing Market, by Type, 2016 – 2026
        1. 5.6.2.1. Latin America B2B Mobility Sharing Market, by Type, 2016 – 2026 (USD Billion)
      3. 5.6.3. Latin America B2B Mobility Sharing Market, by Service Type, 2016 – 2026
        1. 5.6.3.1. Latin America B2B Mobility Sharing Market, by Service Type, 2016 – 2026 (USD Billion)
      4. 5.6.4. Latin America B2B Mobility Sharing Market, by Vehicle Type, 2016 – 2026
        1. 5.6.4.1. Latin America B2B Mobility Sharing Market, by Vehicle Type, 2016 – 2026 (USD Billion)
      5. 5.6.5. Brazil
        1. 5.6.5.1. Brazil B2B Mobility Sharing Market, 2016 – 2026 (USD Billion)
      6. 5.6.6. Mexico
        1. 5.6.6.1. Mexico B2B Mobility Sharing Market, 2016 – 2026 (USD Billion)
      7. 5.6.7. Rest of Latin America
        1. 5.6.7.1. Rest of Latin America B2B Mobility Sharing Market, 2016 – 2026 (USD Billion)
    7. 5.7. The Middle-East and Africa
      1. 5.7.1. The Middle-East and Africa B2B Mobility Sharing Market, 2016 – 2026 (USD Billion)
        1. 5.7.1.1. The Middle-East and Africa B2B Mobility Sharing Market, by Country, 2016 - 2026 (USD Billion)
      2. 5.7.2. The Middle-East and Africa B2B Mobility Sharing Market, by Type, 2016 – 2026
        1. 5.7.2.1. The Middle-East and Africa B2B Mobility Sharing Market, by Type, 2016 – 2026 (USD Billion)
      3. 5.7.3. The Middle-East and Africa B2B Mobility Sharing Market, by Service Type, 2016 – 2026
        1. 5.7.3.1. The Middle-East and Africa B2B Mobility Sharing Market, by Service Type, 2016 – 2026 (USD Billion)
      4. 5.7.4. The Middle-East and Africa B2B Mobility Sharing Market, by Vehicle Type, 2016 – 2026
        1. 5.7.4.1. The Middle-East and Africa B2B Mobility Sharing Market, by Vehicle Type, 2016 – 2026 (USD Billion)
      5. 5.7.5. GCC Countries
        1. 5.7.5.1. GCC Countries B2B Mobility Sharing Market, 2016 – 2026 (USD Billion)
      6. 5.7.6. South Africa
        1. 5.7.6.1. South Africa B2B Mobility Sharing Market, 2016 – 2026 (USD Billion)
      7. 5.7.7. Rest of Middle-East Africa
        1. 5.7.7.1. Rest of Middle-East Africa B2B Mobility Sharing Market, 2016 – 2026 (USD Billion)
  6. Chapter 6 B2B Mobility Sharing Market – Competitive Landscape
    1. 6.1. Competitor Market Share – Revenue
    2. 6.2. Market Concentration Rate Analysis, Top 3 and Top 5 Players
    3. 6.3. Strategic Developments
      1. 6.3.1. Acquisitions and Mergers
      2. 6.3.2. New Products
      3. 6.3.3. Research & Development Activities
  7. Chapter 7 Company Profiles
    1. 7.1. DriveNow
      1. 7.1.1. Company Overview
      2. 7.1.2. Product/Service Portfolio
      3. 7.1.3. DriveNow Sales, Revenue, and Gross Margin
      4. 7.1.4. DriveNow Revenue and Growth Rate
      5. 7.1.5. DriveNow Market Share
      6. 7.1.6. Recent Initiatives, Funding/VC Activities, and Technological Innovations
    2. 7.2. Zipcar
      1. 7.2.1. Company Overview
      2. 7.2.2. Product/Service Portfolio
      3. 7.2.3. Zipcar Sales, Revenue, and Gross Margin
      4. 7.2.4. Zipcar Revenue and Growth Rate
      5. 7.2.5. Zipcar Market Share
      6. 7.2.6. Recent Initiatives, Funding/VC Activities, and Technological Innovations
    3. 7.3. Zoomcar
      1. 7.3.1. Company Overview
      2. 7.3.2. Product/Service Portfolio
      3. 7.3.3. Zoomcar Sales, Revenue, and Gross Margin
      4. 7.3.4. Zoomcar Revenue and Growth Rate
      5. 7.3.5. Zoomcar Market Share
      6. 7.3.6. Recent Initiatives, Funding/VC Activities, and Technological Innovations
    4. 7.4. Car2go
      1. 7.4.1. Company Overview
      2. 7.4.2. Product/Service Portfolio
      3. 7.4.3. Car2go Sales, Revenue, and Gross Margin
      4. 7.4.4. Car2go Revenue and Growth Rate
      5. 7.4.5. Car2go Market Share
      6. 7.4.6. Recent Initiatives, Funding/VC Activities, and Technological Innovations
    5. 7.5. ParkatmyHouse
      1. 7.5.1. Company Overview
      2. 7.5.2. Product/Service Portfolio
      3. 7.5.3. ParkatmyHouse Sales, Revenue, and Gross Margin
      4. 7.5.4. ParkatmyHouse Revenue and Growth Rate
      5. 7.5.5. ParkatmyHouse Market Share
      6. 7.5.6. Recent Initiatives, Funding/VC Activities, and Technological Innovations
    6. 7.6. Spinlister
      1. 7.6.1. Company Overview
      2. 7.6.2. Product/Service Portfolio
      3. 7.6.3. Spinlister Sales, Revenue, and Gross Margin
      4. 7.6.4. Spinlister Revenue and Growth Rate
      5. 7.6.5. Spinlister Market Share
      6. 7.6.6. Recent Initiatives, Funding/VC Activities, and Technological Innovations
    7. 7.7. Lyft
      1. 7.7.1. Company Overview
      2. 7.7.2. Product/Service Portfolio
      3. 7.7.3. Lyft Sales, Revenue, and Gross Margin
      4. 7.7.4. Lyft Revenue and Growth Rate
      5. 7.7.5. Lyft Market Share
      6. 7.7.6. Recent Initiatives, Funding/VC Activities, and Technological Innovations
    8. 7.8. Sixt
      1. 7.8.1. Company Overview
      2. 7.8.2. Product/Service Portfolio
      3. 7.8.3. Sixt Sales, Revenue, and Gross Margin
      4. 7.8.4. Sixt Revenue and Growth Rate
      5. 7.8.5. Sixt Market Share
      6. 7.8.6. Recent Initiatives, Funding/VC Activities, and Technological Innovations
    9. 7.9. Uber
      1. 7.9.1. Company Overview
      2. 7.9.2. Product/Service Portfolio
      3. 7.9.3. Uber Sales, Revenue, and Gross Margin
      4. 7.9.4. Uber Revenue and Growth Rate
      5. 7.9.5. Uber Market Share
      6. 7.9.6. Recent Initiatives, Funding/VC Activities, and Technological Innovations
    10. 7.10. Ola
      1. 7.10.1. Company Overview
      2. 7.10.2. Product/Service Portfolio
      3. 7.10.3. Ola Sales, Revenue, and Gross Margin
      4. 7.10.4. Ola Revenue and Growth Rate
      5. 7.10.5. Ola Market Share
      6. 7.10.6. Recent Initiatives, Funding/VC Activities, and Technological Innovations
    11. 7.11. Drivezy
      1. 7.11.1. Company Overview
      2. 7.11.2. Product/Service Portfolio
      3. 7.11.3. Drivezy Sales, Revenue, and Gross Margin
      4. 7.11.4. Drivezy Revenue and Growth Rate
      5. 7.11.5. Drivezy Market Share
      6. 7.11.6. Recent Initiatives, Funding/VC Activities, and Technological Innovations
    12. 7.12. Volercars
      1. 7.12.1. Company Overview
      2. 7.12.2. Product/Service Portfolio
      3. 7.12.3. Volercars Sales, Revenue, and Gross Margin
      4. 7.12.4. Volercars Revenue and Growth Rate
      5. 7.12.5. Volercars Market Share
      6. 7.12.6. Recent Initiatives, Funding/VC Activities, and Technological Innovations
    13. 7.13. SKedGo Pty Ltd
      1. 7.13.1. Company Overview
      2. 7.13.2. Product/Service Portfolio
      3. 7.13.3. SKedGo Pty Ltd Sales, Revenue, and Gross Margin
      4. 7.13.4. SKedGo Pty Ltd Revenue and Growth Rate
      5. 7.13.5. SKedGo Pty Ltd Market Share
      6. 7.13.6. Recent Initiatives, Funding/VC Activities, and Technological Innovations
    14. 7.14. Tranzer
      1. 7.14.1. Company Overview
      2. 7.14.2. Product/Service Portfolio
      3. 7.14.3. Tranzer Sales, Revenue, and Gross Margin
      4. 7.14.4. Tranzer Revenue and Growth Rate
      5. 7.14.5. Tranzer Market Share
      6. 7.14.6. Recent Initiatives, Funding/VC Activities, and Technological Innovations
    15. 7.15. Rapido
      1. 7.15.1. Company Overview
      2. 7.15.2. Product/Service Portfolio
      3. 7.15.3. Rapido Sales, Revenue, and Gross Margin
      4. 7.15.4. Rapido Revenue and Growth Rate
      5. 7.15.5. Rapido Market Share
      6. 7.15.6. Recent Initiatives, Funding/VC Activities, and Technological Innovations
    16. 7.16. Jenzabar
      1. 7.16.1. Company Overview
      2. 7.16.2. Product/Service Portfolio
      3. 7.16.3. Jenzabar Sales, Revenue, and Gross Margin
      4. 7.16.4. Jenzabar Revenue and Growth Rate
      5. 7.16.5. Jenzabar Market Share
      6. 7.16.6. Recent Initiatives, Funding/VC Activities, and Technological Innovations
    17. 7.17. We Trott
      1. 7.17.1. Company Overview
      2. 7.17.2. Product/Service Portfolio
      3. 7.17.3. We Trott Sales, Revenue, and Gross Margin
      4. 7.17.4. We Trott Revenue and Growth Rate
      5. 7.17.5. We Trott Market Share
      6. 7.17.6. Recent Initiatives, Funding/VC Activities, and Technological Innovations
  8. Chapter 8 B2B Mobility Sharing — Industry Analysis
    1. 8.1. Introduction and Taxonomy
    2. 8.2. B2B Mobility Sharing Market – Key Trends
      1. 8.2.1. Market Drivers
      2. 8.2.2. Market Restraints
      3. 8.2.3. Market Opportunities
    3. 8.3. Value Chain Analysis
    4. 8.4. Key Mandates and Regulations
    5. 8.5. Technology Roadmap and Timeline
    6. 8.6. B2B Mobility Sharing Market – Attractiveness Analysis
      1. 8.6.1. By Type
      2. 8.6.2. By Service Type
      3. 8.6.3. By Vehicle Type
      4. 8.6.4. By Region
  9. Chapter 9 Industrial Chain, Sourcing Strategy, and Downstream Buyers
    1. 9.1. B2B Mobility Sharing Industrial Chain Analysis
    2. 9.2. Downstream Buyers
    3. 9.3. Distributors/Traders List
  10. Chapter 10 Marketing Strategy Analysis
    1. 10.1. Marketing Channel
    2. 10.2. Direct Marketing
    3. 10.3. Indirect Marketing
    4. 10.4. Marketing Channel Development Trends
    5. 10.5. Economic/Political Environmental Change
  11. Chapter 11 Report Conclusion & Key Insights
    1. 11.1. Key Insights from Primary Interviews & Surveys Respondents
    2. 11.2. Key Takeaways from Analysts, Consultants, and Industry Leaders
  12. Chapter 12 Research Approach & Methodology
    1. 12.1. Report Description
    2. 12.2. Research Scope
    3. 12.3. Research Methodology
      1. 12.3.1. Secondary Research
      2. 12.3.2. Primary Research
      3. 12.3.3. Statistical Models
        1. 12.3.3.1. Company Share Analysis Model
        2. 12.3.3.2. Revenue Based Modeling
      4. 12.3.4. Research Limitations

      List of Figures

      Fig.1	Product Picture of B2B Mobility Sharing
      Fig.2	Global B2B Mobility Sharing Market, 2016 – 2026 (USD Billion)
      Fig.3	Global B2B Mobility Sharing Market Absolute Revenue Opportunity, 2016 – 2026 (USD Billion)
      Fig.4	Global B2B Mobility Sharing Market Incremental Revenue Opportunity, 2020 – 2026 (USD Billion)
      Fig.5	Global B2B Mobility Sharing Market Share, by Type, 2020 - 2026 (USD Billion)
      Fig.6	Global Car Leasing/Car Rental B2B Mobility Sharing Market, 2016 – 2026 (USD Billion)
      Fig.7	Global Ride Sourcing B2B Mobility Sharing Market, 2016 – 2026 (USD Billion)
      Fig.8	Global Ride Sharing B2B Mobility Sharing Market, 2016 – 2026 (USD Billion)
      Fig.9	Global B2B Mobility Sharing Market Share, by Service Type, 2020 - 2026 (USD Billion)
      Fig.10	Global Passenger Transportation B2B Mobility Sharing Market, 2016 – 2026 (USD Billion)
      Fig.11	Global Goods Transportation B2B Mobility Sharing Market, 2016 – 2026 (USD Billion)
      Fig.12	Global B2B Mobility Sharing Market Share, by Vehicle Type, 2020 - 2026 (USD Billion)
      Fig.13	Global Passenger Vehicle B2B Mobility Sharing Market, 2016 – 2026 (USD Billion)
      Fig.14	Global Light Commercial Vehicle B2B Mobility Sharing Market, 2016 – 2026 (USD Billion)
      Fig.15	Global Heavy Commercial Vehicle B2B Mobility Sharing Market, 2016 – 2026 (USD Billion)
      Fig.16	Global Shuttles B2B Mobility Sharing Market, 2016 – 2026 (USD Billion)
      Fig.17	Global Buses/Coaches B2B Mobility Sharing Market, 2016 – 2026 (USD Billion)
      Fig.18	Global B2B Mobility Sharing Market Share, by Region, 2020 - 2026 (USD Billion)
      Fig.19	North America B2B Mobility Sharing Market, 2016 – 2026 (USD Billion)
      Fig.20	U.S. B2B Mobility Sharing Market, 2016 – 2026 (USD Billion)
      Fig.21	Canada B2B Mobility Sharing Market, 2016 – 2026 (USD Billion)
      Fig.22	Europe B2B Mobility Sharing Market, 2016 – 2026 (USD Billion)
      Fig.23	Germany B2B Mobility Sharing Market, 2016 – 2026 (USD Billion)
      Fig.24	France B2B Mobility Sharing Market, 2016 – 2026 (USD Billion)
      Fig.25	U.K. B2B Mobility Sharing Market, 2016 – 2026 (USD Billion)
      Fig.26	Italy B2B Mobility Sharing Market, 2016 – 2026 (USD Billion)
      Fig.27	Spain B2B Mobility Sharing Market, 2016 – 2026 (USD Billion)
      Fig.28	Rest of Europe B2B Mobility Sharing Market, 2016 – 2026 (USD Billion)
      Fig.29	Asia Pacific B2B Mobility Sharing Market, 2016 – 2026 (USD Billion)
      Fig.30	China B2B Mobility Sharing Market, 2016 – 2026 (USD Billion)
      Fig.31	Japan B2B Mobility Sharing Market, 2016 – 2026 (USD Billion)
      Fig.32	India B2B Mobility Sharing Market, 2016 – 2026 (USD Billion)
      Fig.33	South  Korea B2B Mobility Sharing Market, 2016 – 2026 (USD Billion)
      Fig.34	South-East Asia B2B Mobility Sharing Market, 2016 – 2026 (USD Billion)
      Fig.35	Rest of Asia Pacific B2B Mobility Sharing Market, 2016 – 2026 (USD Billion)
      Fig.36	Latin America B2B Mobility Sharing Market, 2016 – 2026 (USD Billion)
      Fig.37	Brazil B2B Mobility Sharing Market, 2016 – 2026 (USD Billion)
      Fig.38	Mexico B2B Mobility Sharing Market, 2016 – 2026 (USD Billion)
      Fig.39	Rest of Latin America B2B Mobility Sharing Market, 2016 – 2026 (USD Billion)
      Fig.40	The Middle-East and Africa B2B Mobility Sharing Market, 2016 – 2026 (USD Billion)
      Fig.41	GCC Countries B2B Mobility Sharing Market, 2016 – 2026 (USD Billion)
      Fig.42	South Africa B2B Mobility Sharing Market, 2016 – 2026 (USD Billion)
      Fig.43	Rest of Middle-East Africa B2B Mobility Sharing Market, 2016 – 2026 (USD Billion)
      Fig.44	Competitor Market Share – Revenue
      Fig.45	DriveNow Revenue and Growth Rate
      Fig.46	DriveNow Market Share
      Fig.47	Zipcar Revenue and Growth Rate
      Fig.48	Zipcar Market Share
      Fig.49	Zoomcar Revenue and Growth Rate
      Fig.50	Zoomcar Market Share
      Fig.51	Car2go Revenue and Growth Rate
      Fig.52	Car2go Market Share
      Fig.53	ParkatmyHouse Revenue and Growth Rate
      Fig.54	ParkatmyHouse Market Share
      Fig.55	Spinlister Revenue and Growth Rate
      Fig.56	Spinlister Market Share
      Fig.57	Lyft Revenue and Growth Rate
      Fig.58	Lyft Market Share
      Fig.59	Sixt Revenue and Growth Rate
      Fig.60	Sixt Market Share
      Fig.61	Uber Revenue and Growth Rate
      Fig.62	Uber Market Share
      Fig.63	Ola Revenue and Growth Rate
      Fig.64	Ola Market Share
      Fig.65	Drivezy Revenue and Growth Rate
      Fig.66	Drivezy Market Share
      Fig.67	Volercars Revenue and Growth Rate
      Fig.68	Volercars Market Share
      Fig.69	SKedGo Pty Ltd Revenue and Growth Rate
      Fig.70	SKedGo Pty Ltd Market Share
      Fig.71	Tranzer Revenue and Growth Rate
      Fig.72	Tranzer Market Share
      Fig.73	Rapido Revenue and Growth Rate
      Fig.74	Rapido Market Share
      Fig.75	Jenzabar Revenue and Growth Rate
      Fig.76	Jenzabar Market Share
      Fig.77	We Trott Revenue and Growth Rate
      Fig.78	We Trott Market Share
      Fig.79	Market Dynamics
      Fig.80	Global B2B Mobility Sharing – Value Chain Analysis
      Fig.81	Key Mandates and Regulations
      Fig.82	Technology Roadmap and Timeline
      Fig.83	Market Attractiveness Analysis – By Type
      Fig.84	Market Attractiveness Analysis – By Service Type
      Fig.85	Market Attractiveness Analysis – By Vehicle Type
      Fig.86	Market Attractiveness Analysis – By Region
      Fig.87	B2B Mobility Sharing Industrial Chain Analysis
      Fig.88	Market Channels
      Fig.89	Marketing Channel Development Trend
      Fig.90	Growth in World Gross Product, 2008-2018
      

      List of Tables

      Table 1	Global B2B Mobility Sharing Market, 2020 - 2026 (USD Billion)
      Table 2	Global B2B Mobility Sharing Market, by Type, 2016 – 2026 (USD Billion)
      Table 3	Global B2B Mobility Sharing Market, by Service Type, 2016 – 2026 (USD Billion)
      Table 4	Global B2B Mobility Sharing Market, by Vehicle Type, 2016 – 2026 (USD Billion)
      Table 5	Global B2B Mobility Sharing Market, by Region, 2016 – 2026 (USD Billion)
      Table 6	North America B2B Mobility Sharing Market, by Country, 2016 – 2026 (USD Billion)
      Table 7	North America B2B Mobility Sharing Market, by Type, 2016 – 2026 (USD Billion)
      Table 8	North America B2B Mobility Sharing Market, by Service Type, 2016 – 2026 (USD Billion)
      Table 9	North America B2B Mobility Sharing Market, by Vehicle Type, 2016 – 2026 (USD Billion)
      Table 10 Europe B2B Mobility Sharing Market, by Country, 2016 – 2026 (USD Billion)
      Table 11 Europe B2B Mobility Sharing Market, by Type, 2016 – 2026 (USD Billion)
      Table 12 Europe B2B Mobility Sharing Market, by Service Type, 2016 – 2026 (USD Billion)
      Table 13 Europe B2B Mobility Sharing Market, by Vehicle Type, 2016 – 2026 (USD Billion)
      Table 14 Asia Pacific B2B Mobility Sharing Market, by Country, 2016 – 2026 (USD Billion)
      Table 15 Asia Pacific B2B Mobility Sharing Market, by Type, 2016 – 2026 (USD Billion)
      Table 16 Asia Pacific B2B Mobility Sharing Market, by Service Type, 2016 – 2026 (USD Billion)
      Table 17 Asia Pacific B2B Mobility Sharing Market, by Vehicle Type, 2016 – 2026 (USD Billion)
      Table 18 Latin America B2B Mobility Sharing Market, by Country, 2016 – 2026 (USD Billion)
      Table 19 Latin America B2B Mobility Sharing Market, by Type, 2016 – 2026 (USD Billion)
      Table 20 Latin America B2B Mobility Sharing Market, by Service Type, 2016 – 2026 (USD Billion)
      Table 21 Latin America B2B Mobility Sharing Market, by Vehicle Type, 2016 – 2026 (USD Billion)
      Table 22 The Middle-East and Africa B2B Mobility Sharing Market, by Country, 2016 – 2026 (USD Billion)
      Table 23 The Middle-East and Africa B2B Mobility Sharing Market, by Type, 2016 – 2026 (USD Billion)
      Table 24 The Middle-East and Africa B2B Mobility Sharing Market, by Service Type, 2016 – 2026 (USD Billion)
      Table 25 The Middle-East and Africa B2B Mobility Sharing Market, by Vehicle Type, 2016 – 2026 (USD Billion)
      Table 26 Global B2B Mobility Sharing Market - Company Revenue Analysis, 2016 – 2020 (USD Billion)
      Table 27 Global B2B Mobility Sharing Market - Company Revenue Share Analysis, 2016 – 2020 (%)
      Table 28 Acquisitions and Mergers
      Table 29 Market Drivers – Impact Analysis
      Table 30 Market Restraints
      Table 31 Market Opportunities
      Table 32 Major Buyers of B2B Mobility Sharing
      Table 33 Distributors/Traders of B2B Mobility Sharing by Region
      

Industry Major Market Players

  • Zipcar
  • Ola
  • DriveNow
  • Zoomcar
  • Car2go
  • ParkatmyHouse
  • Lyft
  • Sixt
  • Spinlister
  • Uber
  • Drivezy
  • Volercars
  • SKedGo Pty Ltd
  • Tranzer
  • Rapido
  • Jenzabar