Search Market Research Report

Discover Our Latest Reports
Discover Our Featured Reports
Discover Top Selling Reports

Artificial Intelligence in Retail Market Size, Share Global Analysis Report, , 2020 – 2026

report img

Artificial Intelligence in Retail Market By Type (Offline, and Online), By Technology (Natural Language Processing, Machine Learning and Deep Learning, and Others), By Solution (Customer Relationship Management, Payment Services management, Price Optimization, Product Recommendation and Planning, Supply chain management and Demand Planning, Virtual Assistant, Visual Search, Others ) By Service (Managed Services, and Professional Services), By Deployment Model (On-Premises, and Cloud), and By Application (In-Store Visual Monitoring and Surveillance, Location-Based Marketing, Market Forecasting, Predictive Merchandising, Programmatic Advertising, and Others): Global Industry Perspective, Comprehensive Analysis, and Forecast, 2020 – 2026

Industry Insights

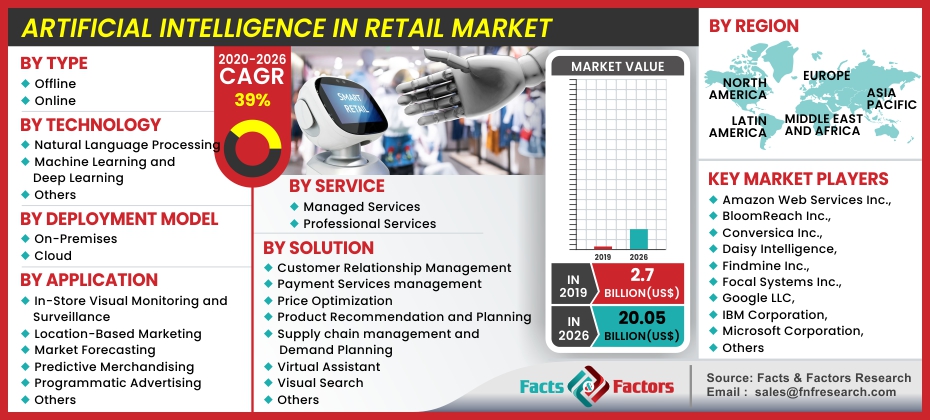
[225+ Pages Report] Global Artificial Intelligence in Retail market was projected at USD 2.7 billion in 2019, which is expected to hit USD 20.05 billion in 2026 and is expected to rise to CAGR by 39% between 2020 and 2026.

logoMarket Overview

Digitalization in retail is much more than just linking objects. It's about turning data into observations that guide decisions that produce better market results. Retail AI—including machine learning and deep learning—are crucial to developing these insights. This offers retailers incredible consumer interactions, revenue growth prospects, accelerated innovation, and insightful companies, all allowing them to separate themselves from their rivals. In some parts of its operations, several retailers are now using AI. They may automate marketing practices with AI in CRM applications, or predictive analytics to determine which consumers are likely to purchase those goods. The cloud helps AI workloads store and process data volumes from a wide range of sources. For eg, demand prediction and online product reviews are demands for retail cloud workloads.

But operating AI provides benefits in the store itself. The edge retail computing serves as a mechanism for insight, aggregation, or transformation into useful, operational knowledge of vast quantities of raw data. Imagine inventory robotics restoring shelves; digital signs adjusting to the audience; and customer monitoring sensors to alert cross-selling and upselling opportunities. The traction on brick and mortar is a special kind of AI in detail, known as computer vision. And it opens the way for new instances of market usage by consumer engagement, predicting demand, product control, and more.

Artificial Intelligence in Retail Market

To know more about this report | Request Free Sample Copy

logoIndustry Growth Factors

Over the years the idea of virtual test rooms has become more common, allowing shoppers to play with their equipment through a tactile GUI. The combination of artificial intelligence and digital mirrors allows shoppers to test and wear diverse dresses, accessories, goggles, and other beauty items. The real-time simulation for computer dressing solutions is delivered in conjunction with other advanced technology, such as virtual realities, artificial intelligence, or visual computing. The technology strengthens both online and offline Shopping's user engagement and loyalty. The need for a digital trial room is expected to increase because of its secure shopping experience since the global COVID-19 pandemic.

Each retail corporation tries to consolidate its loyal client base to remain on the market today in the retained sector. Providing each consumer with improved customized service is a prime tactic for leading brands. Chabot’s operated by AI is one of the innovations that can effectively promote consumer interaction. Popularity is also likely to increase in all markets for both online and in-store catboats. The framework lets retailers handle consumer shopping requests with AI-configured chatbots without including humans. Al-Driven Chatbots' fast, customized and on-demand support and feedback add to the consumer experience while favoring the retail sector as a whole.

logoGlobal Artificial Intelligence in Retail Market: Segmentation

Global Artificial Intelligence in Retail market is segmented into four notable segments which are type, solution, technology, deployment model, service, and application.

Based on type the market is classified into offline, and online. Based on technology the market is classified as machine learning & deep learning, natural language processing, and others. Based on Solution the market is further classified as Visual Search, Payment Services management, Customer Relationship Management, Product Recommendation & Planning, Price Optimization, Virtual Assistant, Supply chain management & Demand Planning, and Others. Based on service the market is further classified as managed services, and professional services. Based on the deployment model the market is further classified as on-premises and cloud. Based on Application the market is further classified as Location-Based Marketing, In-Store Visual Monitoring & Surveillance, Market Forecasting, Programmatic Advertising, Predictive Merchandising, and Others.

logoGlobal Artificial Intelligence in Retail Market: Regional Analysis

Based on regions, the global Artificial Intelligence in Retail market can be divided into five main regions.

The Asia Pacific market with the highest market share is anticipated to lead, largely due to the participation of many emerging economies, such as China and India, with an emphasis on improving retail solutions. A lot of retailers have hired AI-based technologies to maximize the processes and inventory of their supply chains. AI helps retailers to manage and attract their clients and to consider the consumer's purchasing habits. AI technology is being used by online and offline shopping companies to engage consumers and increase sales turnover.

logoReport Scope

Report Attribute

Details

Market Size in 2019

USD 2.7 Billion

Projected Market Size in 2026

USD 20.05 Billion

CAGR Growth Rate

39% CAGR

Base Year 2020

Forecast Years

2020-2026

Key Market Players

Amazon Web Services Inc., BloomReach Inc., Conversica Inc., Daisy Intelligence, Findmine Inc., Focal Systems Inc., Google LLC, IBM Corporation, Microsoft Corporation, Plexure Ltd, Salesforce.com Inc., SAP SE, Sentient Technologies Holdings Limited, Style.ai, Versium Analytics Inc., ViSenze Pte Ltd, and Others.

Key Segment

By Type, By Technology, By Solution, By Service, By Deployment Model, By Application, By Region

Major Regions Covered

North America, Europe, Asia Pacific, Latin America, and the Middle East & Africa

Purchase Options

Request customized purchase options to meet your research needs. Explore purchase options

logoGlobal Artificial Intelligence in Retail Market: Competitive Players

Some of the key players in the Artificial Intelligence in Retail market are :

  • Amazon Web Services Inc.
  • BloomReach Inc.
  • Conversica Inc.
  • Daisy Intelligence
  • Findmine Inc.
  • Focal Systems Inc.
  • Google LLC
  • IBM Corporation
  • Microsoft Corporation
  • Plexure Ltd
  • Salesforce.com Inc.
  • SAP SE
  • Sentient Technologies Holdings Limited
  • Style.ai
  • Versium Analytics Inc.
  • ViSenze Pte Ltd
  • and Others

logoThe global Artificial Intelligence in Retail market is segmented as follows:

logoBy Type:

  • Offline
  • Online

logoBy Technology:

  • Natural Language Processing
  • Machine Learning and Deep Learning
  • Others

logoBy Solution:

  • Customer Relationship Management
  • Payment Services management
  • Price Optimization
  • Product Recommendation and Planning
  • Supply chain management and Demand Planning
  • Virtual Assistant
  • Visual Search
  • Others

logoBy Service:

  • Managed Services
  • Professional Services

logoBy Deployment Model:

  • On-Premises
  • Cloud

logoBy Application:

  • In-Store Visual Monitoring and Surveillance
  • Location-Based Marketing
  • Market Forecasting
  • Predictive Merchandising
  • Programmatic Advertising
  • Others

logoGlobal Artificial Intelligence in Retail Market: Regional Segment Analysis

  • North America
    • The U.S.
    • Canada
  • Europe
    • Germany
    • The UK
    • France
    • Spain
    • Italy
    • Rest of Europe
  • Asia Pacific
    • China
    • Japan
    • India
    • South Korea
    • Southeast Asia
    • Rest of Asia Pacific
  • Latin America
    • Brazil
    • Mexico
    • Rest of Latin America
  • Middle East & Africa
    • GCC
    • South Africa
    • Rest of the Middle East & Africa

Table of Content

  1. Chapter 1 Executive Summary
    1. 1.1. Introduction of Artificial Intelligence in Retail
    2. 1.2. Global Artificial Intelligence in Retail Market, 2019 & 2026 (USD Billion)
    3. 1.3. COVID-19 Impacts on Artificial Intelligence in Retail Market
      1. 1.3.1. Short Term COVID-19 Impact on the Market
      2. 1.3.2. Mid-Term COVID-19 Impact on the Market
      3. 1.3.3. Long-Term COVID-19 Impact on the Market
    4. 1.4. Business Strategies and Recommendations
    5. 1.5. Global Artificial Intelligence in Retail Market, 2016 – 2026 (USD Billion)
    6. 1.6. Global Artificial Intelligence in Retail Market Absolute Revenue Opportunity, 2016 – 2026 (USD Billion)
    7. 1.7. Global Artificial Intelligence in Retail Market Incremental Revenue Opportunity, 2020 – 2026 (USD Billion)
  2. Chapter 2 Artificial Intelligence in Retail Market – Type Analysis
    1. 2.1. Global Artificial Intelligence in Retail Market – Type Overview
    2. 2.2. Global Artificial Intelligence in Retail Market Share, by Type, 2019 & 2026 (USD Billion)
    3. 2.3. Offline
      1. 2.3.1. Global Offline Artificial Intelligence in Retail Market, 2016 – 2026 (USD Billion)
    4. 2.4. Online
      1. 2.4.1. Global Online Artificial Intelligence in Retail Market, 2016 – 2026 (USD Billion)
  3. Chapter 3 Artificial Intelligence in Retail Market – Technology Analysis
    1. 3.1. Global Artificial Intelligence in Retail Market – Technology Overview
    2. 3.2. Global Artificial Intelligence in Retail Market Share, by Technology, 2019 & 2026 (USD Billion)
    3. 3.3. Natural Language Processing
      1. 3.3.1. Global Natural Language Processing Artificial Intelligence in Retail Market, 2016 – 2026 (USD Billion)
    4. 3.4. Machine Learning and Deep Learning
      1. 3.4.1. Global Machine Learning and Deep Learning Artificial Intelligence in Retail Market, 2016 – 2026 (USD Billion)
    5. 3.5. Others
      1. 3.5.1. Global Others Artificial Intelligence in Retail Market, 2016 – 2026 (USD Billion)
  4. Chapter 4 Artificial Intelligence in Retail Market – Solution Analysis
    1. 4.1. Global Artificial Intelligence in Retail Market – Solution Overview
    2. 4.2. Global Artificial Intelligence in Retail Market Share, by Solution, 2019 & 2026 (USD Billion)
    3. 4.3. Customer Relationship Management
      1. 4.3.1. Global Customer Relationship Management Artificial Intelligence in Retail Market, 2016 – 2026 (USD Billion)
    4. 4.4. Payment Services management
      1. 4.4.1. Global Payment Services management Artificial Intelligence in Retail Market, 2016 – 2026 (USD Billion)
    5. 4.5. Price Optimization
      1. 4.5.1. Global Price Optimization Artificial Intelligence in Retail Market, 2016 – 2026 (USD Billion)
    6. 4.6. Product Recommendation and Planning
      1. 4.6.1. Global Product Recommendation and Planning Artificial Intelligence in Retail Market, 2016 – 2026 (USD Billion)
    7. 4.7. Supply chain management and Demand Planning
      1. 4.7.1. Global Supply chain management and Demand Planning Artificial Intelligence in Retail Market, 2016 – 2026 (USD Billion)
    8. 4.8. Virtual Assistant
      1. 4.8.1. Global Virtual Assistant Artificial Intelligence in Retail Market, 2016 – 2026 (USD Billion)
    9. 4.9. Visual Search
      1. 4.9.1. Global Visual Search Artificial Intelligence in Retail Market, 2016 – 2026 (USD Billion)
    10. 4.10. Others
      1. 4.10.1. Global Others Artificial Intelligence in Retail Market, 2016 – 2026 (USD Billion)
  5. Chapter 5 Artificial Intelligence in Retail Market – Service Analysis
    1. 5.1. Global Artificial Intelligence in Retail Market – Service Overview
    2. 5.2. Global Artificial Intelligence in Retail Market Share, by Service, 2019 & 2026 (USD Billion)
    3. 5.3. Managed Services
      1. 5.3.1. Global Managed Services Artificial Intelligence in Retail Market, 2016 – 2026 (USD Billion)
    4. 5.4. Professional Services
      1. 5.4.1. Global Professional Services Artificial Intelligence in Retail Market, 2016 – 2026 (USD Billion)
  6. Chapter 6 Artificial Intelligence in Retail Market – Deployment Model Analysis
    1. 6.1. Global Artificial Intelligence in Retail Market – Deployment Model Overview
    2. 6.2. Global Artificial Intelligence in Retail Market Share, by Deployment Model, 2019 & 2026 (USD Billion)
    3. 6.3. On-Premises
      1. 6.3.1. Global On-Premises Artificial Intelligence in Retail Market, 2016 – 2026 (USD Billion)
    4. 6.4. Cloud
      1. 6.4.1. Global Cloud Artificial Intelligence in Retail Market, 2016 – 2026 (USD Billion)
  7. Chapter 7 Artificial Intelligence in Retail Market – Application Analysis
    1. 7.1. Global Artificial Intelligence in Retail Market – Application Overview
    2. 7.2. Global Artificial Intelligence in Retail Market Share, by Application, 2019 & 2026 (USD Billion)
    3. 7.3. In-Store Visual Monitoring and Surveillance
      1. 7.3.1. Global In-Store Visual Monitoring and Surveillance Artificial Intelligence in Retail Market, 2016 – 2026 (USD Billion)
    4. 7.4. Location-Based Marketing
      1. 7.4.1. Global Location-Based Marketing Artificial Intelligence in Retail Market, 2016 – 2026 (USD Billion)
    5. 7.5. Market Forecasting
      1. 7.5.1. Global Market Forecasting Artificial Intelligence in Retail Market, 2016 – 2026 (USD Billion)
    6. 7.6. Predictive Merchandising
      1. 7.6.1. Global Predictive Merchandising Artificial Intelligence in Retail Market, 2016 – 2026 (USD Billion)
    7. 7.7. Programmatic Advertising
      1. 7.7.1. Global Programmatic Advertising Artificial Intelligence in Retail Market, 2016 – 2026 (USD Billion)
    8. 7.8. Others
      1. 7.8.1. Global Others Artificial Intelligence in Retail Market, 2016 – 2026 (USD Billion)
  8. Chapter 8 Artificial Intelligence in Retail Market – Regional Analysis
    1. 8.1. Global Artificial Intelligence in Retail Market Regional Overview
    2. 8.2. Global Artificial Intelligence in Retail Market Share, by Region, 2019 & 2026 (USD Billion)
    3. 8.3. North America
      1. 8.3.1. North America Artificial Intelligence in Retail Market, 2016 – 2026 (USD Billion)
      2. 8.3.2. North America Artificial Intelligence in Retail Market, by Type, 2016 – 2026
      3. 8.3.3. North America Artificial Intelligence in Retail Market, by Technology, 2016 – 2026
      4. 8.3.4. North America Artificial Intelligence in Retail Market, by Solution, 2016 – 2026
      5. 8.3.5. North America Artificial Intelligence in Retail Market, by Service, 2016 – 2026
      6. 8.3.6. North America Artificial Intelligence in Retail Market, by Deployment Model, 2016 – 2026
      7. 8.3.7. North America Artificial Intelligence in Retail Market, by Application, 2016 – 2026
      8. 8.3.8. U.S.
      9. 8.3.9. Canada
    4. 8.4. Europe
      1. 8.4.1. Europe Artificial Intelligence in Retail Market, 2016 – 2026 (USD Billion)
      2. 8.4.2. Europe Artificial Intelligence in Retail Market, by Type, 2016 – 2026
      3. 8.4.3. Europe Artificial Intelligence in Retail Market, by Technology, 2016 – 2026
      4. 8.4.4. Europe Artificial Intelligence in Retail Market, by Solution, 2016 – 2026
      5. 8.4.5. Europe Artificial Intelligence in Retail Market, by Service, 2016 – 2026
      6. 8.4.6. Europe Artificial Intelligence in Retail Market, by Deployment Model, 2016 – 2026
      7. 8.4.7. Europe Artificial Intelligence in Retail Market, by Application, 2016 – 2026
      8. 8.4.8. Germany
      9. 8.4.9. France
      10. 8.4.10. U.K.
      11. 8.4.11. Italy
      12. 8.4.12. Spain
      13. 8.4.13. Rest of Europe
    5. 8.5. Asia Pacific
      1. 8.5.1. Asia Pacific Artificial Intelligence in Retail Market, 2016 – 2026 (USD Billion)
      2. 8.5.2. Asia Pacific Artificial Intelligence in Retail Market, by Type, 2016 – 2026
      3. 8.5.3. Asia Pacific Artificial Intelligence in Retail Market, by Technology, 2016 – 2026
      4. 8.5.4. Asia Pacific Artificial Intelligence in Retail Market, by Solution, 2016 – 2026
      5. 8.5.5. Asia Pacific Artificial Intelligence in Retail Market, by Service, 2016 – 2026
      6. 8.5.6. Asia Pacific Artificial Intelligence in Retail Market, by Deployment Model, 2016 – 2026
      7. 8.5.7. Asia Pacific Artificial Intelligence in Retail Market, by Application, 2016 – 2026
      8. 8.5.8. China
      9. 8.5.9. Japan
      10. 8.5.10. India
      11. 8.5.11. South Korea
      12. 8.5.12. South-East Asia
      13. 8.5.13. Rest of Asia Pacific
    6. 8.6. Latin America
      1. 8.6.1. Latin America Artificial Intelligence in Retail Market, 2016 – 2026 (USD Billion)
      2. 8.6.2. Latin America Artificial Intelligence in Retail Market, by Type, 2016 – 2026
      3. 8.6.3. Latin America Artificial Intelligence in Retail Market, by Technology, 2016 – 2026
      4. 8.6.4. Latin America Artificial Intelligence in Retail Market, by Solution, 2016 – 2026
      5. 8.6.5. Latin America Artificial Intelligence in Retail Market, by Service, 2016 – 2026
      6. 8.6.6. Latin America Artificial Intelligence in Retail Market, by Deployment Model, 2016 – 2026
      7. 8.6.7. Latin America Artificial Intelligence in Retail Market, by Application, 2016 – 2026
      8. 8.6.8. Brazil
      9. 8.6.9. Mexico
      10. 8.6.10. Rest of Latin America
    7. 8.7. The Middle-East and Africa
      1. 8.7.1. The Middle-East and Africa Artificial Intelligence in Retail Market, 2016 – 2026 (USD Billion)
      2. 8.7.2. The Middle-East and Africa Artificial Intelligence in Retail Market, by Type, 2016 – 2026
      3. 8.7.3. The Middle-East and Africa Artificial Intelligence in Retail Market, by Technology, 2016 – 2026
      4. 8.7.4. The Middle-East and Africa Artificial Intelligence in Retail Market, by Solution, 2016 – 2026
      5. 8.7.5. The Middle-East and Africa Artificial Intelligence in Retail Market, by Service, 2016 – 2026
      6. 8.7.6. The Middle-East and Africa Artificial Intelligence in Retail Market, by Deployment Model, 2016 – 2026
      7. 8.7.7. The Middle-East and Africa Artificial Intelligence in Retail Market, by Application, 2016 – 2026
      8. 8.7.8. GCC Countries
      9. 8.7.9. South Africa
      10. 8.7.10. Rest of Middle-East Africa
  9. Chapter 9 Artificial Intelligence in Retail Market – Competitive Landscape
    1. 9.1. Competitor Market Share – Revenue
    2. 9.2. Market Concentration Rate Analysis, Top 3 and Top 5 Players
    3. 9.3. Strategic Developments
      1. 9.3.1. Acquisitions and Mergers
      2. 9.3.2. New Products
      3. 9.3.3. Research & Development Activities
  10. Chapter 10 Company Profiles
    1. 10.1. Amazon Web Services Inc.
      1. 10.1.1. Company Overview
      2. 10.1.2. Product/Service Portfolio
      3. 10.1.3. Amazon Web Services Inc. Sales, Revenue, and Gross Margin
      4. 10.1.4. Amazon Web Services Inc. Revenue and Growth Rate
      5. 10.1.5. Amazon Web Services Inc. Market Share
      6. 10.1.6. Recent Initiatives, Funding/VC Activities, and Technological Innovations
    2. 10.2. BloomReach Inc.
      1. 10.2.1. Company Overview
      2. 10.2.2. Product/Service Portfolio
      3. 10.2.3. BloomReach Inc. Sales, Revenue, and Gross Margin
      4. 10.2.4. BloomReach Inc. Revenue and Growth Rate
      5. 10.2.5. BloomReach Inc. Market Share
      6. 10.2.6. Recent Initiatives, Funding/VC Activities, and Technological Innovations
    3. 10.3. Conversica Inc.
      1. 10.3.1. Company Overview
      2. 10.3.2. Product/Service Portfolio
      3. 10.3.3. Conversica Inc. Sales, Revenue, and Gross Margin
      4. 10.3.4. Conversica Inc. Revenue and Growth Rate
      5. 10.3.5. Conversica Inc. Market Share
      6. 10.3.6. Recent Initiatives, Funding/VC Activities, and Technological Innovations
    4. 10.4. Daisy Intelligence
      1. 10.4.1. Company Overview
      2. 10.4.2. Product/Service Portfolio
      3. 10.4.3. Daisy Intelligence Sales, Revenue, and Gross Margin
      4. 10.4.4. Daisy Intelligence Revenue and Growth Rate
      5. 10.4.5. Daisy Intelligence Market Share
      6. 10.4.6. Recent Initiatives, Funding/VC Activities, and Technological Innovations
    5. 10.5. Findmine Inc.
      1. 10.5.1. Company Overview
      2. 10.5.2. Product/Service Portfolio
      3. 10.5.3. Findmine Inc. Sales, Revenue, and Gross Margin
      4. 10.5.4. Findmine Inc. Revenue and Growth Rate
      5. 10.5.5. Findmine Inc. Market Share
      6. 10.5.6. Recent Initiatives, Funding/VC Activities, and Technological Innovations
    6. 10.6. Focal Systems Inc.
      1. 10.6.1. Company Overview
      2. 10.6.2. Product/Service Portfolio
      3. 10.6.3. Focal Systems Inc. Sales, Revenue, and Gross Margin
      4. 10.6.4. Focal Systems Inc. Revenue and Growth Rate
      5. 10.6.5. Focal Systems Inc. Market Share
      6. 10.6.6. Recent Initiatives, Funding/VC Activities, and Technological Innovations
    7. 10.7. Google LLC
      1. 10.7.1. Company Overview
      2. 10.7.2. Product/Service Portfolio
      3. 10.7.3. Google LLC Sales, Revenue, and Gross Margin
      4. 10.7.4. Google LLC Revenue and Growth Rate
      5. 10.7.5. Google LLC Market Share
      6. 10.7.6. Recent Initiatives, Funding/VC Activities, and Technological Innovations
    8. 10.8. IBM Corporation
      1. 10.8.1. Company Overview
      2. 10.8.2. Product/Service Portfolio
      3. 10.8.3. IBM Corporation Sales, Revenue, and Gross Margin
      4. 10.8.4. IBM Corporation Revenue and Growth Rate
      5. 10.8.5. IBM Corporation Market Share
      6. 10.8.6. Recent Initiatives, Funding/VC Activities, and Technological Innovations
    9. 10.9. Microsoft Corporation
      1. 10.9.1. Company Overview
      2. 10.9.2. Product/Service Portfolio
      3. 10.9.3. Microsoft Corporation Sales, Revenue, and Gross Margin
      4. 10.9.4. Microsoft Corporation Revenue and Growth Rate
      5. 10.9.5. Microsoft Corporation Market Share
      6. 10.9.6. Recent Initiatives, Funding/VC Activities, and Technological Innovations
    10. 10.10. Plexure Ltd
      1. 10.10.1. Company Overview
      2. 10.10.2. Product/Service Portfolio
      3. 10.10.3. Plexure Ltd Sales, Revenue, and Gross Margin
      4. 10.10.4. Plexure Ltd Revenue and Growth Rate
      5. 10.10.5. Plexure Ltd Market Share
      6. 10.10.6. Recent Initiatives, Funding/VC Activities, and Technological Innovations
      7. 10.11. Salesforce.com Inc.
      8. 10.11.1. Company Overview
      9. 10.11.2. Product/Service Portfolio
        1. 10.11.3. Salesforce.com Inc. Sales, Revenue, and Gross Margin
        2. 10.11.4. Salesforce.com Inc. Revenue and Growth Rate
        3. 10.11.5. Salesforce.com Inc. Market Share
      10. 10.11.6. Recent Initiatives, Funding/VC Activities, and Technological Innovations
    11. 10.12. SAP SE
      1. 10.12.1. Company Overview
      2. 10.12.2. Product/Service Portfolio
      3. 10.12.3. SAP SE Sales, Revenue, and Gross Margin
      4. 10.12.4. SAP SE Revenue and Growth Rate
      5. 10.12.5. SAP SE Market Share
      6. 10.12.6. Recent Initiatives, Funding/VC Activities, and Technological Innovations
    12. 10.13. Sentient Technologies Holdings Limited
      1. 10.13.1. Company Overview
      2. 10.13.2. Product/Service Portfolio
      3. 10.13.3. Sentient Technologies Holdings Limited Sales, Revenue, and Gross Margin
      4. 10.13.4. Sentient Technologies Holdings Limited Revenue and Growth Rate
      5. 10.13.5. Sentient Technologies Holdings Limited Market Share
      6. 10.13.6. Recent Initiatives, Funding/VC Activities, and Technological Innovations
      7. 10.14. Style.ai
      8. 10.14.1. Company Overview
      9. 10.14.2. Product/Service Portfolio
        1. 10.14.3. Style.ai Sales, Revenue, and Gross Margin
        2. 10.14.4. Style.ai Revenue and Growth Rate
        3. 10.14.5. Style.ai Market Share
      10. 10.14.6. Recent Initiatives, Funding/VC Activities, and Technological Innovations
    13. 10.15. Versium Analytics Inc.
      1. 10.15.1. Company Overview
      2. 10.15.2. Product/Service Portfolio
      3. 10.15.3. Versium Analytics Inc. Sales, Revenue, and Gross Margin
      4. 10.15.4. Versium Analytics Inc. Revenue and Growth Rate
      5. 10.15.5. Versium Analytics Inc. Market Share
      6. 10.15.6. Recent Initiatives, Funding/VC Activities, and Technological Innovations
    14. 10.16. ViSenze Pte Ltd
      1. 10.16.1. Company Overview
      2. 10.16.2. Product/Service Portfolio
      3. 10.16.3. ViSenze Pte Ltd Sales, Revenue, and Gross Margin
      4. 10.16.4. ViSenze Pte Ltd Revenue and Growth Rate
      5. 10.16.5. ViSenze Pte Ltd Market Share
      6. 10.16.6. Recent Initiatives, Funding/VC Activities, and Technological Innovations
  11. Chapter 11 Artificial Intelligence in Retail — Industry Analysis
    1. 11.1. Introduction and Taxonomy
    2. 11.2. Artificial Intelligence in Retail Market – Key Trends
      1. 11.2.1. Market Drivers
      2. 11.2.2. Market Restraints
      3. 11.2.3. Market Opportunities
    3. 11.3. Value Chain Analysis
    4. 11.4. Key Mandates and Regulations
    5. 11.5. Technology Roadmap and Timeline
    6. 11.6. Artificial Intelligence in Retail Market – Attractiveness Analysis
      1. 11.6.1. By Type
      2. 11.6.2. By Technology
      3. 11.6.3. By Solution
      4. 11.6.4. By Service
      5. 11.6.5. By Deployment Model
      6. 11.6.6. By Application
      7. 11.6.7. By Region
  12. Chapter 12 Industrial Chain, Sourcing Strategy, and Downstream Buyers
    1. 12.1. Artificial Intelligence in Retail Industrial Chain Analysis
    2. 12.2. Downstream Buyers
    3. 12.3. Distributors/Traders List
  13. Chapter 13 Marketing Strategy Analysis
    1. 13.1. Marketing Channel
    2. 13.2. Direct Marketing
    3. 13.3. Indirect Marketing
    4. 13.4. Marketing Channel Development Trends
    5. 13.5. Economic/Political Environmental Change
  14. Chapter 14 Report Conclusion & Key Insights
    1. 14.1. Key Insights from Primary Interviews & Surveys Respondents
    2. 14.2. Key Takeaways from Analysts, Consultants, and Industry Leaders
  15. Chapter 15 Research Approach & Methodology
    1. 15.1. Report Description
    2. 15.2. Research Scope
    3. 15.3. Research Methodology
      1. 15.3.1. Secondary Research
      2. 15.3.2. Primary Research
      3. 15.3.3. Statistical Models
      4. 15.3.4. Research Limitations
  •  

    List of Figures

    Fig.1 Product Picture of Artificial Intelligence in Retail
    Fig.2 COVID-19 Impacts on Artificial Intelligence in Retail Market
    Fig.3 Business Strategies and Recommendations
    Fig.4 Global Artificial Intelligence in Retail Market, 2016 – 2026 (USD Billion)
    Fig.5 Global Artificial Intelligence in Retail Market Absolute Revenue Opportunity, 2016 – 2026 (USD Billion)
    Fig.6 Global Artificial Intelligence in Retail Market Incremental Revenue Opportunity, 2020 – 2026 (USD Billion)
    Fig.7 Global Artificial Intelligence in Retail Market Share, by Type, 2019 & 2026 (USD Billion)
    Fig.8 Global Offline Artificial Intelligence in Retail Market, 2016 – 2026 (USD Billion)
    Fig.9 Global Online Artificial Intelligence in Retail Market, 2016 – 2026 (USD Billion)
    Fig.10 Global Artificial Intelligence in Retail Market Share, by Technology, 2019 & 2026 (USD Billion)
    Fig.11 Global Natural Language Processing Artificial Intelligence in Retail Market, 2016 – 2026 (USD Billion)
    Fig.12 Global Machine Learning and Deep Learning Artificial Intelligence in Retail Market, 2016 – 2026 (USD Billion)
    Fig.13 Global Others Artificial Intelligence in Retail Market, 2016 – 2026 (USD Billion)
    Fig.14 Global Artificial Intelligence in Retail Market Share, by Solution, 2019 & 2026 (USD Billion)
    Fig.15 Global Customer Relationship Management Artificial Intelligence in Retail Market, 2016 – 2026 (USD Billion)
    Fig.16 Global Payment Services management Artificial Intelligence in Retail Market, 2016 – 2026 (USD Billion)
    Fig.17 Global Price Optimization Artificial Intelligence in Retail Market, 2016 – 2026 (USD Billion)
    Fig.18 Global Product Recommendation and Planning Artificial Intelligence in Retail Market, 2016 – 2026 (USD Billion)
    Fig.19 Global Supply chain management and Demand Planning Artificial Intelligence in Retail Market, 2016 – 2026 (USD Billion)
    Fig.20 Global Virtual Assistant Artificial Intelligence in Retail Market, 2016 – 2026 (USD Billion)
    Fig.21 Global Visual Search Artificial Intelligence in Retail Market, 2016 – 2026 (USD Billion)
    Fig.22 Global Others Artificial Intelligence in Retail Market, 2016 – 2026 (USD Billion)
    Fig.23 Global Artificial Intelligence in Retail Market Share, by Service, 2019 & 2026 (USD Billion)
    Fig.24 Global Managed Services Artificial Intelligence in Retail Market, 2016 – 2026 (USD Billion)
    Fig.25 Global Professional Services Artificial Intelligence in Retail Market, 2016 – 2026 (USD Billion)
    Fig.26 Global Artificial Intelligence in Retail Market Share, by Deployment Model, 2019 & 2026 (USD Billion)
    Fig.27 Global On-Premises Artificial Intelligence in Retail Market, 2016 – 2026 (USD Billion)
    Fig.28 Global Cloud Artificial Intelligence in Retail Market, 2016 – 2026 (USD Billion)
    Fig.29 Global Artificial Intelligence in Retail Market Share, by Application, 2019 & 2026 (USD Billion)
    Fig.30 Global In-Store Visual Monitoring and Surveillance Artificial Intelligence in Retail Market, 2016 – 2026 (USD Billion)
    Fig.31 Global Location-Based Marketing Artificial Intelligence in Retail Market, 2016 – 2026 (USD Billion)
    Fig.32 Global Market Forecasting Artificial Intelligence in Retail Market, 2016 – 2026 (USD Billion)
    Fig.33 Global Predictive Merchandising Artificial Intelligence in Retail Market, 2016 – 2026 (USD Billion)
    Fig.34 Global Programmatic Advertising Artificial Intelligence in Retail Market, 2016 – 2026 (USD Billion)
    Fig.35 Global Others Artificial Intelligence in Retail Market, 2016 – 2026 (USD Billion)
    Fig.36 Global Artificial Intelligence in Retail Market Share, by Region, 2019 & 2026 (USD Billion)
    Fig.37 North America Artificial Intelligence in Retail Market, 2016 – 2026 (USD Billion)
    Fig.38 U.S. Artificial Intelligence in Retail Market, 2016 – 2026 (USD Billion)
    Fig.39 Canada Artificial Intelligence in Retail Market, 2016 – 2026 (USD Billion)
    Fig.40 Europe Artificial Intelligence in Retail Market, 2016 – 2026 (USD Billion)
    Fig.41 Germany Artificial Intelligence in Retail Market, 2016 – 2026 (USD Billion)
    Fig.42 France Artificial Intelligence in Retail Market, 2016 – 2026 (USD Billion)
    Fig.43 U.K. Artificial Intelligence in Retail Market, 2016 – 2026 (USD Billion)
    Fig.44 Italy Artificial Intelligence in Retail Market, 2016 – 2026 (USD Billion)
    Fig.45 Spain Artificial Intelligence in Retail Market, 2016 – 2026 (USD Billion)
    Fig.46 Rest of Europe Artificial Intelligence in Retail Market, 2016 – 2026 (USD Billion)
    Fig.47 Asia Pacific Artificial Intelligence in Retail Market, 2016 – 2026 (USD Billion)
    Fig.48 China Artificial Intelligence in Retail Market, 2016 – 2026 (USD Billion)
    Fig.49 Japan Artificial Intelligence in Retail Market, 2016 – 2026 (USD Billion)
    Fig.50 India Artificial Intelligence in Retail Market, 2016 – 2026 (USD Billion)
    Fig.51 South  Korea Artificial Intelligence in Retail Market, 2016 – 2026 (USD Billion)
    Fig.52 South-East Asia Artificial Intelligence in Retail Market, 2016 – 2026 (USD Billion)
    Fig.53 Rest of Asia Pacific Artificial Intelligence in Retail Market, 2016 – 2026 (USD Billion)
    Fig.54 Latin America Artificial Intelligence in Retail Market, 2016 – 2026 (USD Billion)
    Fig.55 Brazil Artificial Intelligence in Retail Market, 2016 – 2026 (USD Billion)
    Fig.56 Mexico Artificial Intelligence in Retail Market, 2016 – 2026 (USD Billion)
    Fig.57 Rest of Latin America Artificial Intelligence in Retail Market, 2016 – 2026 (USD Billion)
    Fig.58 The Middle-East and Africa Artificial Intelligence in Retail Market, 2016 – 2026 (USD Billion)
    Fig.59 GCC Countries Artificial Intelligence in Retail Market, 2016 – 2026 (USD Billion)
    Fig.60 South Africa Artificial Intelligence in Retail Market, 2016 – 2026 (USD Billion)
    Fig.61 Rest of Middle-East Africa Artificial Intelligence in Retail Market, 2016 – 2026 (USD Billion)
    Fig.62 Competitor Market Share – Revenue
    Fig.63 Amazon Web Services Inc. Revenue and Growth Rate
    Fig.64 Amazon Web Services Inc. Market Share
    Fig.65 BloomReach Inc. Revenue and Growth Rate
    Fig.66 BloomReach Inc. Market Share
    Fig.67 Conversica Inc. Revenue and Growth Rate
    Fig.68 Conversica Inc. Market Share
    Fig.69 Daisy Intelligence Revenue and Growth Rate
    Fig.70 Daisy Intelligence Market Share
    Fig.71 Findmine Inc. Revenue and Growth Rate
    Fig.72 Findmine Inc. Market Share
    Fig.73 Focal Systems Inc. Revenue and Growth Rate
    Fig.74 Focal Systems Inc. Market Share
    Fig.75 Google LLC Revenue and Growth Rate
    Fig.76 Google LLC Market Share
    Fig.77 IBM Corporation Revenue and Growth Rate
    Fig.78 IBM Corporation Market Share
    Fig.79 Microsoft Corporation Revenue and Growth Rate
    Fig.80 Microsoft Corporation Market Share
    Fig.81 Plexure Ltd Revenue and Growth Rate
    Fig.82 Plexure Ltd Market Share
    Fig.83 Salesforce.com Inc. Revenue and Growth Rate
    Fig.84 Salesforce.com Inc. Market Share
    Fig.85 SAP  SE Revenue and Growth Rate
    Fig.86 SAP  SE Market Share
    Fig.87 Sentient Technologies Holdings Limited Revenue and Growth Rate
    Fig.88 Sentient Technologies Holdings Limited Market Share
    Fig.89 Style.ai Revenue and Growth Rate
    Fig.90 Style.ai Market Share
    Fig.91 Versium Analytics Inc. Revenue and Growth Rate
    Fig.92 Versium Analytics Inc. Market Share
    Fig.93 ViSenze Pte Ltd Revenue and Growth Rate
    Fig.94 ViSenze Pte Ltd Market Share
    Fig.95 Market Dynamics
    Fig.96 Global Artificial Intelligence in Retail – Value Chain Analysis
    Fig.97 Key Mandates and Regulations
    Fig.98 Technology Roadmap and Timeline
    Fig.99 Market Attractiveness Analysis – By Type
    Fig.100 Market Attractiveness Analysis – By Technology
    Fig.101 Market Attractiveness Analysis – By Solution
    Fig.102 Market Attractiveness Analysis – By Service
    Fig.103 Market Attractiveness Analysis – By Deployment Model
    Fig.104 Market Attractiveness Analysis – By Application
    Fig.105 Market Attractiveness Analysis – By Region
    Fig.106 Artificial Intelligence in Retail Industrial Chain Analysis
    Fig.107 Market Channels
    Fig.108 Marketing Channel Development Trend
    Fig.109 Growth in World Gross Product, 2008-2018


    List of Tables

    Table 1 Global Artificial Intelligence in Retail Market, 2019 & 2026 (USD Billion)
    Table 2 Global Artificial Intelligence in Retail Market, by Type, 2016 – 2026 (USD Billion)
    Table 3 Global Artificial Intelligence in Retail Market, by Technology, 2016 – 2026 (USD Billion)
    Table 4 Global Artificial Intelligence in Retail Market, by Solution, 2016 – 2026 (USD Billion)
    Table 5 Global Artificial Intelligence in Retail Market, by Service, 2016 – 2026 (USD Billion)
    Table 6 Global Artificial Intelligence in Retail Market, by Deployment Model, 2016 – 2026 (USD Billion)
    Table 7 Global Artificial Intelligence in Retail Market, by Application, 2016 – 2026 (USD Billion)
    Table 8 Global Artificial Intelligence in Retail Market, by Region, 2016 – 2026 (USD Billion)
    Table 9 North America Artificial Intelligence in Retail Market, by Country, 2016 – 2026 (USD Billion)
    Table 10 North America Artificial Intelligence in Retail Market, by Type, 2016 – 2026 (USD Billion)
    Table 11 North America Artificial Intelligence in Retail Market, by Technology, 2016 – 2026 (USD Billion)
    Table 12 North America Artificial Intelligence in Retail Market, by Solution, 2016 – 2026 (USD Billion)
    Table 13 North America Artificial Intelligence in Retail Market, by Service, 2016 – 2026 (USD Billion)
    Table 14 North America Artificial Intelligence in Retail Market, by Deployment Model, 2016 – 2026 (USD Billion)
    Table 15 North America Artificial Intelligence in Retail Market, by Application, 2016 – 2026 (USD Billion)
    Table 16 Europe Artificial Intelligence in Retail Market, by Country, 2016 – 2026 (USD Billion)
    Table 17 Europe Artificial Intelligence in Retail Market, by Type, 2016 – 2026 (USD Billion)
    Table 18 Europe Artificial Intelligence in Retail Market, by Technology, 2016 – 2026 (USD Billion)
    Table 19 Europe Artificial Intelligence in Retail Market, by Solution, 2016 – 2026 (USD Billion)
    Table 20 Europe Artificial Intelligence in Retail Market, by Service, 2016 – 2026 (USD Billion)
    Table 21 Europe Artificial Intelligence in Retail Market, by Deployment Model, 2016 – 2026 (USD Billion)
    Table 22 Europe Artificial Intelligence in Retail Market, by Application, 2016 – 2026 (USD Billion)
    Table 23 Asia Pacific Artificial Intelligence in Retail Market, by Country, 2016 – 2026 (USD Billion)
    Table 24 Asia Pacific Artificial Intelligence in Retail Market, by Type, 2016 – 2026 (USD Billion)
    Table 25 Asia Pacific Artificial Intelligence in Retail Market, by Technology, 2016 – 2026 (USD Billion)
    Table 26 Asia Pacific Artificial Intelligence in Retail Market, by Solution, 2016 – 2026 (USD Billion)
    Table 27 Asia Pacific Artificial Intelligence in Retail Market, by Service, 2016 – 2026 (USD Billion)
    Table 28 Asia Pacific Artificial Intelligence in Retail Market, by Deployment Model, 2016 – 2026 (USD Billion)
    Table 29 Asia Pacific Artificial Intelligence in Retail Market, by Application, 2016 – 2026 (USD Billion)
    Table 30 Latin America Artificial Intelligence in Retail Market, by Country, 2016 – 2026 (USD Billion)
    Table 31 Latin America Artificial Intelligence in Retail Market, by Type, 2016 – 2026 (USD Billion)
    Table 32 Latin America Artificial Intelligence in Retail Market, by Technology, 2016 – 2026 (USD Billion)
    Table 33 Latin America Artificial Intelligence in Retail Market, by Solution, 2016 – 2026 (USD Billion)
    Table 34 Latin America Artificial Intelligence in Retail Market, by Service, 2016 – 2026 (USD Billion)
    Table 35 Latin America Artificial Intelligence in Retail Market, by Deployment Model, 2016 – 2026 (USD Billion)
    Table 36 Latin America Artificial Intelligence in Retail Market, by Application, 2016 – 2026 (USD Billion)
    Table 37 The Middle-East and Africa Artificial Intelligence in Retail Market, by Country, 2016 – 2026 (USD Billion)
    Table 38 The Middle-East and Africa Artificial Intelligence in Retail Market, by Type, 2016 – 2026 (USD Billion)
    Table 39 The Middle-East and Africa Artificial Intelligence in Retail Market, by Technology, 2016 – 2026 (USD Billion)
    Table 40 The Middle-East and Africa Artificial Intelligence in Retail Market, by Solution, 2016 – 2026 (USD Billion)
    Table 41 The Middle-East and Africa Artificial Intelligence in Retail Market, by Service, 2016 – 2026 (USD Billion)
    Table 42 The Middle-East and Africa Artificial Intelligence in Retail Market, by Deployment Model, 2016 – 2026 (USD Billion)
    Table 43 The Middle-East and Africa Artificial Intelligence in Retail Market, by Application, 2016 – 2026 (USD Billion)
    Table 44 Global Artificial Intelligence in Retail Market - Company Revenue Analysis, 2016 – 2019 (USD Billion)
    Table 45 Global Artificial Intelligence in Retail Market - Company Revenue Share Analysis, 2016 – 2019 (%)
    Table 46 Acquisitions and Mergers
    Table 47 Market Drivers – Impact Analysis
    Table 48 Market Restraints
    Table 49 Market Opportunities
    Table 50 Major Buyers of Artificial Intelligence in Retail
    Table 51 Distributors/Traders of Artificial Intelligence in Retail by Region

  • Industry Major Market Players

    • Amazon Web Services Inc.
    • BloomReach Inc.
    • Conversica Inc.
    • Daisy Intelligence
    • Findmine Inc.
    • Focal Systems Inc.
    • Google LLC
    • IBM Corporation
    • Microsoft Corporation
    • Plexure Ltd
    • Salesforce.com Inc.
    • SAP  SE
    • Sentient Technologies Holdings Limited
    • Style.ai
    • Versium Analytics Inc.
    • ViSenze Pte Ltd