Search Market Research Report

Discover Our Latest Reports
Discover Our Featured Reports
Discover Top Selling Reports

Ammonium Sulfate Market Size, Share Global Analysis Report, 2020–2026

report img

Ammonium Sulfate Market By Product Type (Liquid Ammonium sulfate, and Solid Ammonium sulfate) and By Application (Fertilizers, Industrial Use, Food Additives, Water Treatment, Pharmaceuticals, and Others): Global Industry Outlook, Market Size, Business Intelligence, Consumer Preferences, Statistical Surveys, Comprehensive Analysis, Historical Developments, Current Trends, and Forecast 2020–2026

Industry Insights

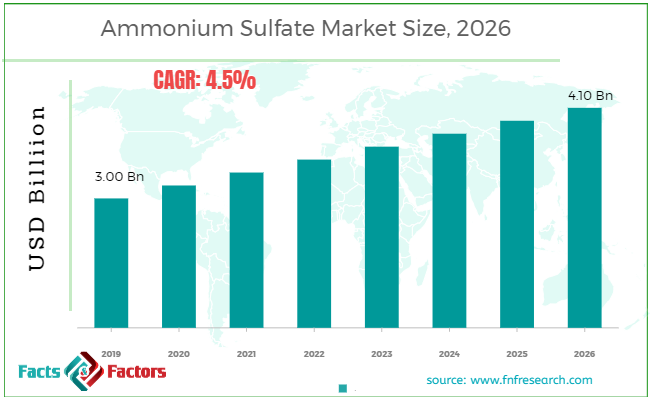
[190+ Pages Report] According to the report published by Facts Factors, the global ammonium sulfate market size was worth around USD 3.00 billion in 2019 and is predicted to grow to around USD 4.10 billion by 2026 with a compound annual growth rate (CAGR) of roughly 4.5% between 2023 and 2030. The report analyzes the global ammonium sulfate market drivers, restraints/challenges, and the effect they have on the demands during the projection period. In addition, the report explores emerging opportunities in the ammonium sulfate market.

The ammonium sulfate market report analyzes and notifies the industry statistics at the global as well as regional and country levels in order to acquire a thorough perspective of the entire Ammonium Sulfate market. The historical and past insights are provided for FY 2016 to FY 2019 whereas projected trends are delivered for FY 2020 to FY 2026. The quantitative and numerical data is represented in terms of both volume (Kilo Tons) and value (USD Million) from FY 2016 – 2026.

Ammonium Sulfate Market Size,

To know more about this report | Request Free Sample Copy


logoKey Insights from Primary Research

  • It was recognized through primary research that the Ammonium Sulfate market was valued at around USD 3.00 Billion in 2019.
  • North America is expected to hold the largest market share of Ammonium Sulfate in revenue, in 2019.
  • Based on type-based segmentation the “Liquid Ammonium Sulfate” category, was the leading revenue-generating category in 2019.
  • Based on the end user, the “Fertilizer” category, contributes to the largest revenue generation.
  • According to our primary respondents, the Ammonium Sulfate market is set to grow annually at a rate of around 4.5%.

logoKey Recommendations from Analysts

  • Ammonium sulfate is seen as toxic to human health. Worker exposure to ammonium sulfate at refining, manufacturing, and transportation sites may cause serious respiratory route infection due to dust inhalation and aqueous aerosols.
  • The growing use of solid ammonium sulfate in food and beverages and fertilizers is expected to fetch larger revenue for the category in the forthcoming time.
  • The larger share of Agriculture in the economy is boosting the Asia Pacific market to consume ammonium sulfate at a significant rate.
  • The advancement in agriculture techniques in Europe is anticipated to propel the ammonium sulfate market.
  • The rise in demand for nylon fibers has led to an increase in caprolactam production, which is leading to an increase in the global availability of ammonium sulfate.

The quantitative data is further underlined and reinforced by comprehensive qualitative data which comprises various across-the-board market dynamics. The rationales which directly or indirectly impact the Ammonium Sulfate industry are exemplified through parameters such as growth drivers, restraints, challenges, and opportunities among other impacting factors.

Throughout our research report, we have encompassed all the proven models and tools of industry analysis and extensively illustrated all the key business strategies and business models adopted in the Ammonium Sulfate industry. The report provides an all-inclusive and detailed competitive landscape prevalent in the Ammonium Sulfate market.

The report utilizes established industry analysis tools and models such as Porter’s Five Forces framework to analyze and recognize critical business strategies adopted by various stakeholders involved in the entire value chain of the Ammonium Sulfate industry. The Ammonium Sulfate market report additionally employs SWOT analysis and PESTLE analysis models for further in-depth analysis.

The report study further includes an in-depth analysis of industry players' market shares and provides an overview of leading players' market position in the Ammonium Sulfate sector. Key strategic developments in the Ammonium Sulfate market competitive landscape such as acquisitions & mergers, inaugurations of different products and services, partnerships & joint ventures, MoU agreements, VC & funding activities, R&D activities, and geographic expansion among other noteworthy activities by key players of the Ammonium Sulfate market are appropriately highlighted in the report.

The Ammonium Sulfate market research report delivers an acute valuation and taxonomy of the Ammonium Sulfate industry by practically splitting the market on the basis of different types, applications, and regions. Through the analysis of the historical and projected trends, all the segments and sub-segments were evaluated through the bottom-up approach, and different market sizes have been projected for FY 2020 to FY 2026.

logoReport Scope

Report Attribute

Details

Market Size in 2019

USD 3.00 Billion

Projected Market Size in 2026

USD 4.10 Billion

CAGR Growth Rate

4.5% CAGR

Base Year

2019

Forecast Years

2020-2026

Key Market Players

BASF, GAC CHEMICAL, Nutrien Ltd, Vertellus Holdings LLC, Royal DSM, ArcelorMittal, OCI Nitrogen, AdvanSix, Sumitomo Chemical Co., Ltd, DOMO Chemicals, LANXESS, HELM AG, Merck KGaA, Honeywell International Inc, and Evonik Industries AG., and Others

Key Segment

By Product, Application, and Region

Major Regions Covered

North America, Europe, Asia Pacific, Latin America, and the Middle East & Africa

Purchase Options

Request customized purchase options to meet your research needs. Explore purchase options

The regional segmentation of the Ammonium Sulfate industry includes the complete classification of all the major continents including North America, Latin America, Europe, Asia Pacific, and the Middle East & Africa. Further, country-wise data for the Ammonium Sulfate industry is provided for the leading economies of the world.

The ammonium Sulfate market is split into the segments such as product type and application. Based on product type, the market is bifurcated as liquid ammonium sulfate and solid ammonium sulfate. Based on the application the market is split into fertilizers, industrial use, food additives, water treatment, pharmaceuticals, and others.

logoSome of the essential players operating in the Ammonium Sulfate market, but not restricted to include

  •  BASF
  •  GAC CHEMICAL
  •  Nutrien Ltd
  •  Vertellus Holdings LLC
  •  Royal DSM
  •  ArcelorMittal
  •  OCI Nitrogen
  •  AdvanSix
  •  Sumitomo Chemical Co. Ltd
  •  DOMO Chemicals
  •  LANXESS
  •  HELM AG
  •  Merck KGaA
  •  Honeywell International Inc
  •  Evonik Industries AG

The taxonomy of the Ammonium Sulfate industry by its scope and segmentation is as follows:

logo By Product Type Segmentation Analysis (Customizable)

  • Solid Ammonium sulphate
  • Liquid Ammonium sulphate

logo By Application Segmentation Analysis (Customizable)

  • Fertilizers
  • Industrial Use
  • Food Additives
  • Water Treatment
  • Pharmaceuticals
  • Others

logo Regional Segmentation Analysis (Customizable)

  • North America
    • The U.S.
    • Canada
  • Europe
    • Germany
    • The UK
    • France
    • Spain
    • Italy
    • Rest of Europe
  • Asia Pacific
    • China
    • Japan
    • India
    • South Korea
    • Southeast Asia
    • Rest of Asia Pacific
  • Latin America
    • Brazil
    • Mexico
    • Rest of Latin America
  • Middle East & Africa
    • GCC
    • South Africa
    • Rest of Middle East & Africa

Table of Content

  1. CHAPTER 1. Executive Summary
  2. CHAPTER 2. Ammonium Sulphate market – Product Type Analysis
    1. 2.1. Global Ammonium Sulphate Market – Product Type Overview
    2. 2.2. Global Ammonium Sulphate Market Share, by Product Type, 2019 & 2026 (USD Million)
    3. 2.3. Global Ammonium Sulphate Market share, by Product Type, 2019 & 2026 (Kilo Tons)
    4. 2.4. Solid Ammonium sulphate
      1. 2.4.1. Global Solid Ammonium sulphate Ammonium Sulphate Market, 2016-2026 (USD Million)
      2. 2.4.2. Global Solid Ammonium sulphate Ammonium Sulphate Market, 2016-2026 (Kilo Tons)
    5. 2.5. Liquid Ammonium sulphate
      1. 2.5.1. Global Liquid Ammonium sulphate Ammonium Sulphate Market, 2016-2026 (USD Million)
      2. 2.5.2. Global Liquid Ammonium sulphate Ammonium Sulphate Market, 2016-2026 (Kilo Tons)
  3. CHAPTER 3. Ammonium Sulphate market – Application Analysis
    1. 3.1. Global Ammonium Sulphate Market – Application Overview
    2. 3.2. Global Ammonium Sulphate Market Share, by Application, 2019 & 2026 (USD Million)
    3. 3.3. Global Ammonium Sulphate Market share, by Application, 2019 & 2026 (Kilo Tons)
    4. 3.4. Fertilizers
      1. 3.4.1. Global Fertilizers Ammonium Sulphate Market, 2016-2026 (USD Million)
      2. 3.4.2. Global Fertilizers Ammonium Sulphate Market, 2016-2026 (Kilo Tons)
    5. 3.5. Food Additives
      1. 3.5.1. Global Food Additives Ammonium Sulphate Market, 2016-2026 (USD Million)
      2. 3.5.2. Global Food Additives Ammonium Sulphate Market, 2016-2026 (Kilo Tons)
    6. 3.6. Pharmaceuticals
      1. 3.6.1. Global Pharmaceuticals Ammonium Sulphate Market, 2016-2026 (USD Million)
      2. 3.6.2. Global Pharmaceuticals Ammonium Sulphate Market, 2016-2026 (Kilo Tons)
    7. 3.7. Water Treatment
      1. 3.7.1. Global Water Treatment Ammonium Sulphate Market, 2016-2026 (USD Million)
      2. 3.7.2. Global Water Treatment Ammonium Sulphate Market, 2016-2026 (Kilo Tons)
    8. 3.8. Industrial Use
      1. 3.8.1. Global Industrial Use Ammonium Sulphate Market, 2016-2026 (USD Million)
      2. 3.8.2. Global Industrial Use Ammonium Sulphate Market, 2016-2026 (Kilo Tons)
    9. 3.9. Others
      1. 3.9.1. Global Others Ammonium Sulphate Market, 2016-2026 (USD Million)
      2. 3.9.2. Global Others Ammonium Sulphate Market, 2016-2026 (Kilo Tons)
  4. CHAPTER 4. Ammonium Sulphate market – Regional Analysis
    1. 4.1. Global Ammonium Sulphate Market Regional Overview
    2. 4.2. Global Ammonium Sulphate Market Share, by Region, 2019 & 2026 (Value)
    3. 4.3. Global Ammonium Sulphate Market Share, by Region, 2019 & 2026 (Volume)
    4. 4.4. North America
      1. 4.4.1. North America Ammonium Sulphate Market size and forecast, 2016-2026
      2. 4.4.2. North America Ammonium Sulphate Market, by Country, 2019 - 2026 (USD Million)
      3. 4.4.3. North America Market size and forecast, 2016-2026 (Kilo Tons)
      4. 4.4.4. North America Ammonium Sulphate Market, by Country, 2019 - 2026 (Kilo Tons)
      5. 4.4.5. North America Ammonium Sulphate Market, by Product Type, 2016-2026
      6. 4.4.6. North America Ammonium Sulphate Market, by Application, 2016-2026
      7. 4.4.7. U.S.
      8. 4.4.8. Canada
    5. 4.5. Europe
      1. 4.5.1. Europe Ammonium Sulphate Market size and forecast, 2016-2026
      2. 4.5.2. Europe Ammonium Sulphate Market, by Country, 2019 - 2026 (USD Million)
      3. 4.5.3. Europe Market size and forecast, 2016-2026 (Kilo Tons)
      4. 4.5.4. Europe Ammonium Sulphate Market, by Country, 2019 - 2026 (Kilo Tons)
      5. 4.5.5. Europe Ammonium Sulphate Market, by Product Type, 2016-2026
      6. 4.5.6. Europe Ammonium Sulphate Market, by Application, 2016-2026
      7. 4.5.7. Germany
      8. 4.5.8. France
      9. 4.5.9. U.K.
      10. 4.5.10. Italy
      11. 4.5.11. Spain
      12. 4.5.12. Rest of Europe
    6. 4.6. Asia Pacific
      1. 4.6.1. Asia Pacific Ammonium Sulphate Market size and forecast, 2016-2026
      2. 4.6.2. Asia Pacific Ammonium Sulphate Market, by Country, 2019 - 2026 (USD Million)
      3. 4.6.3. Asia Pacific Market size and forecast, 2016-2026 (Kilo Tons)
      4. 4.6.4. Asia Pacific Ammonium Sulphate Market, by Country, 2019 - 2026 (Kilo Tons)
      5. 4.6.5. Asia Pacific Ammonium Sulphate Market, by Product Type, 2016-2026
      6. 4.6.6. Asia Pacific Ammonium Sulphate Market, by Application, 2016-2026
      7. 4.6.7. China
      8. 4.6.8. Japan
      9. 4.6.9. India
      10. 4.6.10. South Korea
      11. 4.6.11. South-East Asia
      12. 4.6.12. Rest of Asia Pacific
    7. 4.7. Latin America
      1. 4.7.1. Latin America Ammonium Sulphate Market size and forecast, 2016-2026
      2. 4.7.2. Latin America Ammonium Sulphate Market, by Country, 2019 - 2026 (USD Million)
      3. 4.7.3. Latin America Market size and forecast, 2016-2026 (Kilo Tons)
      4. 4.7.4. Latin America Ammonium Sulphate Market, by Country, 2019 - 2026 (Kilo Tons)
      5. 4.7.5. Latin America Ammonium Sulphate Market, by Product Type, 2016-2026
      6. 4.7.6. Latin America Ammonium Sulphate Market, by Application, 2016-2026
      7. 4.7.7. Brazil
      8. 4.7.8. Mexico
      9. 4.7.9. Rest of Latin America
    8. 4.8. The Middle-East and Africa
      1. 4.8.1. The Middle-East and Africa Ammonium Sulphate Market size and forecast, 2016-2026
      2. 4.8.2. The Middle-East and Africa Ammonium Sulphate Market, by Country, 2019 - 2026 (USD Million)
      3. 4.8.3. The Middle-East and Africa Market size and forecast, 2016-2026 (Kilo Tons)
      4. 4.8.4. The Middle-East and Africa Ammonium Sulphate Market, by Country, 2019 - 2026 (Kilo Tons)
      5. 4.8.5. The Middle-East and Africa Ammonium Sulphate Market, by Product Type, 2016-2026
      6. 4.8.6. The Middle-East and Africa Ammonium Sulphate Market, by Application, 2016-2026
      7. 4.8.7. GCC Countries
      8. 4.8.8. South Africa
      9. 4.8.9. Rest of Middle-East Africa
  5. CHAPTER 5. Ammonium Sulphate Production, Consumption, Export, Import by Regions
    1. 5.1. Global Ammonium Sulphate production and revenue, 2016-2026 (USD Million) (Kilo Tons)
    2. 5.2. Global Import and Export Analysis, by Region
  6. CHAPTER 6. Ammonium Sulphate market – Competitive Landscape
    1. 6.1. Competitor Market Share – Revenue
    2. 6.2. Market Concentration Rate Analysis, Top 3 and Top 5 Players
    3. 6.3. Competitor Market Share – Volume
    4. 6.4. Strategic Development
      1. 6.4.1. Acquisitions and Mergers
      2. 6.4.2. New Products
      3. 6.4.3. Research & Development Activities
  7. CHAPTER 7. Company Profiles
    1. 7.1. BASF
      1. 7.1.1. Company Overview
      2. 7.1.2. BASF Sales, Revenue, Price, and Gross Margin
      3. 7.1.3. Product portfolio
      4. 7.1.4. Recent initiatives
    2. 7.2. GAC CHEMICAL
      1. 7.2.1. Company Overview
      2. 7.2.2. GAC CHEMICAL Sales, Revenue, Price, and Gross Margin
      3. 7.2.3. Product portfolio
      4. 7.2.4. Recent initiatives
    3. 7.3. Nutrien Ltd
      1. 7.3.1. Company Overview
      2. 7.3.2. Nutrien Ltd Sales, Revenue, Price, and Gross Margin
      3. 7.3.3. Product portfolio
      4. 7.3.4. Recent initiatives
    4. 7.4. Vertellus Holdings LLC
      1. 7.4.1. Company Overview
      2. 7.4.2. Vertellus Holdings LLC Sales, Revenue, Price, and Gross Margin
      3. 7.4.3. Product portfolio
      4. 7.4.4. Recent initiatives
    5. 7.5. Royal DSM
      1. 7.5.1. Company Overview
      2. 7.5.2. Royal DSM Sales, Revenue, Price, and Gross Margin
      3. 7.5.3. Product portfolio
      4. 7.5.4. Recent initiatives
    6. 7.6. ArcelorMittal
      1. 7.6.1. Company Overview
      2. 7.6.2. ArcelorMittal Sales, Revenue, Price, and Gross Margin
      3. 7.6.3. Product portfolio
      4. 7.6.4. Recent initiatives
    7. 7.7. OCI Nitrogen
      1. 7.7.1. Company Overview
      2. 7.7.2. OCI Nitrogen Sales, Revenue, Price, and Gross Margin
      3. 7.7.3. Product portfolio
      4. 7.7.4. Recent initiatives
    8. 7.8. AdvanSix
      1. 7.8.1. Company Overview
      2. 7.8.2. AdvanSix Sales, Revenue, Price, and Gross Margin
      3. 7.8.3. Product portfolio
      4. 7.8.4. Recent initiatives
    9. 7.9. Sumitomo Chemical Co., Ltd
      1. 7.9.1. Company Overview
      2. 7.9.2. Sumitomo Chemical Co., Ltd Sales, Revenue, Price, and Gross Margin
      3. 7.9.3. Product portfolio
      4. 7.9.4. Recent initiatives
    10. 7.10. DOMO Chemicals
      1. 7.10.1. Company Overview
      2. 7.10.2. DOMO Chemicals Sales, Revenue, Price, and Gross Margin
      3. 7.10.3. Product portfolio
      4. 7.10.4. Recent initiatives
    11. 7.11. LANXESS
      1. 7.11.1. Company Overview
      2. 7.11.2. LANXESS Sales, Revenue, Price, and Gross Margin
      3. 7.11.3. Product portfolio
      4. 7.11.4. Recent initiatives
    12. 7.12. HELM AG
      1. 7.12.1. Company Overview
      2. 7.12.2. HELM AG Sales, Revenue, Price, and Gross Margin
      3. 7.12.3. Product portfolio
      4. 7.12.4. Recent initiatives
    13. 7.13. Merck KGaA
      1. 7.13.1. Company Overview
      2. 7.13.2. Merck KGaA Sales, Revenue, Price, and Gross Margin
      3. 7.13.3. Product portfolio
      4. 7.13.4. Recent initiatives
    14. 7.14. Honeywell International Inc
      1. 7.14.1. Company Overview
      2. 7.14.2. Honeywell International Inc Sales, Revenue, Price, and Gross Margin
      3. 7.14.3. Product portfolio
      4. 7.14.4. Recent initiatives
    15. 7.15. Evonik Industries AG
      1. 7.15.1. Company Overview
      2. 7.15.2. Evonik Industries AG Sales, Revenue, Price, and Gross Margin
      3. 7.15.3. Product portfolio
      4. 7.15.4. Recent initiatives
  8. CHAPTER 8. Ammonium Sulphate — Industry Analysis
    1. 8.1. Introduction and Taxonomy
    2. 8.2. Ammonium Sulphate Market – Key Trends
      1. 8.2.1. Market Drivers
      2. 8.2.2. Market Restraints
      3. 8.2.3. Market Opportunities
    3. 8.3. Value Chain Analysis
    4. 8.4. Key Mandates and Regulations
    5. 8.5. Technology Roadmap and Timeline
    6. 8.6. Ammonium Sulphate market – Attractiveness Analysis
      1. 8.6.1. By Product Type
      2. 8.6.2. By Application
      3. 8.6.3. By Region
  9. CHAPTER 9. Raw Material analysis
    1. 9.1. Ammonium Sulphate Key Raw Material Analysis
      1. 9.1.1. Key Raw Materials
      2. 9.1.2. Price Trend of Key Raw Materials
    2. 9.2. Key Suppliers of Raw Materials
    3. 9.3. Proportion of Manufacturing Cost Structure
      1. 9.3.1. Raw Materials
      2. 9.3.2. Labor Cost
    4. 9.4. Manufacturing Expenses Analysis of Ammonium Sulphate
  10. CHAPTER 10. Industrial Chain, Sourcing Strategy and Downstream Buyers
    1. 10.1. Ammonium Sulphate Industrial Chain Analysis
    2. 10.2. Upstream Raw Materials Sourcing
      1. 10.2.1. Risk Mitigation:
      2. 10.2.2. Supplier Relationships:
      3. 10.2.3. Business Processes:
      4. 10.2.4. Securing the Product:
    3. 10.3. Raw Materials Sources of Ammonium Sulphate Major Manufacturers in 2016
    4. 10.4. Downstream Buyers
    5. 10.5. Distributors/Traders List
  11. CHAPTER 11. Marketing Strategy Analysis, Distributors
    1. 11.1. Marketing Channel
    2. 11.2. Direct Marketing
    3. 11.3. Indirect Marketing
    4. 11.4. Marketing Channel Development Trend
    5. 11.5. Economic/Political Environmental Change
  12. CHAPTER 12. Report Conclusion
  13. CHAPTER 13. Research Approach & Methodology
    1. 13.1. Report Description
    2. 13.2. Research Scope
    3. 13.3. Research Methodology
      1. 13.3.1. Secondary Research
      2. 13.3.2. Primary Research
      3. 13.3.3. Models

  • List of Figures

    FIG. 1 Global Ammonium Sulphate Market, 2016-2026 (USD Million)
    FIG. 2 Global Ammonium Sulphate Market Share, by Product Type, 2019 & 2026 (USD Million)
    FIG. 3 Global Ammonium Sulphate Market share, by Product Type, 2019 & 2026 (Kilo Tons)
    FIG. 4 Global Solid Ammonium sulphate Ammonium Sulphate Market, 2016-2026 (USD Million)
    FIG. 5 Global Solid Ammonium sulphate Ammonium Sulphate  Market, 2016-2026 (Kilo Tons)
    FIG. 6 Global Liquid Ammonium sulphate Ammonium Sulphate Market, 2016-2026 (USD Million)
    FIG. 7 Global Liquid Ammonium sulphate Ammonium Sulphate  Market, 2016-2026 (Kilo Tons)
    FIG. 8 Global Ammonium Sulphate Market Share, by Application, 2019 & 2026 (USD Million)
    FIG. 9 Global Ammonium Sulphate Market share, by Application, 2019 & 2026 (Kilo Tons)
    FIG. 10 Global Fertilizers Ammonium Sulphate Market, 2016-2026 (USD Million)
    FIG. 11 Global Fertilizers Ammonium Sulphate  Market, 2016-2026 (Kilo Tons)
    FIG. 12 Global Food Additives Ammonium Sulphate Market, 2016-2026 (USD Million)
    FIG. 13 Global Food Additives Ammonium Sulphate  Market, 2016-2026 (Kilo Tons)
    FIG. 14 Global Pharmaceuticals Ammonium Sulphate Market, 2016-2026 (USD Million)
    FIG. 15 Global Pharmaceuticals Ammonium Sulphate  Market, 2016-2026 (Kilo Tons)
    FIG. 16 Global Water Treatment Ammonium Sulphate Market, 2016-2026 (USD Million)
    FIG. 17 Global Water Treatment Ammonium Sulphate  Market, 2016-2026 (Kilo Tons)
    FIG. 18 Global Industrial Use Ammonium Sulphate Market, 2016-2026 (USD Million)
    FIG. 19 Global Industrial Use Ammonium Sulphate  Market, 2016-2026 (Kilo Tons)
    FIG. 20 Global Others Ammonium Sulphate Market, 2016-2026 (USD Million)
    FIG. 21 Global Others Ammonium Sulphate  Market, 2016-2026 (Kilo Tons)
    FIG. 22 Global Ammonium Sulphate Market Share, by Region, 2019 & 2026
    FIG. 23 Global Ammonium Sulphate Market Share, by Region, 2019 & 2026
    FIG. 24 North America Ammonium Sulphate Market, 2016-2026
    FIG. 25 North America Ammonium Sulphate  Market, 2016-2026 (Kilo Tons)
    FIG. 26 U.S. Ammonium Sulphate Market, 2016-2026
    FIG. 27 U.S. Ammonium Sulphate  Market, 2016-2026 (Kilo Tons)
    FIG. 28 Canada Ammonium Sulphate Market, 2016-2026
    FIG. 29 Canada Ammonium Sulphate  Market, 2016-2026 (Kilo Tons)
    FIG. 30 Europe Ammonium Sulphate Market, 2016-2026
    FIG. 31 Europe Ammonium Sulphate  Market, 2016-2026 (Kilo Tons)
    FIG. 32 Germany Ammonium Sulphate Market, 2016-2026
    FIG. 33 Germany Ammonium Sulphate  Market, 2016-2026 (Kilo Tons)
    FIG. 34 France Ammonium Sulphate Market, 2016-2026
    FIG. 35 France Ammonium Sulphate  Market, 2016-2026 (Kilo Tons)
    FIG. 36 U.K. Ammonium Sulphate Market, 2016-2026
    FIG. 37 U.K. Ammonium Sulphate  Market, 2016-2026 (Kilo Tons)
    FIG. 38 Italy Ammonium Sulphate Market, 2016-2026
    FIG. 39 Italy Ammonium Sulphate  Market, 2016-2026 (Kilo Tons)
    FIG. 40 Spain Ammonium Sulphate Market, 2016-2026
    FIG. 41 Spain Ammonium Sulphate  Market, 2016-2026 (Kilo Tons)
    FIG. 42 Rest of Europe Ammonium Sulphate Market, 2016-2026
    FIG. 43 Rest of Europe Ammonium Sulphate  Market, 2016-2026 (Kilo Tons)
    FIG. 44 Asia Pacific Ammonium Sulphate Market, 2016-2026
    FIG. 45 Asia Pacific Ammonium Sulphate  Market, 2016-2026 (Kilo Tons)
    FIG. 46 China Ammonium Sulphate Market, 2016-2026
    FIG. 47 China Ammonium Sulphate  Market, 2016-2026 (Kilo Tons)
    FIG. 48 Japan Ammonium Sulphate Market, 2016-2026
    FIG. 49 Japan Ammonium Sulphate  Market, 2016-2026 (Kilo Tons)
    FIG. 50 India Ammonium Sulphate Market, 2016-2026
    FIG. 51 India Ammonium Sulphate  Market, 2016-2026 (Kilo Tons)
    FIG. 52 South  Korea Ammonium Sulphate Market, 2016-2026
    FIG. 53 South  Korea Ammonium Sulphate  Market, 2016-2026 (Kilo Tons)
    FIG. 54 South-East Asia Ammonium Sulphate Market, 2016-2026
    FIG. 55 South-East Asia Ammonium Sulphate  Market, 2016-2026 (Kilo Tons)
    FIG. 56 Rest of Asia Pacific Ammonium Sulphate Market, 2016-2026
    FIG. 57 Rest of Asia Pacific Ammonium Sulphate  Market, 2016-2026 (Kilo Tons)
    FIG. 58 Latin America Ammonium Sulphate Market, 2016-2026
    FIG. 59 Latin America Ammonium Sulphate  Market, 2016-2026 (Kilo Tons)
    FIG. 60 Brazil Ammonium Sulphate Market, 2016-2026
    FIG. 61 Brazil Ammonium Sulphate  Market, 2016-2026 (Kilo Tons)
    FIG. 62 Mexico Ammonium Sulphate Market, 2016-2026
    FIG. 63 Mexico Ammonium Sulphate  Market, 2016-2026 (Kilo Tons)
    FIG. 64 Rest of Latin America Ammonium Sulphate Market, 2016-2026
    FIG. 65 Rest of Latin America Ammonium Sulphate  Market, 2016-2026 (Kilo Tons)
    FIG. 66 The Middle-East and Africa Ammonium Sulphate Market, 2016-2026
    FIG. 67 The Middle-East and Africa Ammonium Sulphate  Market, 2016-2026 (Kilo Tons)
    FIG. 68 GCC Countries Ammonium Sulphate Market, 2016-2026
    FIG. 69 GCC Countries Ammonium Sulphate  Market, 2016-2026 (Kilo Tons)
    FIG. 70 South Africa Ammonium Sulphate Market, 2016-2026
    FIG. 71 South Africa Ammonium Sulphate  Market, 2016-2026 (Kilo Tons)
    FIG. 72 Rest of Middle-East Africa Ammonium Sulphate Market, 2016-2026
    FIG. 73 Rest of Middle-East Africa Ammonium Sulphate  Market, 2016-2026 (Kilo Tons)
    FIG. 74 Global Ammonium Sulphate production and revenue, 2016-2026 (USD Million) (Kilo Tons)
    FIG. 75 North America Ammonium Sulphate production and revenue, 2016-2026 (USD Million) (Kilo Tons)
    FIG. 76 Europe Ammonium Sulphate production and revenue, 2016-2026 (USD Million) (Kilo Tons)
    FIG. 77 Asia Pacific Ammonium Sulphate production and revenue, 2016-2026 (USD Million) (Kilo Tons)
    FIG. 78 Latin America Ammonium Sulphate production and revenue, 2016-2026 (USD Million) (Kilo Tons)
    FIG. 79 Middle East and Africa Ammonium Sulphate production and revenue, 2016-2026 (USD Million) (Kilo Tons)
    FIG. 80 Competitor Market Share – Revenue
    FIG. 81 Competitor Market Share – Volume
    FIG. 82 BASF Revenue and Growth Rate
    FIG. 83 BASF Market Share
    FIG. 84 GAC CHEMICAL Revenue and Growth Rate
    FIG. 85 GAC CHEMICAL Market Share
    FIG. 86 Nutrien Ltd Revenue and Growth Rate
    FIG. 87 Nutrien Ltd Market Share
    FIG. 88 Vertellus Holdings LLC Revenue and Growth Rate
    FIG. 89 Vertellus Holdings LLC Market Share
    FIG. 90 Royal DSM Revenue and Growth Rate
    FIG. 91 Royal DSM Market Share
    FIG. 92 ArcelorMittal Revenue and Growth Rate
    FIG. 93 ArcelorMittal Market Share
    FIG. 94 OCI Nitrogen Revenue and Growth Rate
    FIG. 95 OCI Nitrogen Market Share
    FIG. 96 AdvanSix Revenue and Growth Rate
    FIG. 97 AdvanSix Market Share
    FIG. 98 Sumitomo Chemical Co., Ltd Revenue and Growth Rate
    FIG. 99 Sumitomo Chemical Co., Ltd Market Share
    FIG. 100 DOMO Chemicals Revenue and Growth Rate
    FIG. 101 DOMO Chemicals Market Share
    FIG. 102 LANXESS Revenue and Growth Rate
    FIG. 103 LANXESS Market Share
    FIG. 104 HELM AG Revenue and Growth Rate
    FIG. 105 HELM AG Market Share
    FIG. 106 Merck KGaA Revenue and Growth Rate
    FIG. 107 Merck KGaA Market Share
    FIG. 108 Honeywell International Inc Revenue and Growth Rate
    FIG. 109 Honeywell International Inc Market Share
    FIG. 110 Evonik Industries AG Revenue and Growth Rate
    FIG. 111 Evonik Industries AG Market Share
    FIG. 112 Market Dynamics
    FIG. 113 Global Ammonium Sulphate – Value Chain Analysis
    FIG. 114 Key Mandates and Regulations
    FIG. 115 Technology Roadmap and Timeline
    FIG. 116 Market Attractiveness Analysis – By Product Type
    FIG. 117 Market Attractiveness Analysis – By Application
    FIG. 118 Market Attractiveness Analysis – By Region
    FIG. 119 Manufacturing Cost Structure of Ammonium Sulphate
    FIG. 120 Ammonium Sulphate Industrial Chain Analysis
    FIG. 121 Market Channel
    FIG. 122 Marketing Channel Development Trend
    FIG. 123 Growth in World Gross Product, 2008-2019

    List of Tables

    TABLE 1 Global Ammonium Sulphate market, 2019 & 2026 (USD Million)
    TABLE 2 Global Ammonium Sulphate market, by Product Type, 2016-2026 (USD Million)
    TABLE 3 Global Ammonium Sulphate market, by Product Type, 2016-2026 (Kilo Tons)
    TABLE 4 Global Ammonium Sulphate market, by Application, 2016-2026 (USD Million)
    TABLE 5 Global Ammonium Sulphate market, by Application, 2016-2026 (Kilo Tons)
    TABLE 6 Global Ammonium Sulphate market, by region, 2016-2026 (USD Million)
    TABLE 7 Global Ammonium Sulphate market, by region, 2016-2026 (Kilo Tons)
    TABLE 8 North America Ammonium Sulphate Market, by Product Type, 2016-2026 (USD Million)
    TABLE 9 North America Ammonium Sulphate Market, by Product Type, 2016-2026 (Kilo Tons)
    TABLE 10 North America Ammonium Sulphate Market, by Application, 2016-2026 (USD Million)
    TABLE 11 North America Ammonium Sulphate Market, by Application, 2016-2026 (Kilo Tons)
    TABLE 12 Europe Ammonium Sulphate Market, by Product Type, 2016-2026 (USD Million)
    TABLE 13 Europe Ammonium Sulphate Market, by Product Type, 2016-2026 (Kilo Tons)
    TABLE 14 Europe Ammonium Sulphate Market, by Application, 2016-2026 (USD Million)
    TABLE 15 Europe Ammonium Sulphate Market, by Application, 2016-2026 (Kilo Tons)
    TABLE 16 Asia Pacific Ammonium Sulphate Market, by Product Type, 2016-2026 (USD Million)
    TABLE 17 Asia Pacific Ammonium Sulphate Market, by Product Type, 2016-2026 (Kilo Tons)
    TABLE 18 Asia Pacific Ammonium Sulphate Market, by Application, 2016-2026 (USD Million)
    TABLE 19 Asia Pacific Ammonium Sulphate Market, by Application, 2016-2026 (Kilo Tons)
    TABLE 20 Latin America Ammonium Sulphate Market, by Product Type, 2016-2026 (USD Million)
    TABLE 21 Latin America Ammonium Sulphate Market, by Product Type, 2016-2026 (Kilo Tons)
    TABLE 22 Latin America Ammonium Sulphate Market, by Application, 2016-2026 (USD Million)
    TABLE 23 Latin America Ammonium Sulphate Market, by Application, 2016-2026 (Kilo Tons)
    TABLE 24 The Middle-East and Africa Ammonium Sulphate Market, by Product Type, 2016-2026 (USD Million)
    TABLE 25 The Middle-East and Africa Ammonium Sulphate Market, by Product Type, 2016-2026 (Kilo Tons)
    TABLE 26 The Middle-East and Africa Ammonium Sulphate Market, by Application, 2016-2026 (USD Million)
    TABLE 27 The Middle-East and Africa Ammonium Sulphate Market, by Application, 2016-2026 (Kilo Tons)
    TABLE 28 North America Ammonium Sulphate Production, Consumption, Export, Import, 2016-2019
    TABLE 29 Europe Ammonium Sulphate Production, Consumption, Export, Import, 2016-2019
    TABLE 30 Asia Pacific Ammonium Sulphate Production, Consumption, Export, Import, 2016-2019
    TABLE 31 Latin America Ammonium Sulphate Production, Consumption, Export, Import, 2016-2019
    TABLE 32 Middle East & Africa Ammonium Sulphate Production, Consumption, Export, Import, 2016-2019
    TABLE 33 Global Ammonium Sulphate Market - Company Revenue Analysis 2016-2019 (USD Million)
    TABLE 34 Global Ammonium Sulphate Market - Company Revenue Share Analysis 2016-2019(%)
    TABLE 35 Global Ammonium Sulphate Market - Company Volume Analysis 2016-2019 (Kilo Tons)
    TABLE 36 Global Ammonium Sulphate Market - Company Volume Share Analysis 2016-2019(%)
    TABLE 37 Acquisitions and Mergers
    TABLE 38 New Product/Service Launch
    TABLE 39 Research & Development Activities
    TABLE 40 Market Drivers
    TABLE 41 Market Restraints
    TABLE 42 Market Opportunities
    TABLE 43 Production Base and Market Concentration Rate of Raw Material
    TABLE 44 Key Suppliers of Raw Materials
    TABLE 45 Raw Materials Sources of Ammonium Sulphate Major Manufacturers in 2016
    TABLE 46 Major Buyers of Ammonium Sulphate
    TABLE 47 Distributors/Traders of Ammonium Sulphate by Region
    
  •  

    Industry Major Market Players

    •  BASF
    •  GAC CHEMICAL
    •  Nutrien Ltd
    •  Vertellus Holdings LLC
    •  Royal DSM
    •  ArcelorMittal
    •  OCI Nitrogen
    •  AdvanSix
    •  Sumitomo Chemical Co. Ltd
    •  DOMO Chemicals
    •  LANXESS
    •  HELM AG
    •  Merck KGaA
    •  Honeywell International Inc
    •  Evonik Industries AG