Search Market Research Report

Discover Our Latest Reports
Discover Our Featured Reports
Discover Top Selling Reports

Aluminum Market Size, Share Global Analysis Report, 2020–2026

report img

Aluminum Market By Product (Flat Products, Extruded Products, Forged Products, Long Products, Cast Products) By Processing Method (Rolling, Extruding, Drawn, Casting, Forging)and By Application (Transport, Construction, Electrical & Electronics, Packaging, Equipment & Machinery, Consumer Durables, Foil Stock): Global Industry Outlook, Market Size, Business Intelligence, Consumer Preferences, Statistical Surveys, Comprehensive Analysis, Historical Developments, Current Trends, and Forecast 2020–2026

Industry Insights

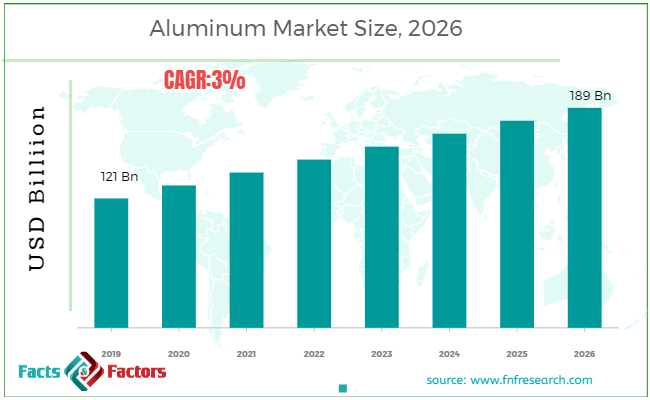
[190+ Pages Report] According to the report published by Facts Factors, the global aluminum market size was worth around USD 121 billion in 2019 and is predicted to grow to around USD 189 billion by 2026 with a compound annual growth rate (CAGR) of roughly 3% between 2023 and 2030. The report analyzes the global aluminum market drivers, restraints/challenges, and the effect they have on the demands during the projection period. In addition, the report explores emerging opportunities in the aluminum market.

The aluminum market report analyzes and notifies the industry statistics at the global as well as regional and country levels in order to acquire a thorough perspective of the entire Aluminum market. The historical and past insights are provided for FY 2016 to FY 2019 whereas projected trends are delivered for FY 2020 to FY 2026. The quantitative and numerical data is represented in terms of both volume (Kilo Tons) and value (USD Million) from FY 2016 – 2026.

Aluminum Market Size

To know more about this report | Request Free Sample Copy


logoKey Insights from Primary Research

  • As per our primary respondents, the Aluminum market is set to grow at a CAGR of around 3%.
  • Through this primary research, it was established that the Aluminum market was valued at around USD 121 Billion in 2019.
  • The “extruded product” category, based on product segmentation, is expected to share the maximum revenue in 2019.
  • Based on the segmentation of the processing method, the rolling processing method is anticipated to dominate the market.
  • Based on application segmentation, “electrical and electronics” is expected to dominate the market.

logoKey Recommendations from Analysts

  • As per our analysts, the aluminum market is growing tremendously owing to its renewable characteristics where it can be recycled and can be used multiple times without losing its properties.
  • Owing to its versatility in multiple applications like construction, automobile, electronics, packaging, and machinery, the demand for aluminum would grow in the forecasted period.
  • Rapid industrialization in the region of Asia Pacific provides lucrative options for investments in the forecasted period.
  • As the aluminum market is growing at a CAGR of around 3%, it provides good opportunities for its shareholders in gaining good profits in the forecasted period.
  • Our analysts have identified “forged products” and “forging” categories as the leading investment pockets for the aluminum market in terms of product and processing method segmentations respectively.

The quantitative data is further underlined and reinforced by comprehensive qualitative data which comprises various across-the-board market dynamics. The rationales which directly or indirectly impact the Aluminum industry are exemplified through parameters such as growth drivers, restraints, challenges, and opportunities among other impacting factors.

Throughout our research report, we have encompassed all the proven models and tools of industry analysis and extensively illustrated all the key business strategies and business models adopted in the Aluminum industry. The report provides an all-inclusive and detailed competitive landscape prevalent in the Aluminum market.

The report utilizes established industry analysis tools and models such as Porter’s Five Forces framework to analyze and recognize critical business strategies adopted by various stakeholders involved in the entire value chain of the Aluminum industry. The Aluminum market report additionally employs SWOT analysis and PESTLE analysis models for further in-depth analysis.

The report study further includes an in-depth analysis of industry players' market shares and provides an overview of leading players' market positions in the Aluminum sector. Key strategic developments in the Aluminum market competitive landscape such as acquisitions & mergers, inaugurations of different products and services, partnerships & joint ventures, MoU agreements, VC & funding activities, R&D activities, and geographic expansion among other noteworthy activities by key players of the Aluminum market are appropriately highlighted in the report.

Aluminum with the chemical symbol Al and atomic number 13 is a soft, silvery-white, and non-magnetic material that is the third most abundant element available on the earth. Aluminum has a low density and provides good resistance against corrosion. Due to their growing demand in the packaging and construction industry, the aluminum market is expected to see significant growth in the forecast era. Because aluminum is lighter compared to other metals such as iron and corrosion-resistant, it is commonly used in the automobile, oil, and aviation industries, which in turn causes the aluminum, market to rise.

The Aluminum market research report delivers an acute valuation and taxonomy of the Aluminum industry by practically splitting the market on the basis of different types, applications, and regions. Through the analysis of the historical and projected trends, all the segments and sub-segments were evaluated through the bottom-up approach, and different market sizes have been projected for FY 2020 to FY 2026.

logoReport Scope

Report Attribute

Details

Market Size in 2019

USD 121 Billion

Projected Market Size in 2026

USD 189 Billion

CAGR Growth Rate

3% CAGR

Base Year

2019

Forecast Years

2020-2026

Key Market Players

Chalco, Rusal, Rio Tinto, Norsk Hydro, Hongqiao Group, Hindalco, Novelis, Alcoa Corporation, and Others

Key Segment

By Product, Processing, Application, and Region

Major Regions Covered

North America, Europe, Asia Pacific, Latin America, and the Middle East & Africa

Purchase Options

Request customized purchase options to meet your research needs. Explore purchase options

The regional segmentation of the Aluminum industry includes the complete classification of all the major continents including North America, Latin America, Europe, Asia Pacific, and the Middle East & Africa. Further, country-wise data for the Aluminum industry is provided for the leading economies of the world.

The Aluminum market is segmented based on Product, Processing Method, and Application. On the basis of product segmentation, the market is classified into Flat Products, Extruded Products, Forged Products, Long Products, and Cast Products. In terms of processing methods, the market is divided into Rolling, Extruding, Drawn, Casting, and Forging. In terms of Application segmentation, the market is bifurcated into Transport, Construction, Electrical & Electronics, Packaging, Equipment & Machinery, Consumer Durables, and Foil Stock.

logoSome of the essential players operating in the Aluminum market, but not restricted to include

  • Chalco
  •  Rusal
  •  Rio Tinto
  •  Norsk Hydro
  •  Hongqiao Group
  •  Hindalco
  •  Novelis
  •  Alcoa Corporation

The taxonomy of the Aluminum Market by its scope and segmentation is as follows:

logo By Product Segmentation Analysis (Customizable)

  • Flat Products
  • Extruded Products
  • Forged Products
  • Long Products
  • Cast Products

logo By Processing Method Segmentation Analysis (Customizable)

  • Rolling
  • Extruding
  • Drawn
  • Casting
  • Forging

logo By Application Segmentation Analysis (Customizable)

  • Transport
  • Construction
  • Electrical & Electronics
  • Packaging
  • Equipment & Machinery
  • Consumer Durables
  • Foil Stock

logo Regional Segmentation Analysis (Customizable)

  • North America
    • The U.S.
    • Canada
  • Europe
    • Germany
    • The UK
    • France
    • Spain
    • Italy
    • Rest of Europe
  • Asia Pacific
    • China
    • Japan
    • India
    • South Korea
    • Southeast Asia
    • Rest of Asia Pacific
  • Latin America
    • Brazil
    • Mexico
    • Rest of Latin America
  • Middle East & Africa
    • GCC
    • South Africa
    • Rest of Middle East & Africa

Table of Content

  1. CHAPTER 1. Executive Summary
  2. CHAPTER 2. Aluminum market – Product Analysis
    1. 2.1. Global Aluminum Market – Product Overview
    2. 2.2. Global Aluminum Market Share, by Product, 2018 & 2025 (USD Million)
    3. 2.3. Global Aluminum Market share, by Product, 2018 & 2025 (Kilo Tons)
    4. 2.4. Flat Products
      1. 2.4.1. Global Flat Products Aluminum Market, 2016-2026 (USD Million)
      2. 2.4.2. Global Flat Products Aluminum Market, 2016-2026 (Kilo Tons)
    5. 2.5. Extruded Products
      1. 2.5.1. Global Extruded Products Aluminum Market, 2016-2026 (USD Million)
      2. 2.5.2. Global Extruded Products Aluminum Market, 2016-2026 (Kilo Tons)
    6. 2.6. Forged Products
      1. 2.6.1. Global Forged Products Aluminum Market, 2016-2026 (USD Million)
      2. 2.6.2. Global Forged Products Aluminum Market, 2016-2026 (Kilo Tons)
    7. 2.7. Long Products
      1. 2.7.1. Global Long Products Aluminum Market, 2016-2026 (USD Million)
      2. 2.7.2. Global Long Products Aluminum Market, 2016-2026 (Kilo Tons)
    8. 2.8. Cast Products
      1. 2.8.1. Global Cast Products Aluminum Market, 2016-2026 (USD Million)
      2. 2.8.2. Global Cast Products Aluminum Market, 2016-2026 (Kilo Tons)
  3. CHAPTER 3. Aluminum market – Processing Method Analysis
    1. 3.1. Global Aluminum Market – Processing Method Overview
    2. 3.2. Global Aluminum Market Share, by Processing Method, 2018 & 2025 (USD Million)
    3. 3.3. Global Aluminum Market share, by Processing Method, 2018 & 2025 (Kilo Tons)
    4. 3.4. Rolling
      1. 3.4.1. Global Rolling Aluminum Market, 2016-2026 (USD Million)
      2. 3.4.2. Global Rolling Aluminum Market, 2016-2026 (Kilo Tons)
    5. 3.5. Extruding
      1. 3.5.1. Global Extruding Aluminum Market, 2016-2026 (USD Million)
      2. 3.5.2. Global Extruding Aluminum Market, 2016-2026 (Kilo Tons)
    6. 3.6. Drawn
      1. 3.6.1. Global Drawn Aluminum Market, 2016-2026 (USD Million)
      2. 3.6.2. Global Drawn Aluminum Market, 2016-2026 (Kilo Tons)
    7. 3.7. Casting
      1. 3.7.1. Global Casting Aluminum Market, 2016-2026 (USD Million)
      2. 3.7.2. Global Casting Aluminum Market, 2016-2026 (Kilo Tons)
    8. 3.8. Forging
      1. 3.8.1. Global Forging Aluminum Market, 2016-2026 (USD Million)
      2. 3.8.2. Global Forging Aluminum Market, 2016-2026 (Kilo Tons)
  4. CHAPTER 4. Aluminum market – Application Analysis
    1. 4.1. Global Aluminum Market – Application Overview
    2. 4.2. Global Aluminum Market Share, by Application, 2018 & 2025 (USD Million)
    3. 4.3. Global Aluminum Market share, by Application, 2018 & 2025 (Kilo Tons)
    4. 4.4. Transport
      1. 4.4.1. Global Transport Aluminum Market, 2016-2026 (USD Million)
      2. 4.4.2. Global Transport Aluminum Market, 2016-2026 (Kilo Tons)
    5. 4.5. Construction
      1. 4.5.1. Global Construction Aluminum Market, 2016-2026 (USD Million)
      2. 4.5.2. Global Construction Aluminum Market, 2016-2026 (Kilo Tons)
    6. 4.6. Electrical & Electronics
      1. 4.6.1. Global Electrical & Electronics Aluminum Market, 2016-2026 (USD Million)
      2. 4.6.2. Global Electrical & Electronics Aluminum Market, 2016-2026 (Kilo Tons)
    7. 4.7. Packaging
      1. 4.7.1. Global Packaging Aluminum Market, 2016-2026 (USD Million)
      2. 4.7.2. Global Packaging Aluminum Market, 2016-2026 (Kilo Tons)
    8. 4.8. Equipment & Machinery
      1. 4.8.1. Global Equipment & Machinery Aluminum Market, 2016-2026 (USD Million)
      2. 4.8.2. Global Equipment & Machinery Aluminum Market, 2016-2026 (Kilo Tons)
    9. 4.9. Consumer Durables
      1. 4.9.1. Global Consumer Durables Aluminum Market, 2016-2026 (USD Million)
      2. 4.9.2. Global Consumer Durables Aluminum Market, 2016-2026 (Kilo Tons)
    10. 4.10. Foil Stock
      1. 4.10.1. Global Foil Stock Aluminum Market, 2016-2026 (USD Million)
      2. 4.10.2. Global Foil Stock Aluminum Market, 2016-2026 (Kilo Tons)
  5. CHAPTER 5. Aluminum market – Regional Analysis
    1. 5.1. Global Aluminum Market Regional Overview
    2. 5.2. Global Aluminum Market Share, by Region, 2018 & 2025 (Value)
    3. 5.3. Global Aluminum Market Share, by Region, 2018 & 2025 (Volume)
    4. 5.4. North America
      1. 5.4.1. North America Aluminum Market size and forecast, 2016-2026
      2. 5.4.2. North America Aluminum Market, by Country, 2018 - 2025 (USD Million)
      3. 5.4.3. North America Market size and forecast, 2016-2026 (Kilo Tons)
      4. 5.4.4. North America Aluminum Market, by Country, 2018 - 2025 (Kilo Tons)
      5. 5.4.5. North America Aluminum Market, by Product, 2016-2026
        1. 5.4.5.1. North America Aluminum Market, by Product, 2016-2026 (USD Million)
        2. 5.4.5.2. North America Aluminum Market, by Product, 2016-2026 (Kilo Tons)
      6. 5.4.6. North America Aluminum Market, by Processing Method, 2016-2026
        1. 5.4.6.1. North America Aluminum Market, by Processing Method, 2016-2026 (USD Million)
        2. 5.4.6.2. North America Aluminum Market, by Processing Method, 2016-2026 (Kilo Tons)
      7. 5.4.7. North America Aluminum Market, by Application, 2016-2026
        1. 5.4.7.1. North America Aluminum Market, by Application, 2016-2026 (USD Million)
        2. 5.4.7.2. North America Aluminum Market, by Application, 2016-2026 (Kilo Tons)
      8. 5.4.8. U.S.
        1. 5.4.8.1. U.S. Market size and forecast, 2016-2026 (USD Million)
        2. 5.4.8.2. U.S. Market size and forecast, 2016-2026 (Kilo Tons)
      9. 5.4.9. Canada
        1. 5.4.9.1. Canada Market size and forecast, 2016-2026 (USD Million)
        2. 5.4.9.2. Canada Market size and forecast, 2016-2026 (Kilo Tons)
    5. 5.5. Europe
      1. 5.5.1. Europe Aluminum Market size and forecast, 2016-2026
      2. 5.5.2. Europe Aluminum Market, by Country, 2018 - 2025 (USD Million)
      3. 5.5.3. Europe Market size and forecast, 2016-2026 (Kilo Tons)
      4. 5.5.4. Europe Aluminum Market, by Country, 2018 - 2025 (Kilo Tons)
      5. 5.5.5. Europe Aluminum Market, by Product, 2016-2026
        1. 5.5.5.1. Europe Aluminum Market, by Product, 2016-2026 (USD Million)
        2. 5.5.5.2. Europe Aluminum Market, by Product, 2016-2026 (Kilo Tons)
      6. 5.5.6. Europe Aluminum Market, by Processing Method, 2016-2026
        1. 5.5.6.1. Europe Aluminum Market, by Processing Method, 2016-2026 (USD Million)
        2. 5.5.6.2. Europe Aluminum Market, by Processing Method, 2016-2026 (Kilo Tons)
      7. 5.5.7. Europe Aluminum Market, by Application, 2016-2026
        1. 5.5.7.1. Europe Aluminum Market, by Application, 2016-2026 (USD Million)
        2. 5.5.7.2. Europe Aluminum Market, by Application, 2016-2026 (Kilo Tons)
      8. 5.5.8. Germany
        1. 5.5.8.1. Germany Market size and forecast, 2016-2026 (USD Million)
        2. 5.5.8.2. Germany Market size and forecast, 2016-2026 (Kilo Tons)
      9. 5.5.9. France
        1. 5.5.9.1. France Market size and forecast, 2016-2026 (USD Million)
        2. 5.5.9.2. France Market size and forecast, 2016-2026 (Kilo Tons)
      10. 5.5.10. U.K.
        1. 5.5.10.1. U.K. Market size and forecast, 2016-2026 (USD Million)
        2. 5.5.10.2. U.K. Market size and forecast, 2016-2026 (Kilo Tons)
      11. 5.5.11. Italy
        1. 5.5.11.1. Italy Market size and forecast, 2016-2026 (USD Million)
        2. 5.5.11.2. Italy Market size and forecast, 2016-2026 (Kilo Tons)
      12. 5.5.12. Spain
        1. 5.5.12.1. Spain Market size and forecast, 2016-2026 (USD Million)
        2. 5.5.12.2. Spain Market size and forecast, 2016-2026 (Kilo Tons)
      13. 5.5.13. Rest of Europe
        1. 5.5.13.1. Rest of Europe Market size and forecast, 2016-2026 (USD Million)
        2. 5.5.13.2. Rest of Europe Market size and forecast, 2016-2026 (Kilo Tons)
    6. 5.6. Asia Pacific
      1. 5.6.1. Asia Pacific Aluminum Market size and forecast, 2016-2026
      2. 5.6.2. Asia Pacific Aluminum Market, by Country, 2018 - 2025 (USD Million)
      3. 5.6.3. Asia Pacific Market size and forecast, 2016-2026 (Kilo Tons)
      4. 5.6.4. Asia Pacific Aluminum Market, by Country, 2018 - 2025 (Kilo Tons)
      5. 5.6.5. Asia Pacific Aluminum Market, by Product, 2016-2026
        1. 5.6.5.1. Asia Pacific Aluminum Market, by Product, 2016-2026 (USD Million)
        2. 5.6.5.2. Asia Pacific Aluminum Market, by Product, 2016-2026 (Kilo Tons)
      6. 5.6.6. Asia Pacific Aluminum Market, by Processing Method, 2016-2026
        1. 5.6.6.1. Asia Pacific Aluminum Market, by Processing Method, 2016-2026 (USD Million)
        2. 5.6.6.2. Asia Pacific Aluminum Market, by Processing Method, 2016-2026 (Kilo Tons)
      7. 5.6.7. Asia Pacific Aluminum Market, by Application, 2016-2026
        1. 5.6.7.1. Asia Pacific Aluminum Market, by Application, 2016-2026 (USD Million)
        2. 5.6.7.2. Asia Pacific Aluminum Market, by Application, 2016-2026 (Kilo Tons)
      8. 5.6.8. China
        1. 5.6.8.1. China Market size and forecast, 2016-2026 (USD Million)
        2. 5.6.8.2. China Market size and forecast, 2016-2026 (Kilo Tons)
      9. 5.6.9. Japan
        1. 5.6.9.1. Japan Market size and forecast, 2016-2026 (USD Million)
        2. 5.6.9.2. Japan Market size and forecast, 2016-2026 (Kilo Tons)
      10. 5.6.10. India
        1. 5.6.10.1. India Market size and forecast, 2016-2026 (USD Million)
        2. 5.6.10.2. India Market size and forecast, 2016-2026 (Kilo Tons)
      11. 5.6.11. South Korea
        1. 5.6.11.1. South Korea Market size and forecast, 2016-2026 (USD Million)
        2. 5.6.11.2. South Korea Market size and forecast, 2016-2026 (Kilo Tons)
      12. 5.6.12. South-East Asia
        1. 5.6.12.1. South-East Asia Market size and forecast, 2016-2026 (USD Million)
        2. 5.6.12.2. South-East Asia Market size and forecast, 2016-2026 (Kilo Tons)
      13. 5.6.13. Rest of Asia Pacific
        1. 5.6.13.1. Rest of Asia Pacific Market size and forecast, 2016-2026 (USD Million)
        2. 5.6.13.2. Rest of Asia Pacific Market size and forecast, 2016-2026 (Kilo Tons)
    7. 5.7. Latin America
      1. 5.7.1. Latin America Aluminum Market size and forecast, 2016-2026
      2. 5.7.2. Latin America Aluminum Market, by Country, 2018 - 2025 (USD Million)
      3. 5.7.3. Latin America Market size and forecast, 2016-2026 (Kilo Tons)
      4. 5.7.4. Latin America Aluminum Market, by Country, 2018 - 2025 (Kilo Tons)
      5. 5.7.5. Latin America Aluminum Market, by Product, 2016-2026
        1. 5.7.5.1. Latin America Aluminum Market, by Product, 2016-2026 (USD Million)
        2. 5.7.5.2. Latin America Aluminum Market, by Product, 2016-2026 (Kilo Tons)
      6. 5.7.6. Latin America Aluminum Market, by Processing Method, 2016-2026
        1. 5.7.6.1. Latin America Aluminum Market, by Processing Method, 2016-2026 (USD Million)
        2. 5.7.6.2. Latin America Aluminum Market, by Processing Method, 2016-2026 (Kilo Tons)
      7. 5.7.7. Latin America Aluminum Market, by Application, 2016-2026
        1. 5.7.7.1. Latin America Aluminum Market, by Application, 2016-2026 (USD Million)
        2. 5.7.7.2. Latin America Aluminum Market, by Application, 2016-2026 (Kilo Tons)
      8. 5.7.8. Brazil
        1. 5.7.8.1. Brazil Market size and forecast, 2016-2026 (USD Million)
        2. 5.7.8.2. Brazil Market size and forecast, 2016-2026 (Kilo Tons)
      9. 5.7.9. Mexico
        1. 5.7.9.1. Mexico Market size and forecast, 2016-2026 (USD Million)
        2. 5.7.9.2. Mexico Market size and forecast, 2016-2026 (Kilo Tons)
      10. 5.7.10. Rest of Latin America
        1. 5.7.10.1. Rest of Latin America Market size and forecast, 2016-2026 (USD Million)
        2. 5.7.10.2. Rest of Latin America Market size and forecast, 2016-2026 (Kilo Tons)
    8. 5.8. The Middle-East and Africa
      1. 5.8.1. The Middle-East and Africa Aluminum Market size and forecast, 2016-2026
      2. 5.8.2. The Middle-East and Africa Aluminum Market, by Country, 2018 - 2025 (USD Million)
      3. 5.8.3. The Middle-East and Africa Market size and forecast, 2016-2026 (Kilo Tons)
      4. 5.8.4. The Middle-East and Africa Aluminum Market, by Country, 2018 - 2025 (Kilo Tons)
      5. 5.8.5. The Middle-East and Africa Aluminum Market, by Product, 2016-2026
        1. 5.8.5.1. The Middle-East and Africa Aluminum Market, by Product, 2016-2026 (USD Million)
        2. 5.8.5.2. The Middle-East and Africa Aluminum Market, by Product, 2016-2026 (Kilo Tons)
      6. 5.8.6. The Middle-East and Africa Aluminum Market, by Processing Method, 2016-2026
        1. 5.8.6.1. The Middle-East and Africa Aluminum Market, by Processing Method, 2016-2026 (USD Million)
        2. 5.8.6.2. The Middle-East and Africa Aluminum Market, by Processing Method, 2016-2026 (Kilo Tons)
      7. 5.8.7. The Middle-East and Africa Aluminum Market, by Application, 2016-2026
        1. 5.8.7.1. The Middle-East and Africa Aluminum Market, by Application, 2016-2026 (USD Million)
        2. 5.8.7.2. The Middle-East and Africa Aluminum Market, by Application, 2016-2026 (Kilo Tons)
      8. 5.8.8. GCC Countries
        1. 5.8.8.1. GCC Countries Market size and forecast, 2016-2026 (USD Million)
        2. 5.8.8.2. GCC Countries Market size and forecast, 2016-2026 (Kilo Tons)
      9. 5.8.9. South Africa
        1. 5.8.9.1. South Africa Market size and forecast, 2016-2026 (USD Million)
        2. 5.8.9.2. South Africa Market size and forecast, 2016-2026 (Kilo Tons)
      10. 5.8.10. Rest of Middle-East Africa
        1. 5.8.10.1. Rest of Middle-East Africa Market size and forecast, 2016-2026 (USD Million)
        2. 5.8.10.2. Rest of Middle-East Africa Market size and forecast, 2016-2026 (Kilo Tons)
  6. CHAPTER 6. Aluminum Production, Consumption, Export, Import by Regions
    1. 6.1. Global Aluminum production and revenue, 2015-2025 (USD Million) (Kilo Tons)
    2. 6.2. Global Import and Export Analysis, by Region
  7. CHAPTER 7. Aluminum market – Competitive Landscape
    1. 7.1. Competitor Market Share – Revenue
    2. 7.2. Market Concentration Rate Analysis, Top 3 and Top 5 Players
    3. 7.3. Competitor Market Share – Volume
    4. 7.4. Strategic Development
      1. 7.4.1. Acquisitions and Mergers
      2. 7.4.2. New Products
      3. 7.4.3. Research & Development Activities
  8. CHAPTER 8. Company Profiles
    1. 8.1. Chalco
      1. 8.1.1. Company Overview
      2. 8.1.2. Chalco Sales, Revenue, Price, and Gross Margin
      3. 8.1.3. Product portfolio
      4. 8.1.4. Recent initiatives
    2. 8.2. Rusal
      1. 8.2.1. Company Overview
      2. 8.2.2. Rusal Sales, Revenue, Price, and Gross Margin
      3. 8.2.3. Product portfolio
      4. 8.2.4. Recent initiatives
    3. 8.3. Rio Tinto
      1. 8.3.1. Company Overview
      2. 8.3.2. Rio Tinto Sales, Revenue, Price, and Gross Margin
      3. 8.3.3. Product portfolio
      4. 8.3.4. Recent initiatives
    4. 8.4. Norsk Hydro
      1. 8.4.1. Company Overview
      2. 8.4.2. Norsk Hydro Sales, Revenue, Price, and Gross Margin
      3. 8.4.3. Product portfolio
      4. 8.4.4. Recent initiatives
    5. 8.5. Hongqiao Group
      1. 8.5.1. Company Overview
      2. 8.5.2. Hongqiao Group Sales, Revenue, Price, and Gross Margin
      3. 8.5.3. Product portfolio
      4. 8.5.4. Recent initiatives
    6. 8.6. Hindalco
      1. 8.6.1. Company Overview
      2. 8.6.2. Hindalco Sales, Revenue, Price, and Gross Margin
      3. 8.6.3. Product portfolio
      4. 8.6.4. Recent initiatives
    7. 8.7. Novelis
      1. 8.7.1. Company Overview
      2. 8.7.2. Novelis Sales, Revenue, Price, and Gross Margin
      3. 8.7.3. Product portfolio
      4. 8.7.4. Recent initiatives
    8. 8.8. Alcoa Corporation
      1. 8.8.1. Company Overview
      2. 8.8.2. Alcoa Corporation Sales, Revenue, Price, and Gross Margin
      3. 8.8.3. Product portfolio
      4. 8.8.4. Recent initiatives
    9. 8.9. Others
      1. 8.9.1. Company Overview
      2. 8.9.2. Others Sales, Revenue, Price, and Gross Margin
      3. 8.9.3. Product portfolio
      4. 8.9.4. Recent initiatives
  9. CHAPTER 9. Aluminum — Industry Analysis
    1. 9.1. Introduction and Taxonomy
    2. 9.2. Aluminum Market – Key Trends
      1. 9.2.1. Market Drivers
      2. 9.2.2. Market Restraints
      3. 9.2.3. Market Opportunities
    3. 9.3. Value Chain Analysis
    4. 9.4. Key Mandates and Regulations
    5. 9.5. Technology Roadmap and Timeline
    6. 9.6. Aluminum market – Attractiveness Analysis
      1. 9.6.1. By Product
      2. 9.6.2. By Processing Method
      3. 9.6.3. By Application
      4. 9.6.4. By Region
  10. CHAPTER 10. Raw Material analysis
    1. 10.1. Aluminum Key Raw Material Analysis
      1. 10.1.1. Key Raw Materials
      2. 10.1.2. Price Trend of Key Raw Materials
    2. 10.2. Key Suppliers of Raw Materials
    3. 10.3. Proportion of Manufacturing Cost Structure
      1. 10.3.1. Raw Materials
      2. 10.3.2. Labor Cost
    4. 10.4. Manufacturing Expenses Analysis of Aluminum
  11. CHAPTER 11. Industrial Chain, Sourcing Strategy and Downstream Buyers
    1. 11.1. Aluminum Industrial Chain Analysis
    2. 11.2. Upstream Raw Materials Sourcing
      1. 11.2.1. Risk Mitigation:
      2. 11.2.2. Supplier Relationships:
      3. 11.2.3. Business Processes:
      4. 11.2.4. Securing the Product:
    3. 11.3. Raw Materials Sources of Aluminum Major Manufacturers in 2016
    4. 11.4. Downstream Buyers
    5. 11.5. Distributors/Traders List
  12. CHAPTER 12. Marketing Strategy Analysis, Distributors
    1. 12.1. Marketing Channel
    2. 12.2. Direct Marketing
    3. 12.3. Indirect Marketing
    4. 12.4. Marketing Channel Development Trend
    5. 12.5. Economic/Political Environmental Change
  13. CHAPTER 13. Report Conclusion
  14. CHAPTER 14. Research Approach & Methodology
    1. 14.1. Report Description
    2. 14.2. Research Scope
    3. 14.3. Research Methodology
      1. 14.3.1. Secondary Research
      2. 14.3.2. Primary Research
      3. 14.3.3. Models
        1. 14.3.3.1. Company Share Analysis Model
        2. 14.3.3.2. Revenue Based Modeling
        3. 14.3.3.3. Research Limitations

        List of Figures

        FIG. 1 Global Aluminum Market, 2016-2026 (USD Million)
        FIG. 2 Global Aluminum Market Share, by Product, 2018 & 2025 (USD Million)
        FIG. 3 Global Aluminum Market share, by Product, 2018 & 2025 (Kilo Tons)
        FIG. 4 Global  Flat Products Aluminum Market, 2016-2026 (USD Million)
        FIG. 5 Global  Flat Products Aluminum  Market, 2016-2026 (Kilo Tons)
        FIG. 6 Global Extruded Products Aluminum Market, 2016-2026 (USD Million)
        FIG. 7 Global Extruded Products Aluminum  Market, 2016-2026 (Kilo Tons)
        FIG. 8 Global Forged Products Aluminum Market, 2016-2026 (USD Million)
        FIG. 9 Global Forged Products Aluminum  Market, 2016-2026 (Kilo Tons)
        FIG. 10 Global Long Products Aluminum Market, 2016-2026 (USD Million)
        FIG. 11 Global Long Products Aluminum  Market, 2016-2026 (Kilo Tons)
        FIG. 12 Global Cast Products Aluminum Market, 2016-2026 (USD Million)
        FIG. 13 Global Cast Products Aluminum  Market, 2016-2026 (Kilo Tons)
        FIG. 14 Global Aluminum Market Share, by Processing Method, 2018 & 2025 (USD Million)
        FIG. 15 Global Aluminum Market share, by Processing Method, 2018 & 2025 (Kilo Tons)
        FIG. 16 Global Rolling Aluminum Market, 2016-2026 (USD Million)
        FIG. 17 Global Rolling Aluminum  Market, 2016-2026 (Kilo Tons)
        FIG. 18 Global Extruding Aluminum Market, 2016-2026 (USD Million)
        FIG. 19 Global Extruding Aluminum  Market, 2016-2026 (Kilo Tons)
        FIG. 20 Global Drawn Aluminum Market, 2016-2026 (USD Million)
        FIG. 21 Global Drawn Aluminum  Market, 2016-2026 (Kilo Tons)
        FIG. 22 Global Casting Aluminum Market, 2016-2026 (USD Million)
        FIG. 23 Global Casting Aluminum  Market, 2016-2026 (Kilo Tons)
        FIG. 24 Global Forging Aluminum Market, 2016-2026 (USD Million)
        FIG. 25 Global Forging Aluminum  Market, 2016-2026 (Kilo Tons)
        FIG. 26 Global Aluminum Market Share, by Application, 2018 & 2025 (USD Million)
        FIG. 27 Global Aluminum Market share, by Application, 2018 & 2025 (Kilo Tons)
        FIG. 28 Global Transport Aluminum Market, 2016-2026 (USD Million)
        FIG. 29 Global Transport Aluminum  Market, 2016-2026 (Kilo Tons)
        FIG. 30 Global Construction Aluminum Market, 2016-2026 (USD Million)
        FIG. 31 Global Construction Aluminum  Market, 2016-2026 (Kilo Tons)
        FIG. 32 Global Electrical & Electronics Aluminum Market, 2016-2026 (USD Million)
        FIG. 33 Global Electrical & Electronics Aluminum  Market, 2016-2026 (Kilo Tons)
        FIG. 34 Global Packaging Aluminum Market, 2016-2026 (USD Million)
        FIG. 35 Global Packaging Aluminum  Market, 2016-2026 (Kilo Tons)
        FIG. 36 Global Equipment & Machinery Aluminum Market, 2016-2026 (USD Million)
        FIG. 37 Global Equipment & Machinery Aluminum  Market, 2016-2026 (Kilo Tons)
        FIG. 38 Global Consumer Durables Aluminum Market, 2016-2026 (USD Million)
        FIG. 39 Global Consumer Durables Aluminum  Market, 2016-2026 (Kilo Tons)
        FIG. 40 Global Foil Stock Aluminum Market, 2016-2026 (USD Million)
        FIG. 41 Global Foil Stock Aluminum  Market, 2016-2026 (Kilo Tons)
        FIG. 42 Global Aluminum Market Share, by Region, 2018 & 2025
        FIG. 43 Global Aluminum Market Share, by Region, 2018 & 2025
        FIG. 44 North America Aluminum Market, 2016-2026
        FIG. 45 North America Aluminum  Market, 2016-2026 (Kilo Tons)
        FIG. 46 U.S. Aluminum Market, 2016-2026
        FIG. 47 U.S. Aluminum  Market, 2016-2026 (Kilo Tons)
        FIG. 48 Canada Aluminum Market, 2016-2026
        FIG. 49 Canada Aluminum  Market, 2016-2026 (Kilo Tons)
        FIG. 50 Europe Aluminum Market, 2016-2026
        FIG. 51 Europe Aluminum  Market, 2016-2026 (Kilo Tons)
        FIG. 52 Germany Aluminum Market, 2016-2026
        FIG. 53 Germany Aluminum  Market, 2016-2026 (Kilo Tons)
        FIG. 54 France Aluminum Market, 2016-2026
        FIG. 55 France Aluminum  Market, 2016-2026 (Kilo Tons)
        FIG. 56 U.K. Aluminum Market, 2016-2026
        FIG. 57 U.K. Aluminum  Market, 2016-2026 (Kilo Tons)
        FIG. 58 Italy Aluminum Market, 2016-2026
        FIG. 59 Italy Aluminum  Market, 2016-2026 (Kilo Tons)
        FIG. 60 Spain Aluminum Market, 2016-2026
        FIG. 61 Spain Aluminum  Market, 2016-2026 (Kilo Tons)
        FIG. 62 Rest of Europe Aluminum Market, 2016-2026
        FIG. 63 Rest of Europe Aluminum  Market, 2016-2026 (Kilo Tons)
        FIG. 64 Asia Pacific Aluminum Market, 2016-2026
        FIG. 65 Asia Pacific Aluminum  Market, 2016-2026 (Kilo Tons)
        FIG. 66 China Aluminum Market, 2016-2026
        FIG. 67 China Aluminum  Market, 2016-2026 (Kilo Tons)
        FIG. 68 Japan Aluminum Market, 2016-2026
        FIG. 69 Japan Aluminum  Market, 2016-2026 (Kilo Tons)
        FIG. 70 India Aluminum Market, 2016-2026
        FIG. 71 India Aluminum  Market, 2016-2026 (Kilo Tons)
        FIG. 72 South  Korea Aluminum Market, 2016-2026
        FIG. 73 South  Korea Aluminum  Market, 2016-2026 (Kilo Tons)
        FIG. 74 South-East Asia Aluminum Market, 2016-2026
        FIG. 75 South-East Asia Aluminum  Market, 2016-2026 (Kilo Tons)
        FIG. 76 Rest of Asia Pacific Aluminum Market, 2016-2026
        FIG. 77 Rest of Asia Pacific Aluminum  Market, 2016-2026 (Kilo Tons)
        FIG. 78 Latin America Aluminum Market, 2016-2026
        FIG. 79 Latin America Aluminum  Market, 2016-2026 (Kilo Tons)
        FIG. 80 Brazil Aluminum Market, 2016-2026
        FIG. 81 Brazil Aluminum  Market, 2016-2026 (Kilo Tons)
        FIG. 82 Mexico Aluminum Market, 2016-2026
        FIG. 83 Mexico Aluminum  Market, 2016-2026 (Kilo Tons)
        FIG. 84 Rest of Latin America Aluminum Market, 2016-2026
        FIG. 85 Rest of Latin America Aluminum  Market, 2016-2026 (Kilo Tons)
        FIG. 86 The Middle-East and Africa Aluminum Market, 2016-2026
        FIG. 87 The Middle-East and Africa Aluminum  Market, 2016-2026 (Kilo Tons)
        FIG. 88 GCC Countries Aluminum Market, 2016-2026
        FIG. 89 GCC Countries Aluminum  Market, 2016-2026 (Kilo Tons)
        FIG. 90 South Africa Aluminum Market, 2016-2026
        FIG. 91 South Africa Aluminum  Market, 2016-2026 (Kilo Tons)
        FIG. 92 Rest of Middle-East Africa Aluminum Market, 2016-2026
        FIG. 93 Rest of Middle-East Africa Aluminum  Market, 2016-2026 (Kilo Tons)
        FIG. 94 Global Aluminum production and revenue, 2015-2025 (USD Million) (Kilo Tons)
        FIG. 95 North America Aluminum production and revenue, 2015-2025 (USD Million) (Kilo Tons)
        FIG. 96 Europe Aluminum production and revenue, 2015-2025 (USD Million) (Kilo Tons)
        FIG. 97 Asia Pacific Aluminum production and revenue, 2015-2025 (USD Million) (Kilo Tons)
        FIG. 98 Latin America Aluminum production and revenue, 2015-2025 (USD Million) (Kilo Tons)
        FIG. 99 Middle East and Africa Aluminum production and revenue, 2015-2025 (USD Million) (Kilo Tons)
        FIG. 100 Competitor Market Share – Revenue
        FIG. 101 Competitor Market Share – Volume
        FIG. 102 Chalco Revenue and Growth Rate
        FIG. 103 Chalco Market Share
        FIG. 104 Rusal Revenue and Growth Rate
        FIG. 105 Rusal Market Share
        FIG. 106 Rio Tinto Revenue and Growth Rate
        FIG. 107 Rio Tinto Market Share
        FIG. 108 Norsk Hydro Revenue and Growth Rate
        FIG. 109 Norsk Hydro Market Share
        FIG. 110 Hongqiao Group Revenue and Growth Rate
        FIG. 111 Hongqiao Group Market Share
        FIG. 112 Hindalco Revenue and Growth Rate
        FIG. 113 Hindalco Market Share
        FIG. 114 Novelis Revenue and Growth Rate
        FIG. 115 Novelis Market Share
        FIG. 116 Alcoa Corporation Revenue and Growth Rate
        FIG. 117 Alcoa Corporation Market Share
        FIG. 118 Others Revenue and Growth Rate
        FIG. 119 Others Market Share
        FIG. 120 Market Dynamics
        FIG. 121 Global Aluminum – Value Chain Analysis
        FIG. 122 Key Mandates and Regulations
        FIG. 123 Technology Roadmap and Timeline
        FIG. 124 Market Attractiveness Analysis – By Product
        FIG. 125 Market Attractiveness Analysis – By Processing Method
        FIG. 126 Market Attractiveness Analysis – By Application
        FIG. 127 Market Attractiveness Analysis – By Region
        FIG. 128 Manufacturing Cost Structure of Aluminum
        FIG. 129 Aluminum Industrial Chain Analysis
        FIG. 130 Market Channel
        FIG. 131 Marketing Channel Development Trend
        FIG. 132 Growth in World Gross Product, 2008-2018

        List of Tables

        TABLE 1 Global Aluminum market, 2018 & 2025 (USD Million)
        TABLE 2 Global Aluminum market, by Product, 2016-2026 (USD Million)
        TABLE 3 Global Aluminum market, by Product, 2016-2026 (Kilo Tons)
        TABLE 4 Global Aluminum market, by Processing Method, 2016-2026 (USD Million)
        TABLE 5 Global Aluminum market, by Processing Method, 2016-2026 (Kilo Tons)
        TABLE 6 Global Aluminum market, by Application, 2016-2026 (USD Million)
        TABLE 7 Global Aluminum market, by Application, 2016-2026 (Kilo Tons)
        TABLE 8 Global Aluminum market, by region, 2016-2026 (USD Million)
        TABLE 9 Global Aluminum market, by region, 2016-2026 (Kilo Tons)
        TABLE 10 North America Aluminum Market, by Product, 2016-2026 (USD Million)
        TABLE 11 North America Aluminum Market, by Product, 2016-2026 (Kilo Tons)
        TABLE 12 North America Aluminum Market, by Processing Method, 2016-2026 (USD Million)
        TABLE 13 North America Aluminum Market, by Processing Method, 2016-2026 (Kilo Tons)
        TABLE 14 North America Aluminum Market, by Application, 2016-2026 (USD Million)
        TABLE 15 North America Aluminum Market, by Application, 2016-2026 (Kilo Tons)
        TABLE 16 Europe Aluminum Market, by Product, 2016-2026 (USD Million)
        TABLE 17 Europe Aluminum Market, by Product, 2016-2026 (Kilo Tons)
        TABLE 18 Europe Aluminum Market, by Processing Method, 2016-2026 (USD Million)
        TABLE 19 Europe Aluminum Market, by Processing Method, 2016-2026 (Kilo Tons)
        TABLE 20 Europe Aluminum Market, by Application, 2016-2026 (USD Million)
        TABLE 21 Europe Aluminum Market, by Application, 2016-2026 (Kilo Tons)
        TABLE 22 Asia Pacific Aluminum Market, by Product, 2016-2026 (USD Million)
        TABLE 23 Asia Pacific Aluminum Market, by Product, 2016-2026 (Kilo Tons)
        TABLE 24 Asia Pacific Aluminum Market, by Processing Method, 2016-2026 (USD Million)
        TABLE 25 Asia Pacific Aluminum Market, by Processing Method, 2016-2026 (Kilo Tons)
        TABLE 26 Asia Pacific Aluminum Market, by Application, 2016-2026 (USD Million)
        TABLE 27 Asia Pacific Aluminum Market, by Application, 2016-2026 (Kilo Tons)
        TABLE 28 Latin America Aluminum Market, by Product, 2016-2026 (USD Million)
        TABLE 29 Latin America Aluminum Market, by Product, 2016-2026 (Kilo Tons)
        TABLE 30 Latin America Aluminum Market, by Processing Method, 2016-2026 (USD Million)
        TABLE 31 Latin America Aluminum Market, by Processing Method, 2016-2026 (Kilo Tons)
        TABLE 32 Latin America Aluminum Market, by Application, 2016-2026 (USD Million)
        TABLE 33 Latin America Aluminum Market, by Application, 2016-2026 (Kilo Tons)
        TABLE 34 The Middle-East and Africa Aluminum Market, by Product, 2016-2026 (USD Million)
        TABLE 35 The Middle-East and Africa Aluminum Market, by Product, 2016-2026 (Kilo Tons)
        TABLE 36 The Middle-East and Africa Aluminum Market, by Processing Method, 2016-2026 (USD Million)
        TABLE 37 The Middle-East and Africa Aluminum Market, by Processing Method, 2016-2026 (Kilo Tons)
        TABLE 38 The Middle-East and Africa Aluminum Market, by Application, 2016-2026 (USD Million)
        TABLE 39 The Middle-East and Africa Aluminum Market, by Application, 2016-2026 (Kilo Tons)
        TABLE 40 North America Aluminum Production, Consumption, Export, Import, 2016-2019
        TABLE 41 Europe Aluminum Production, Consumption, Export, Import, 2016-2019
        TABLE 42 Asia Pacific Aluminum Production, Consumption, Export, Import, 2016-2019
        TABLE 43 Latin America Aluminum Production, Consumption, Export, Import, 2016-2019
        TABLE 44 Middle East & Africa Aluminum Production, Consumption, Export, Import, 2016-2019
        TABLE 45 Global Aluminum Market - Company Revenue Analysis 2016-2019 (USD Million)
        TABLE 46 Global Aluminum Market - Company Revenue Share Analysis 2016-2019(%)
        TABLE 47 Global Aluminum Market - Company Volume Analysis 2016-2019 (Kilo Tons)
        TABLE 48 Global Aluminum Market - Company Volume Share Analysis 2016-2019(%)
        TABLE 49 Acquisitions and Mergers
        TABLE 50 New Product/Service Launch
        TABLE 51 Research & Development Activities
        TABLE 52 Market Drivers
        TABLE 53 Market Restraints
        TABLE 54 Market Opportunities
        TABLE 55 Production Base and Market Concentration Rate of Raw Material
        TABLE 56 Key Suppliers of Raw Materials
        TABLE 57 Raw Materials Sources of Aluminum Major Manufacturers in 2016
        TABLE 58 Major Buyers of Aluminum
        TABLE 59 Distributors/Traders of Aluminum by Region

Industry Major Market Players

  • Chalco
  •  Rusal
  •  Rio Tinto
  •  Norsk Hydro
  •  Hongqiao Group
  •  Hindalco
  •  Novelis
  •  Alcoa Corporation