Search Market Research Report

Discover Our Latest Reports
Discover Our Featured Reports
Discover Top Selling Reports

Active Pharmaceutical Ingredients Market Size, Share Global Analysis Report, 2023 – 2030

report img

Active Pharmaceutical Ingredients Market Size, Share, Growth Analysis Report By Type (Generic Active Pharmaceutical Ingredients and Innovative Active Pharmaceutical Ingredients), By Molecule (Large and Small), By Type of Manufacturer (Merchant and Capital), By Indications (Saxagliptin, Enoxaparin Sodium, Tamoxifen, Acetaminophen, Artemisinin, Ibuprofen Losartan Potassium, Naproxen, Sodium Chloride, Rufinamide, and Others), and By Region - Global and Regional Industry Insights, Overview, Comprehensive Analysis, Trends, Statistical Research, Market Intelligence, Historical Data and Forecast 2023 – 2030

Industry Insights

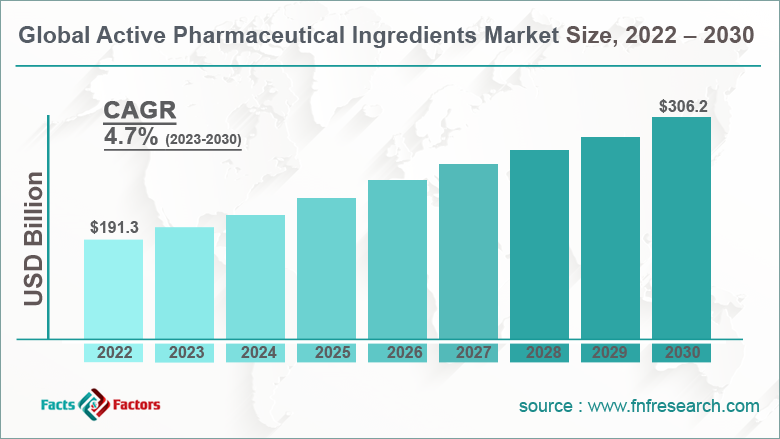
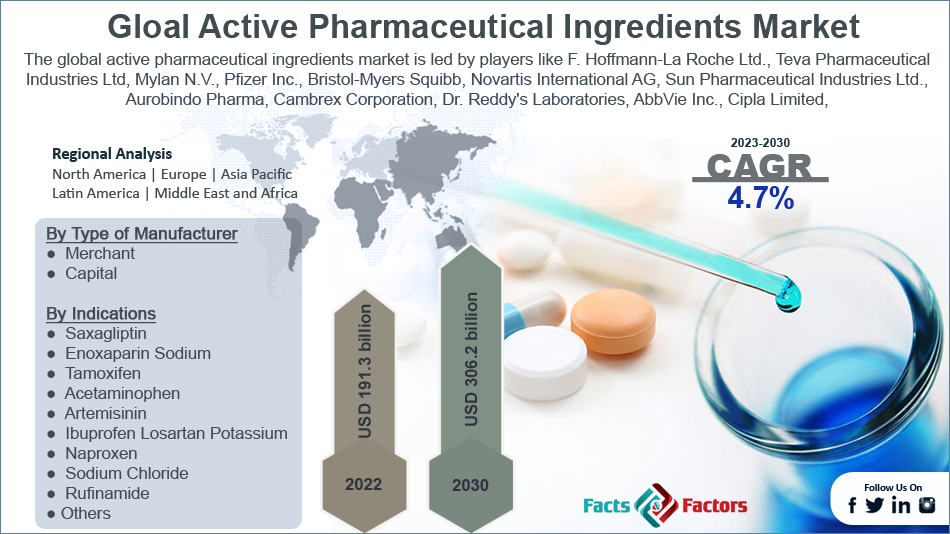
[225+ Pages Report] According to the report published by Facts Factors, the global active pharmaceutical ingredients market size was worth around USD 191.3 billion in 2022 and is predicted to grow to around USD 306.2 billion by 2030 with a compound annual growth rate (CAGR) of roughly 4.7% between 2023 and 2030. The report analyzes the global active pharmaceutical ingredients market drivers, restraints/challenges, and the effect they have on the demands during the projection period. In addition, the report explores emerging opportunities in the active pharmaceutical ingredients market.

global-active-pharmaceutical-ingredients-market-share

To know more about this report | Request Free Sample Copy

logoMarket Overview

The market, also known as the API market, refers to the activities surrounding the production and sales of chemical compounds that are used in the process of pharmaceutical drug production. The ingredients are medication components used to produce desired therapeutic results and are biologically active. The industry is one of the crucial segments of the larger pharmaceutical sector as these ingredients form integral components during the process of safe and effective drug production.

logoKey Insights

  • As per the analysis shared by our research analyst, the global active pharmaceutical ingredients market is estimated to grow annually at a CAGR of around 4.7% over the forecast period (2022-2030)
  • In terms of revenue, the global active pharmaceutical ingredients market size was valued at around USD 191.3 billion in 2022 and is projected to reach USD 306.2 billion, by 2030.
  • The market is projected to grow at a significant rate due to the growing demand for effective drugs
  • Based on the type of manufacturer segmentation, the capital was predicted to show maximum market share in the year 2022
  • Based on type segmentation, generic active pharmaceutical ingredients was the leading type in 2022
  • On the basis of region, Asia-Pacific was the leading revenue generator in 2022

global-active-pharmaceutical-ingredients-market-size

To know more about this report | Request Free Sample Copy

logo Growth Drivers

  • Growing demand for effective drugs to propel market demand

The global active pharmaceutical ingredients market is projected to grow owing to the increasing demand for effective drugs due to several factors. One of the crucial reasons is the increasing number of people suffering from a range of medical conditions. The population is prone to suffering from generic conditions like cold, fever, headache, and others while there is a growing segment that suffers from more serious medical conditions like cancer, arthritis, cardiovascular diseases, and diabetes to name a few. Furthermore, with an increasing diagnosis of people contracting mental health conditions like anxiety and depression due to several socio-economic-political factors increasing at a rapid rate.

logo Restraints

  • Cost pressure to restrict the market growth

One of the key growth restraints in the global industry is the cost pressure that is associated with the production of APIs and their distribution. The rising price of raw materials impacted by changing political tension and dynamics along with the significant cost attributed to the requirement of intense research and study to develop effective APIs and meet regulatory compliances are factors that can potentially limit the growth trajectory of the industry.

logo Opportunities

  • Growing demand for personalized medicines to provide growth opportunities

The global industry players can benefit from the rising demand for personalized medicines across the globe. Factors that are contributing to the customization of medicines include the increasing prevalence of complex diseases, advancements in molecular biology and genomics, the cost-effectiveness of personalized medicines, the increasing availability of health data, and patient empowerment.

logo Challenges

  • Concerns over intellectual property rights to challenge market growth

The market struggles with maintaining momentum in terms of innovation and competition due to the protection of intellectual rights undertaken by industry players. This can potentially limit the availability of affordable APIs in the pharmaceutical industry leading to a large segment of the population outside the consumer group.

Furthermore, growing concerns over the availability of poor-quality products due to the absence of laws for reinforcing regulatory procedures could impact the trust of the stakeholders which can create multiple challenges during the projection period.

logoSegmentation Analysis

The global active pharmaceutical ingredients market is segmented based on type, molecule, type of manufacturer, indications, and region.

Based on type, the global market segments are generic active pharmaceutical ingredients and innovative active pharmaceutical ingredients

  • Although both segments are crucial for overall market growth, the revenue size for generic APIs is more than innovative segment
  • The major factors driving the segmental growth are increasing demand for affordable healthcare and the generally low prices of generic medicines as compared to the counterparts
  • Innovative APIs are new biologics or drugs and are developed through extensive research and development programs. These APIs are protected against infringement with the help of patents causing the producer to charge higher prices
  • As per a 2019 study by the IQVIA Institute for Human Data Science, generic medicines in the US were recorded to be 94% less in cost as compared to innovative medicines

Based on the molecule, the global market divisions are large and small.

Based on the type of manufacturer, the global market segments are merchant and capital.

  • Both capital and merchant segments can lead the market depending on several factors
  • However, in 2022, the industry was dominated by the capital segment
  • In most cases, APIs are developed by capital-intensive players like Teva Pharmaceuticals, Pfizer, and other
  • Since research & development of APIs is expensive and required advanced resources, it is generally the large companies that play an extensive role in the development of new APIs
  • In 2020, Teva Pharmaceuticals generated over USD 16.5 billion in revenue

Based on indications, the global market is divided into saxagliptin, enoxaparin sodium, tamoxifen, acetaminophen, artemisinin, ibuprofen, losartan potassium, naproxen, sodium chloride, rufinamide, and others.

logoRecent Developments:

  • In October 2021, Everest Organics Limited, an India-based manufacturer of generic medicines, announced that it had started the development of API for the generic version of molnupiravir, developed by Merck & Co. The medicine is an experimental antiviral drug that is used for the treatment of mild to moderate Covid-19 infection
  • In March 2022, the Indian Union Ministry announced that the production of 35 APIs was already initiated in the country which was encouraged by the announcement of a production scheme for the region’s pharmaceutical sector. The 35 APIs are a part of 53 APIs, for which the country currently has an import dependence of 90%
  • In February 2023, the US Food and Drugs Administration (FDA) authority initiated new measures to restrict and control the illegal import of Xylazine APIs and associated finished products. The chemical is increasingly being incorporated into illicit drugs giving rise to growing public health concerns

logoReport Scope

Report Attribute

Details

Market Size in 2022

USD 191.3 Billion

Projected Market Size in 2030

USD 306.2 Billion

CAGR Growth Rate

4.7% CAGR

Base Year

2022

Forecast Years

2023-2030

Key Market Players

F. Hoffmann-La Roche Ltd., Teva Pharmaceutical Industries Ltd, Boehringer Ingelheim, Sanofi, Mylan N.V., Pfizer Inc., Bristol-Myers Squibb, Novartis International AG, Sun Pharmaceutical Industries Ltd., Aurobindo Pharma, Cambrex Corporation, Dr. Reddy's Laboratories, AbbVie Inc., Cipla Limited, BASF SE, GlaxoSmithKline plc, Merch & Co, Lonza Group, Daiichi Sankyo Company Limited, and others.

Key Segment

By Type, Molecule, Type of Manufacturer, Indications, and Region

Major Regions Covered

North America, Europe, Asia Pacific, Latin America, and the Middle East &, Africa

Purchase Options

Request customized purchase options to meet your research needs. Explore purchase options

logo Regional Analysis

  • Asia-Pacific to witness the highest growth

The global active pharmaceutical ingredients market is projected to witness the highest growth in Asia-Pacific during the projection period as it is currently the most dominant region in the industry. The growth is led by countries like China and India which are witnessing tremendous growth in the production of APIs due to several factors. The countries boast of a well-established pharmaceutical sector especially in the manufacturing wing since they are home to large-scale production sites with a client base from across the globe.

Furthermore, the regional governments have amped up their efforts to promote the industry even higher and reduce import dependence on medicines from international countries. Additionally, India and China have a large pool of skilled professionals along with supportive governmental regulations for the production of APIs. Europe and North America are also important contributors due to the growing research and product innovation activities.

logo Competitive Analysis

  • F. Hoffmann-La Roche Ltd. 
  • Teva Pharmaceutical Industries Ltd 
  • Boehringer Ingelheim 
  • Sanofi 
  • Mylan N.V. 
  • Pfizer Inc. 
  • Bristol-Myers Squibb 
  • Novartis International AG 
  • Sun Pharmaceutical Industries Ltd. 
  • Aurobindo Pharma 
  • Cambrex Corporation 
  • Dr. Reddy's Laboratories 
  • AbbVie Inc. 
  • Cipla Limited 
  • BASF SE 
  • GlaxoSmithKline plc 
  • Merch & Co 
  • Lonza Group 
  • Daiichi Sankyo Company Limited.

The global active pharmaceutical ingredients market is segmented as follows:

logoBy Type Segment Analysis

  • Generic Active Pharmaceutical Ingredients
  • Innovative Active Pharmaceutical Ingredients

logoBy Molecule Segment Analysis

  • Large
  • Small

logoBy Type of Manufacturer Segment Analysis

  • Merchant
  • Capital

logoBy Indications Segment Analysis

  • Saxagliptin
  • Enoxaparin Sodium
  • Tamoxifen
  • Acetaminophen
  • Artemisinin
  • Ibuprofen Losartan Potassium
  • Naproxen
  • Sodium Chloride
  • Rufinamide
  • Others

logoBy Regional Segment Analysis

  • North America
    • The U.S.
    • Canada
    • Mexico
  • Europe
    • France
    • The UK
    • Spain
    • Germany
    • Italy
    • Nordic Countries
      • Denmark
      • Sweden
      • Norway
    • Benelux Union
      • Belgium
      • The Netherlands
      • Luxembourg
    • Rest of Europe
  • Asia Pacific
    • China
    • Japan
    • India
    • Australia
    • South Korea
    • Southeast Asia
      • Indonesia
      • Thailand
      • Malaysia
      • Singapore
      • Rest of Southeast Asia
    • Rest of Asia Pacific
  • The Middle East & Africa
    • Saudi Arabia
    • UAE
    • Egypt
    • South Africa
    • Rest of the Middle East & Africa
  • Latin America
    • Brazil
    • Argentina
    • Rest of Latin America

Table of Content

  1. Chapter 1. Preface
    1. 1.1 Report Description and Scope
  2. 1.2 Research scope
  3. 1.3 Research methodology
    1. 1.3.1 Market Research Type
    2. 1.3.2 Market research methodology
  4. Chapter 2. Executive Summary
    1. 2.1 Global Active Pharmaceutical Ingredients Market, (2023 - 2030) (USD Billion)
  5. 2.2 Global Active Pharmaceutical Ingredients Market : snapshot
  6. Chapter 3. Global Active Pharmaceutical Ingredients Market - Industry Analysis
    1. 3.1 Active Pharmaceutical Ingredients Market: Market Dynamics
  7. 3.2 Market Drivers
    1. 3.2.1 Growing demand for effective drugs to propel market demand
    2. 3.2.2 Driver 2
  8. 3.3 Market Restraints
  9. 3.4 Market Opportunities
  10. 3.5 Market Challenges
  11. 3.6 Porter’s Five Forces Analysis
  12. 3.7 Market Attractiveness Analysis
    1. 3.7.1 Market attractiveness analysis By Type
    2. 3.7.2 Market attractiveness analysis By Molecule
    3. 3.7.3 Market attractiveness analysis By Type of Manufacturer
    4. 3.7.4 Market attractiveness analysis By Indications
  13. Chapter 4. Global Active Pharmaceutical Ingredients Market- Competitive Landscape
    1. 4.1 Company market share analysis
    2. 4.1.1 Global Active Pharmaceutical Ingredients Market: company market share, 2022
  14. 4.2 Strategic development
    1. 4.2.1 Acquisitions & mergers
    2. 4.2.2 New Product launches
    3. 4.2.3 Agreements, partnerships, cullaborations, and joint ventures
    4. 4.2.4 Research and development and Regional expansion
  15. 4.3 Price trend analysis
  16. Chapter 5. Global Active Pharmaceutical Ingredients Market - Type Analysis
    1. 5.1 Global Active Pharmaceutical Ingredients Market overview: By Type
    2. 5.1.1 Global Active Pharmaceutical Ingredients Market share, By Type, 2022 and 2030
  17. 5.2 Generic Active Pharmaceutical Ingredients
    1. 5.2.1 Global Active Pharmaceutical Ingredients Market by Generic Active Pharmaceutical Ingredients, 2023 - 2030 (USD Billion)
  18. 5.3 Innovative Active Pharmaceutical Ingredients
    1. 5.3.1 Global Active Pharmaceutical Ingredients Market by Innovative Active Pharmaceutical Ingredients, 2023 - 2030 (USD Billion)
  19. Chapter 6. Global Active Pharmaceutical Ingredients Market - Molecule Analysis
    1. 6.1 Global Active Pharmaceutical Ingredients Market overview: By Molecule
    2. 6.1.1 Global Active Pharmaceutical Ingredients Market share, By Molecule, 2022 and 2030
  20. 6.2 Large
    1. 6.2.1 Global Active Pharmaceutical Ingredients Market by Large, 2023 - 2030 (USD Billion)
  21. 6.3 Small
    1. 6.3.1 Global Active Pharmaceutical Ingredients Market by Small, 2023 - 2030 (USD Billion)
  22. Chapter 7. Global Active Pharmaceutical Ingredients Market - Type of Manufacturer Analysis
    1. 7.1 Global Active Pharmaceutical Ingredients Market overview: By Type of Manufacturer
    2. 7.1.1 Global Active Pharmaceutical Ingredients Market share, By Type of Manufacturer, 2022 and 2030
  23. 7.2 Merchant
    1. 7.2.1 Global Active Pharmaceutical Ingredients Market by Merchant, 2023 - 2030 (USD Billion)
  24. 7.3 Capital
    1. 7.3.1 Global Active Pharmaceutical Ingredients Market by Capital, 2023 - 2030 (USD Billion)
  25. Chapter 8. Global Active Pharmaceutical Ingredients Market - Indications Analysis
    1. 8.1 Global Active Pharmaceutical Ingredients Market overview: By Indications
    2. 8.1.1 Global Active Pharmaceutical Ingredients Market share, By Indications, 2022 and 2030
  26. 8.2 Saxagliptin
    1. 8.2.1 Global Active Pharmaceutical Ingredients Market by Saxagliptin, 2023 - 2030 (USD Billion)
  27. 8.3 Enoxaparin Sodium
    1. 8.3.1 Global Active Pharmaceutical Ingredients Market by Enoxaparin Sodium, 2023 - 2030 (USD Billion)
  28. 8.4 Tamoxifen
    1. 8.4.1 Global Active Pharmaceutical Ingredients Market by Tamoxifen, 2023 - 2030 (USD Billion)
  29. 8.5 Acetaminophen
    1. 8.5.1 Global Active Pharmaceutical Ingredients Market by Acetaminophen, 2023 - 2030 (USD Billion)
  30. 8.6 Artemisinin
    1. 8.6.1 Global Active Pharmaceutical Ingredients Market by Artemisinin, 2023 - 2030 (USD Billion)
  31. 8.7 Ibuprofen Losartan Potassium
    1. 8.7.1 Global Active Pharmaceutical Ingredients Market by Ibuprofen Losartan Potassium, 2023 - 2030 (USD Billion)
  32. 8.8 Naproxen
    1. 8.8.1 Global Active Pharmaceutical Ingredients Market by Naproxen, 2023 - 2030 (USD Billion)
  33. 8.9 Sodium Chloride
    1. 8.9.1 Global Active Pharmaceutical Ingredients Market by Sodium Chloride, 2023 - 2030 (USD Billion)
  34. 8.10 Rufinamide
    1. 8.10.1 Global Active Pharmaceutical Ingredients Market by Rufinamide, 2023 - 2030 (USD Billion)
  35. 8.11 Others
    1. 8.11.1 Global Active Pharmaceutical Ingredients Market by Others, 2023 - 2030 (USD Billion)
  36. Chapter 9. Active Pharmaceutical Ingredients Market - Regional Analysis
    1. 9.1 Global Active Pharmaceutical Ingredients Market Regional Overview
  37. 9.2 Global Active Pharmaceutical Ingredients Market Share, by Region, 2022 & 2030 (USD Billion)
    1. 9.3. North America
    2. 9.3.1 North America Active Pharmaceutical Ingredients Market, 2023 - 2030 (USD Billion)
      1. 9.3.1.1 North America Active Pharmaceutical Ingredients Market, by Country, 2023 - 2030 (USD Billion)
  38. 9.4 North America Active Pharmaceutical Ingredients Market, by Type, 2023 - 2030
    1. 9.4.1 North America Active Pharmaceutical Ingredients Market, by Type, 2023 - 2030 (USD Billion)
  39. 9.5 North America Active Pharmaceutical Ingredients Market, by Molecule, 2023 - 2030
    1. 9.5.1 North America Active Pharmaceutical Ingredients Market, by Molecule, 2023 - 2030 (USD Billion)
  40. 9.6 North America Active Pharmaceutical Ingredients Market, by Type of Manufacturer, 2023 - 2030
    1. 9.6.1 North America Active Pharmaceutical Ingredients Market, by Type of Manufacturer, 2023 - 2030 (USD Billion)
  41. 9.7 North America Active Pharmaceutical Ingredients Market, by Indications, 2023 - 2030
    1. 9.7.1 North America Active Pharmaceutical Ingredients Market, by Indications, 2023 - 2030 (USD Billion)
    2. 9.8. Europe
    3. 9.8.1 Europe Active Pharmaceutical Ingredients Market, 2023 - 2030 (USD Billion)
      1. 9.8.1.1 Europe Active Pharmaceutical Ingredients Market, by Country, 2023 - 2030 (USD Billion)
  42. 9.9 Europe Active Pharmaceutical Ingredients Market, by Type, 2023 - 2030
    1. 9.9.1 Europe Active Pharmaceutical Ingredients Market, by Type, 2023 - 2030 (USD Billion)
  43. 9.10 Europe Active Pharmaceutical Ingredients Market, by Molecule, 2023 - 2030
    1. 9.10.1 Europe Active Pharmaceutical Ingredients Market, by Molecule, 2023 - 2030 (USD Billion)
  44. 9.11 Europe Active Pharmaceutical Ingredients Market, by Type of Manufacturer, 2023 - 2030
    1. 9.11.1 Europe Active Pharmaceutical Ingredients Market, by Type of Manufacturer, 2023 - 2030 (USD Billion)
  45. 9.12 Europe Active Pharmaceutical Ingredients Market, by Indications, 2023 - 2030
    1. 9.12.1 Europe Active Pharmaceutical Ingredients Market, by Indications, 2023 - 2030 (USD Billion)
    2. 9.13. Asia Pacific
    3. 9.13.1 Asia Pacific Active Pharmaceutical Ingredients Market, 2023 - 2030 (USD Billion)
      1. 9.13.1.1 Asia Pacific Active Pharmaceutical Ingredients Market, by Country, 2023 - 2030 (USD Billion)
  46. 9.14 Asia Pacific Active Pharmaceutical Ingredients Market, by Type, 2023 - 2030
    1. 9.14.1 Asia Pacific Active Pharmaceutical Ingredients Market, by Type, 2023 - 2030 (USD Billion)
  47. 9.15 Asia Pacific Active Pharmaceutical Ingredients Market, by Molecule, 2023 - 2030
    1. 9.15.1 Asia Pacific Active Pharmaceutical Ingredients Market, by Molecule, 2023 - 2030 (USD Billion)
  48. 9.16 Asia Pacific Active Pharmaceutical Ingredients Market, by Type of Manufacturer, 2023 - 2030
    1. 9.16.1 Asia Pacific Active Pharmaceutical Ingredients Market, by Type of Manufacturer, 2023 - 2030 (USD Billion)
  49. 9.17 Asia Pacific Active Pharmaceutical Ingredients Market, by Indications, 2023 - 2030
    1. 9.17.1 Asia Pacific Active Pharmaceutical Ingredients Market, by Indications, 2023 - 2030 (USD Billion)
    2. 9.18. Latin America
    3. 9.18.1 Latin America Active Pharmaceutical Ingredients Market, 2023 - 2030 (USD Billion)
      1. 9.18.1.1 Latin America Active Pharmaceutical Ingredients Market, by Country, 2023 - 2030 (USD Billion)
  50. 9.19 Latin America Active Pharmaceutical Ingredients Market, by Type, 2023 - 2030
    1. 9.19.1 Latin America Active Pharmaceutical Ingredients Market, by Type, 2023 - 2030 (USD Billion)
  51. 9.20 Latin America Active Pharmaceutical Ingredients Market, by Molecule, 2023 - 2030
    1. 9.20.1 Latin America Active Pharmaceutical Ingredients Market, by Molecule, 2023 - 2030 (USD Billion)
  52. 9.21 Latin America Active Pharmaceutical Ingredients Market, by Type of Manufacturer, 2023 - 2030
    1. 9.21.1 Latin America Active Pharmaceutical Ingredients Market, by Type of Manufacturer, 2023 - 2030 (USD Billion)
  53. 9.22 Latin America Active Pharmaceutical Ingredients Market, by Indications, 2023 - 2030
    1. 9.22.1 Latin America Active Pharmaceutical Ingredients Market, by Indications, 2023 - 2030 (USD Billion)
    2. 9.23. The Middle-East and Africa
    3. 9.23.1 The Middle-East and Africa Active Pharmaceutical Ingredients Market, 2023 - 2030 (USD Billion)
      1. 9.23.1.1 The Middle-East and Africa Active Pharmaceutical Ingredients Market, by Country, 2023 - 2030 (USD Billion)
  54. 9.24 The Middle-East and Africa Active Pharmaceutical Ingredients Market, by Type, 2023 - 2030
    1. 9.24.1 The Middle-East and Africa Active Pharmaceutical Ingredients Market, by Type, 2023 - 2030 (USD Billion)
  55. 9.25 The Middle-East and Africa Active Pharmaceutical Ingredients Market, by Molecule, 2023 - 2030
    1. 9.25.1 The Middle-East and Africa Active Pharmaceutical Ingredients Market, by Molecule, 2023 - 2030 (USD Billion)
  56. 9.26 The Middle-East and Africa Active Pharmaceutical Ingredients Market, by Type of Manufacturer, 2023 - 2030
    1. 9.26.1 The Middle-East and Africa Active Pharmaceutical Ingredients Market, by Type of Manufacturer, 2023 - 2030 (USD Billion)
  57. 9.27 The Middle-East and Africa Active Pharmaceutical Ingredients Market, by Indications, 2023 - 2030
    1. 9.27.1 The Middle-East and Africa Active Pharmaceutical Ingredients Market, by Indications, 2023 - 2030 (USD Billion)
  58. Chapter 10. Company Profiles
    1. 10.1 F. Hoffmann-La Roche Ltd.
    2. 10.1.1 Overview
    3. 10.1.2 Financials
    4. 10.1.3 Product Portfolio
    5. 10.1.4 Business Strategy
    6. 10.1.5 Recent Developments
  59. 10.2 Teva Pharmaceutical Industries Ltd
    1. 10.2.1 Overview
    2. 10.2.2 Financials
    3. 10.2.3 Product Portfolio
    4. 10.2.4 Business Strategy
    5. 10.2.5 Recent Developments
  60. 10.3 Boehringer Ingelheim
    1. 10.3.1 Overview
    2. 10.3.2 Financials
    3. 10.3.3 Product Portfolio
    4. 10.3.4 Business Strategy
    5. 10.3.5 Recent Developments
  61. 10.4 Sanofi
    1. 10.4.1 Overview
    2. 10.4.2 Financials
    3. 10.4.3 Product Portfolio
    4. 10.4.4 Business Strategy
    5. 10.4.5 Recent Developments
  62. 10.5 Mylan N.V.
    1. 10.5.1 Overview
    2. 10.5.2 Financials
    3. 10.5.3 Product Portfolio
    4. 10.5.4 Business Strategy
    5. 10.5.5 Recent Developments
  63. 10.6 Pfizer Inc.
    1. 10.6.1 Overview
    2. 10.6.2 Financials
    3. 10.6.3 Product Portfolio
    4. 10.6.4 Business Strategy
    5. 10.6.5 Recent Developments
  64. 10.7 Bristol-Myers Squibb
    1. 10.7.1 Overview
    2. 10.7.2 Financials
    3. 10.7.3 Product Portfolio
    4. 10.7.4 Business Strategy
    5. 10.7.5 Recent Developments
  65. 10.8 Novartis International AG
    1. 10.8.1 Overview
    2. 10.8.2 Financials
    3. 10.8.3 Product Portfolio
    4. 10.8.4 Business Strategy
    5. 10.8.5 Recent Developments
  66. 10.9 Sun Pharmaceutical Industries Ltd.
    1. 10.9.1 Overview
    2. 10.9.2 Financials
    3. 10.9.3 Product Portfolio
    4. 10.9.4 Business Strategy
    5. 10.9.5 Recent Developments
  67. 10.10 Aurobindo Pharma
    1. 10.10.1 Overview
    2. 10.10.2 Financials
    3. 10.10.3 Product Portfolio
    4. 10.10.4 Business Strategy
    5. 10.10.5 Recent Developments
  68. 10.11 Cambrex Corporation
    1. 10.11.1 Overview
    2. 10.11.2 Financials
    3. 10.11.3 Product Portfolio
    4. 10.11.4 Business Strategy
    5. 10.11.5 Recent Developments
  69. 10.12 Dr. Reddy's Laboratories
    1. 10.12.1 Overview
    2. 10.12.2 Financials
    3. 10.12.3 Product Portfolio
    4. 10.12.4 Business Strategy
    5. 10.12.5 Recent Developments
  70. 10.13 AbbVie Inc.
    1. 10.13.1 Overview
    2. 10.13.2 Financials
    3. 10.13.3 Product Portfolio
    4. 10.13.4 Business Strategy
    5. 10.13.5 Recent Developments
  71. 10.14 Cipla Limited
    1. 10.14.1 Overview
    2. 10.14.2 Financials
    3. 10.14.3 Product Portfolio
    4. 10.14.4 Business Strategy
    5. 10.14.5 Recent Developments
  72. 10.15 BASF SE
    1. 10.15.1 Overview
    2. 10.15.2 Financials
    3. 10.15.3 Product Portfolio
    4. 10.15.4 Business Strategy
    5. 10.15.5 Recent Developments
  73. 10.16 GlaxoSmithKline plc
    1. 10.16.1 Overview
    2. 10.16.2 Financials
    3. 10.16.3 Product Portfolio
    4. 10.16.4 Business Strategy
    5. 10.16.5 Recent Developments
  74. 10.17 Merch & Co
    1. 10.17.1 Overview
    2. 10.17.2 Financials
    3. 10.17.3 Product Portfolio
    4. 10.17.4 Business Strategy
    5. 10.17.5 Recent Developments
  75. 10.18 Lonza Group
    1. 10.18.1 Overview
    2. 10.18.2 Financials
    3. 10.18.3 Product Portfolio
    4. 10.18.4 Business Strategy
    5. 10.18.5 Recent Developments
  76. 10.19 Daiichi Sankyo Company Limited.
    1. 10.19.1 Overview
    2. 10.19.2 Financials
    3. 10.19.3 Product Portfolio
    4. 10.19.4 Business Strategy
    5. 10.19.5 Recent Developments

    List of Figures

     
    1. Market research Type 
    2. Market research methodology 
    3. Global Active Pharmaceutical Ingredients Market, 2023 - 2030 (USD Billion) 
    4. Porter’s Five Forces Analysis 
    5. Global Active Pharmaceutical Ingredients Market attractiveness, By Type 
    6. Global Active Pharmaceutical Ingredients Market attractiveness, By Molecule 
    7. Global Active Pharmaceutical Ingredients Market attractiveness, By Type of Manufacturer 
    8. Global Active Pharmaceutical Ingredients Market attractiveness, By Indications 
    9. Global Active Pharmaceutical Ingredients Market share by Type, 2023 and 2030 (USD Billion) 
    10. Global Active Pharmaceutical Ingredients Market by Generic Active Pharmaceutical Ingredients, 2023 - 2030 (USD Billion) 
    11. Global Active Pharmaceutical Ingredients Market by Innovative Active Pharmaceutical Ingredients, 2023 - 2030 (USD Billion) 
    12. Global Active Pharmaceutical Ingredients Market share by Molecule, 2023 and 2030 (USD Billion) 
    13. Global Active Pharmaceutical Ingredients Market by Large, 2023 - 2030 (USD Billion) 
    14. Global Active Pharmaceutical Ingredients Market by Small, 2023 - 2030 (USD Billion) 
    15. Global Active Pharmaceutical Ingredients Market share by Type of Manufacturer, 2023 and 2030 (USD Billion) 
    16. Global Active Pharmaceutical Ingredients Market by Merchant, 2023 - 2030 (USD Billion) 
    17. Global Active Pharmaceutical Ingredients Market by Capital, 2023 - 2030 (USD Billion) 
    18. Global Active Pharmaceutical Ingredients Market share by Indications, 2023 and 2030 (USD Billion) 
    19. Global Active Pharmaceutical Ingredients Market by Saxagliptin, 2023 - 2030 (USD Billion) 
    20. Global Active Pharmaceutical Ingredients Market by Enoxaparin Sodium, 2023 - 2030 (USD Billion) 
    21. Global Active Pharmaceutical Ingredients Market by Tamoxifen, 2023 - 2030 (USD Billion) 
    22. Global Active Pharmaceutical Ingredients Market by Acetaminophen, 2023 - 2030 (USD Billion) 
    23. Global Active Pharmaceutical Ingredients Market by Artemisinin, 2023 - 2030 (USD Billion) 
    24. Global Active Pharmaceutical Ingredients Market by Ibuprofen Losartan Potassium, 2023 - 2030 (USD Billion) 
    25. Global Active Pharmaceutical Ingredients Market by Naproxen, 2023 - 2030 (USD Billion) 
    26. Global Active Pharmaceutical Ingredients Market by Sodium Chloride, 2023 - 2030 (USD Billion) 
    27. Global Active Pharmaceutical Ingredients Market by Rufinamide, 2023 - 2030 (USD Billion) 
    28. Global Active Pharmaceutical Ingredients Market by Others, 2023 - 2030 (USD Billion) 
    29. Global Active Pharmaceutical Ingredients Market share, by Region, 2023 and 2030 
    30. North America Active Pharmaceutical Ingredients Market, 2023 - 2030 (USD Billion) 
    31. Europe Active Pharmaceutical Ingredients Market, 2023 - 2030 (USD Billion) 
    32. Asia Pacific Active Pharmaceutical Ingredients Market, 2023 - 2030 (USD Billion) 
    33. Latin America Active Pharmaceutical Ingredients Market, 2023 - 2030 (USD Billion) 
    34. The Middle-East and Africa Active Pharmaceutical Ingredients Market, 2023 - 2030 (USD Billion) 
    

    List of Tables

     
    1. Global Active Pharmaceutical Ingredients Market: Snapshot 
    2. Drivers of the Active Pharmaceutical Ingredients Market: impact analysis 
    3. North America Active Pharmaceutical Ingredients Market revenue, By Type, 2023 - 2030 (USD Billion) 
    4. North America Active Pharmaceutical Ingredients Market revenue, By Molecule, 2023 - 2030 (USD Billion) 
    5. North America Active Pharmaceutical Ingredients Market revenue, By Type of Manufacturer, 2023 - 2030 (USD Billion) 
    6. North America Active Pharmaceutical Ingredients Market revenue, By Indications, 2023 - 2030 (USD Billion) 
    7. U.S. Active Pharmaceutical Ingredients Market revenue, By Type, 2023 - 2030 (USD Billion) 
    8. U.S. Active Pharmaceutical Ingredients Market revenue, By Molecule, 2023 - 2030 (USD Billion) 
    9. U.S. Active Pharmaceutical Ingredients Market revenue, By Type of Manufacturer, 2023 - 2030 (USD Billion) 
    10. U.S. Active Pharmaceutical Ingredients Market revenue, By Indications, 2023 - 2030 (USD Billion) 
    11. Canada Active Pharmaceutical Ingredients Market revenue, By Type, 2023 - 2030 (USD Billion) 
    12. Canada Active Pharmaceutical Ingredients Market revenue, By Molecule, 2023 - 2030 (USD Billion) 
    13. Canada Active Pharmaceutical Ingredients Market revenue, By Type of Manufacturer, 2023 - 2030 (USD Billion) 
    14. Canada Active Pharmaceutical Ingredients Market revenue, By Indications, 2023 - 2030 (USD Billion) 
    15. Europe Active Pharmaceutical Ingredients Market revenue, By Type, 2023 - 2030 (USD Billion) 
    16. Europe Active Pharmaceutical Ingredients Market revenue, By Molecule, 2023 - 2030 (USD Billion) 
    17. Europe Active Pharmaceutical Ingredients Market revenue, By Type of Manufacturer, 2023 - 2030 (USD Billion) 
    18. Europe Active Pharmaceutical Ingredients Market revenue, By Indications, 2023 - 2030 (USD Billion) 
    19. Germany Active Pharmaceutical Ingredients Market revenue, By Type, 2023 - 2030 (USD Billion) 
    20. Germany Active Pharmaceutical Ingredients Market revenue, By Molecule, 2023 - 2030 (USD Billion) 
    21. Germany Active Pharmaceutical Ingredients Market revenue, By Type of Manufacturer, 2023 - 2030 (USD Billion) 
    22. Germany Active Pharmaceutical Ingredients Market revenue, By Indications, 2023 - 2030 (USD Billion) 
    23. France Active Pharmaceutical Ingredients Market revenue, By Type, 2023 - 2030 (USD Billion) 
    24. France Active Pharmaceutical Ingredients Market revenue, By Molecule, 2023 - 2030 (USD Billion) 
    25. France Active Pharmaceutical Ingredients Market revenue, By Type of Manufacturer, 2023 - 2030 (USD Billion) 
    26. France Active Pharmaceutical Ingredients Market revenue, By Indications, 2023 - 2030 (USD Billion) 
    27. U.K. Active Pharmaceutical Ingredients Market revenue, By Type, 2023 - 2030 (USD Billion) 
    28. U.K. Active Pharmaceutical Ingredients Market revenue, By Molecule, 2023 - 2030 (USD Billion) 
    29. U.K. Active Pharmaceutical Ingredients Market revenue, By Type of Manufacturer, 2023 - 2030 (USD Billion) 
    30. U.K. Active Pharmaceutical Ingredients Market revenue, By Indications, 2023 - 2030 (USD Billion) 
    31. Italy Active Pharmaceutical Ingredients Market revenue, By Type, 2023 - 2030 (USD Billion) 
    32. Italy Active Pharmaceutical Ingredients Market revenue, By Molecule, 2023 - 2030 (USD Billion) 
    33. Italy Active Pharmaceutical Ingredients Market revenue, By Type of Manufacturer, 2023 - 2030 (USD Billion) 
    34. Italy Active Pharmaceutical Ingredients Market revenue, By Indications, 2023 - 2030 (USD Billion) 
    35. Spain Active Pharmaceutical Ingredients Market revenue, By Type, 2023 - 2030 (USD Billion) 
    36. Spain Active Pharmaceutical Ingredients Market revenue, By Molecule, 2023 - 2030 (USD Billion) 
    37. Spain Active Pharmaceutical Ingredients Market revenue, By Type of Manufacturer, 2023 - 2030 (USD Billion) 
    38. Spain Active Pharmaceutical Ingredients Market revenue, By Indications, 2023 - 2030 (USD Billion) 
    39. Rest of Europe Active Pharmaceutical Ingredients Market revenue, By Type, 2023 - 2030 (USD Billion) 
    40. Rest of Europe Active Pharmaceutical Ingredients Market revenue, By Molecule, 2023 - 2030 (USD Billion) 
    41. Rest of Europe Active Pharmaceutical Ingredients Market revenue, By Type of Manufacturer, 2023 - 2030 (USD Billion) 
    42. Rest of Europe Active Pharmaceutical Ingredients Market revenue, By Indications, 2023 - 2030 (USD Billion) 
    43. Asia Pacific Active Pharmaceutical Ingredients Market revenue, By Type, 2023 - 2030 (USD Billion) 
    44. Asia Pacific Active Pharmaceutical Ingredients Market revenue, By Molecule, 2023 - 2030 (USD Billion) 
    45. Asia Pacific Active Pharmaceutical Ingredients Market revenue, By Type of Manufacturer, 2023 - 2030 (USD Billion) 
    46. Asia Pacific Active Pharmaceutical Ingredients Market revenue, By Indications, 2023 - 2030 (USD Billion) 
    47. China Active Pharmaceutical Ingredients Market revenue, By Type, 2023 - 2030 (USD Billion) 
    48. China Active Pharmaceutical Ingredients Market revenue, By Molecule, 2023 - 2030 (USD Billion) 
    49. China Active Pharmaceutical Ingredients Market revenue, By Type of Manufacturer, 2023 - 2030 (USD Billion) 
    50. China Active Pharmaceutical Ingredients Market revenue, By Indications, 2023 - 2030 (USD Billion) 
    51. Japan Active Pharmaceutical Ingredients Market revenue, By Type, 2023 - 2030 (USD Billion) 
    52. Japan Active Pharmaceutical Ingredients Market revenue, By Molecule, 2023 - 2030 (USD Billion) 
    53. Japan Active Pharmaceutical Ingredients Market revenue, By Type of Manufacturer, 2023 - 2030 (USD Billion) 
    54. Japan Active Pharmaceutical Ingredients Market revenue, By Indications, 2023 - 2030 (USD Billion) 
    55. India Active Pharmaceutical Ingredients Market revenue, By Type, 2023 - 2030 (USD Billion) 
    56. India Active Pharmaceutical Ingredients Market revenue, By Molecule, 2023 - 2030 (USD Billion) 
    57. India Active Pharmaceutical Ingredients Market revenue, By Type of Manufacturer, 2023 - 2030 (USD Billion) 
    58. India Active Pharmaceutical Ingredients Market revenue, By Indications, 2023 - 2030 (USD Billion) 
    59. South Korea Active Pharmaceutical Ingredients Market revenue, By Type, 2023 - 2030 (USD Billion) 
    60. South Korea Active Pharmaceutical Ingredients Market revenue, By Molecule, 2023 - 2030 (USD Billion) 
    61. South Korea Active Pharmaceutical Ingredients Market revenue, By Type of Manufacturer, 2023 - 2030 (USD Billion) 
    62. South Korea Active Pharmaceutical Ingredients Market revenue, By Indications, 2023 - 2030 (USD Billion) 
    63. South-East Asia Active Pharmaceutical Ingredients Market revenue, By Type, 2023 - 2030 (USD Billion) 
    64. South-East Asia Active Pharmaceutical Ingredients Market revenue, By Molecule, 2023 - 2030 (USD Billion) 
    65. South-East Asia Active Pharmaceutical Ingredients Market revenue, By Type of Manufacturer, 2023 - 2030 (USD Billion) 
    66. South-East Asia Active Pharmaceutical Ingredients Market revenue, By Indications, 2023 - 2030 (USD Billion) 
    67. Rest of Asia Pacific Active Pharmaceutical Ingredients Market revenue, By Type, 2023 - 2030 (USD Billion) 
    68. Rest of Asia Pacific Active Pharmaceutical Ingredients Market revenue, By Molecule, 2023 - 2030 (USD Billion) 
    69. Rest of Asia Pacific Active Pharmaceutical Ingredients Market revenue, By Type of Manufacturer, 2023 - 2030 (USD Billion) 
    70. Rest of Asia Pacific Active Pharmaceutical Ingredients Market revenue, By Indications, 2023 - 2030 (USD Billion) 
    71. Latin America Active Pharmaceutical Ingredients Market revenue, By Type, 2023 - 2030 (USD Billion) 
    72. Latin America Active Pharmaceutical Ingredients Market revenue, By Molecule, 2023 - 2030 (USD Billion) 
    73. Latin America Active Pharmaceutical Ingredients Market revenue, By Type of Manufacturer, 2023 - 2030 (USD Billion) 
    74. Latin America Active Pharmaceutical Ingredients Market revenue, By Indications, 2023 - 2030 (USD Billion) 
    75. Brazil Active Pharmaceutical Ingredients Market revenue, By Type, 2023 - 2030 (USD Billion) 
    76. Brazil Active Pharmaceutical Ingredients Market revenue, By Molecule, 2023 - 2030 (USD Billion) 
    77. Brazil Active Pharmaceutical Ingredients Market revenue, By Type of Manufacturer, 2023 - 2030 (USD Billion) 
    78. Brazil Active Pharmaceutical Ingredients Market revenue, By Indications, 2023 - 2030 (USD Billion) 
    79. Mexico Active Pharmaceutical Ingredients Market revenue, By Type, 2023 - 2030 (USD Billion) 
    80. Mexico Active Pharmaceutical Ingredients Market revenue, By Molecule, 2023 - 2030 (USD Billion) 
    81. Mexico Active Pharmaceutical Ingredients Market revenue, By Type of Manufacturer, 2023 - 2030 (USD Billion) 
    82. Mexico Active Pharmaceutical Ingredients Market revenue, By Indications, 2023 - 2030 (USD Billion) 
    83. Rest of Latin America Active Pharmaceutical Ingredients Market revenue, By Type, 2023 - 2030 (USD Billion) 
    84. Rest of Latin America Active Pharmaceutical Ingredients Market revenue, By Molecule, 2023 - 2030 (USD Billion) 
    85. Rest of Latin America Active Pharmaceutical Ingredients Market revenue, By Type of Manufacturer, 2023 - 2030 (USD Billion) 
    86. Rest of Latin America Active Pharmaceutical Ingredients Market revenue, By Indications, 2023 - 2030 (USD Billion) 
    87. The Middle-East and Africa Active Pharmaceutical Ingredients Market revenue, By Type, 2023 - 2030 (USD Billion) 
    88. The Middle-East and Africa Active Pharmaceutical Ingredients Market revenue, By Molecule, 2023 - 2030 (USD Billion) 
    89. The Middle-East and Africa Active Pharmaceutical Ingredients Market revenue, By Type of Manufacturer, 2023 - 2030 (USD Billion) 
    90. The Middle-East and Africa Active Pharmaceutical Ingredients Market revenue, By Indications, 2023 - 2030 (USD Billion) 
    91. GCC Countries Active Pharmaceutical Ingredients Market revenue, By Type, 2023 - 2030 (USD Billion) 
    92. GCC Countries Active Pharmaceutical Ingredients Market revenue, By Molecule, 2023 - 2030 (USD Billion) 
    93. GCC Countries Active Pharmaceutical Ingredients Market revenue, By Type of Manufacturer, 2023 - 2030 (USD Billion) 
    94. GCC Countries Active Pharmaceutical Ingredients Market revenue, By Indications, 2023 - 2030 (USD Billion) 
    95. South Africa Active Pharmaceutical Ingredients Market revenue, By Type, 2023 - 2030 (USD Billion) 
    96. South Africa Active Pharmaceutical Ingredients Market revenue, By Molecule, 2023 - 2030 (USD Billion) 
    97. South Africa Active Pharmaceutical Ingredients Market revenue, By Type of Manufacturer, 2023 - 2030 (USD Billion) 
    98. South Africa Active Pharmaceutical Ingredients Market revenue, By Indications, 2023 - 2030 (USD Billion) 
    99. Rest of Middle-East Africa Active Pharmaceutical Ingredients Market revenue, By Type, 2023 - 2030 (USD Billion) 
    100. Rest of Middle-East Africa Active Pharmaceutical Ingredients Market revenue, By Molecule, 2023 - 2030 (USD Billion) 
    101. Rest of Middle-East Africa Active Pharmaceutical Ingredients Market revenue, By Type of Manufacturer, 2023 - 2030 (USD Billion) 
    102. Rest of Middle-East Africa Active Pharmaceutical Ingredients Market revenue, By Indications, 2023 - 2030 (USD Billion) 
    

Industry Major Market Players

  • F. Hoffmann-La Roche Ltd. 
  • Teva Pharmaceutical Industries Ltd 
  • Boehringer Ingelheim 
  • Sanofi 
  • Mylan N.V. 
  • Pfizer Inc. 
  • Bristol-Myers Squibb 
  • Novartis International AG 
  • Sun Pharmaceutical Industries Ltd. 
  • Aurobindo Pharma 
  • Cambrex Corporation 
  • Dr. Reddy's Laboratories 
  • AbbVie Inc. 
  • Cipla Limited 
  • BASF SE 
  • GlaxoSmithKline plc 
  • Merch & Co 
  • Lonza Group 
  • Daiichi Sankyo Company Limited.