Search Market Research Report

Discover Our Latest Reports
Discover Our Featured Reports
Discover Top Selling Reports

Volumetric Display Market Size, Share Global Analysis Report, 2021 – 2026

report img

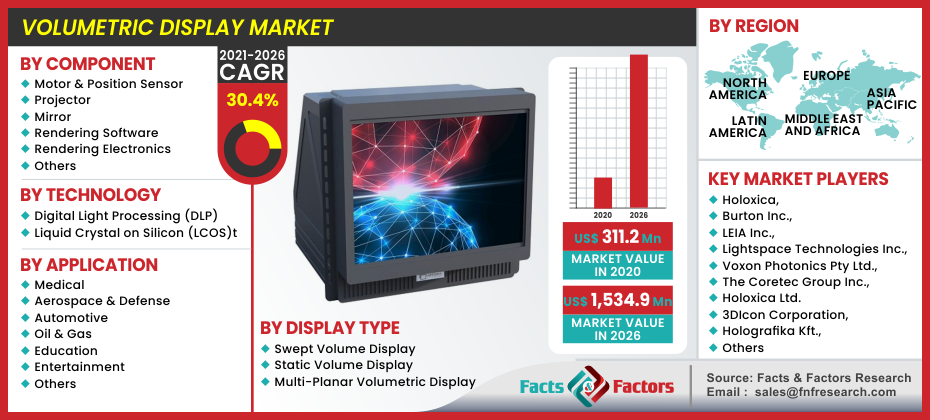
Volumetric Display Market by Component (Motor & Position Sensor, Projector, Mirror, Rendering Software and Rendering Electronics) By Technology (Digital Light Processing (DLP) and Liquid Crystal on Silicon (LCOS)), By Display Type (Swept, Static and Multi-Planar), By Application (Medical, Aerospace & Defense, Automotive, Oil & Gas, Education and Entertainment) By Region: Global & Regional Industry Perspective, Comprehensive Analysis, and Forecast 2021 – 2026

Industry Insights

[197+ Pages Report] According to Facts and Factors, the global volumetric display market was valued at about USD 311.2 million in 2020, and is predicted to create revenue of about USD 1,534.9 million by the end of 2026, with a CAGR of about 30.4% between 2021 and 2026.

logoMarket Overview   

Despite the fact that this technology is still in its infancy, scientists believe it has enormous potential and offers significant benefits. Volumetric displays, for example, do not put much strain on the eyes because we perceive this immersive display as a real-world 3D object. This is an improvement over VR displays. Furthermore, unlike AR-VR, it does not necessitate the use of a headset. Furthermore, these volumetric displays can be used with any 3D input device, such as Kinect, Leap Motion, or Structure. In terms of applications, the volumetric display can be used for 3D Human Size communications, similar to how humans appear in projected forms in sci-fi movies for a top-secret mission. This display can be used for a variety of purposes in the medical and healthcare industries, including surgical planning, post-op review, training, doctor-patient communication, and diagnosis. Finally, it promises to usher in a major revolution in the field of gaming. The major players in this market at the moment are Alioscopy, Holoxica Ltd., Leia Inc., Seekway. SeeReal Technologies, Soscho, Coretec, Zebra Imaging,  3DIcon Corporation, Voxon , Burton, Zebra Imaging, Holografika Kft., and LightSpace Technologies Inc.

Volumetric Display Market

To know more about this report | Request Free Sample Copy

logoIndustry Growth Factors

In recent years, gamers all over the world have expressed a strong desire for a better gaming experience. Without any device on the gamer's body, volumetric displays provide a 360° view of 3D gaming. Furthermore, key market players such as Voxon Photonics are aggressively focusing on introducing innovative 3D displays for gaming purposes in a variety of countries. As a result, rising consumer demand and massive investments in manufacturing by key market players are expected to drive market growth. The volumetric display is a complex combination of components such as a motor, projector, sensors, and laser systems. This, combined with high costs, is expected to stymie market growth over the forecast period. Volumetric displays rely on rotating parts or scanning mechanisms, which limits manufacturers' ability to produce large-screen units. The high costs incurred during the manufacturing process raise the overall cost of the product.

logoSegmentation Analysis

Component, technology, display type, application, and region are the segments of the global volumetric display market.

Motor & position sensor, projector, mirror, rendering software, and rendering electronics make up product segment of the global volumetric display industry.  The global volumetric display market can be divided into Digital Light Processing (DLP) and Liquid Crystal on Silicon (LCOS). Based on display type, the global volumetric display industry is categorized into swept, static and multi-planar. Over the forecast period, the swept volume segment is expected to grow at a CAGR of 30.4 percent. The significant focus on developing advanced swept volume displays by prominent market players globally is attributed to the growth. For example, Voxon Photonics introduced ‘Z3D' in June 2019, the world's first 3D Arcade Machine based on swept volume technology, which provides an enhanced gaming experience with an ultra-high digital projection device. The technology also aids in the support of multi-user interaction in gaming and a variety of other applications such as video calling. Medical, aerospace & defense, automotive, oil & gas, education, and entertainment are the end-user segment of the global volumetric display market.

logoReport Scope

Report Attribute

Details

Market Size in 2020

USD 311.2 Million

Projected Market Size in 2026

USD 1534.9 Million

CAGR Growth Rate

30.4% CAGR

Base Year

2020

Forecast Years

2021-2026

Key Market Players

Holoxica, Burton Inc., LEIA Inc., Lightspace Technologies Inc., Voxon Photonics Pty Ltd., The Coretec Group Inc., Holoxica Ltd.3DIcon Corporation, Holografika Kft., Zebra Imaging, Seekway Technologies, Alioscopy, Soscho GmbH, SeeReal Technologies S.A., and Others

Key Segment

By Component, Technology, Display Type, Application, and Region

Major Regions Covered

North America, Europe, Asia Pacific, Latin America, and the Middle East &, Africa

Purchase Options

Request customized purchase options to meet your research needs. Explore purchase options

logo Regional Analysis

The volumetric display market is divided into five regions: North America, the Middle East, and Africa, Asia Pacific, Europe, and Latin America. The volumetric displays market in North America is expected to be the largest during the forecast period, dominating the global volumetric display market. Various factors, such as technological advancements and technological innovations in 3D displays, are driving the market in North America. During the forecast period, the Asia Pacific volumetric displays market is expected to be one of the most appealing. The volumetric display market in this region is primarily driven by technological advancements in the region and rising demand for 3D displays in a variety of end-user applications.

logo Competitive Players

Some main participants of the global volumetric display market are

  • Holoxica
  • Burton Inc.
  • LEIA Inc.
  • Lightspace Technologies Inc.
  • Voxon Photonics Pty Ltd.
  • The Coretec Group Inc.
  • Holoxica Ltd.
  • 3DIcon Corporation
  • Holografika Kft.
  • Zebra Imaging
  • Seekway Technologies
  • Alioscopy
  • Soscho GmbH
  • SeeReal Technologies S.A.

The global volumetric display market is segmented as follows:

logoBy Component

  • Motor & Position Sensor
  • Projector
  • Mirror
  • Rendering Software
  • Rendering Electronics
  • Others

logoBy Technology

  • Digital Light Processing (DLP)
  • Liquid Crystal on Silicon (LCOS)

logoBy Display Type

  • Swept Volume Display
  • Static Volume Display
  • Multi-Planar Volumetric Display

logoBy Application

  • Medical
  • Aerospace & Defense
  • Automotive
  • Oil & Gas
  • Education
  • Entertainment
  • Others

logoBy Region

  • North America
    • U.S.
    • Canada
  • Europe
    • UK
    • France
    • Germany
    • Italy
    • Spain
    • Rest of Europe
  • Asia Pacific
    • China
    • Japan
    • India
    • South Korea
    • Southeast Asia
    • Rest of Asia Pacific
  • Latin America
    • Brazil
    • Mexico
    • Rest of Latin America
  • Middle East and Africa
    • GCC Countries
    • South Africa
    • Rest of MEA

Table of Content

  1. Chapter 1 Executive Summary
    1. 1.1. Introduction of Volumetric Display
    2. 1.2. Global Volumetric Display Market, 2020 & 2026 (USD Million)
    3. 1.3. Global Volumetric Display Market, 2016 – 2026 (USD Million)
    4. 1.4. Global Volumetric Display Market Absolute Revenue Opportunity, 2016 – 2026 (USD Million)
    5. 1.5. Global Volumetric Display Market Incremental Revenue Opportunity, 2020 – 2026 (USD Million)
    6. 1.6. COVID-19 Impacts on Volumetric Display Market
      1. 1.6.1. COVID-19 Impact on the Players
      2. 1.6.2. Business Strategies and Recommendations
  2. Chapter 2 Volumetric Display Market – Component Analysis
    1. 2.1. Global Volumetric Display Market – Component Overview
    2. 2.2. Global Volumetric Display Market Share, by Component, 2020 & 2026 (USD Million)
    3. 2.3. Motor & Position Sensor
      1. 2.3.1. Global Motor & Position Sensor Volumetric Display Market, 2016 – 2026 (USD Million)
    4. 2.4. Projector
      1. 2.4.1. Global Projector Volumetric Display Market, 2016 – 2026 (USD Million)
    5. 2.5. Mirror
      1. 2.5.1. Global Mirror Volumetric Display Market, 2016 – 2026 (USD Million)
    6. 2.6. Rendering Software
      1. 2.6.1. Global Rendering Software Volumetric Display Market, 2016 – 2026 (USD Million)
    7. 2.7. Rendering Electronics
      1. 2.7.1. Global Rendering Electronics Volumetric Display Market, 2016 – 2026 (USD Million)
    8. 2.8. Others
      1. 2.8.1. Global Others Volumetric Display Market, 2016 – 2026 (USD Million)
  3. Chapter 3 Volumetric Display Market – Technology Analysis
    1. 3.1. Global Volumetric Display Market – Technology Overview
    2. 3.2. Global Volumetric Display Market Share, by Technology, 2020 & 2026 (USD Million)
    3. 3.3. Digital Light Processing (DLP)
      1. 3.3.1. Global Digital Light Processing (DLP) Volumetric Display Market, 2016 – 2026 (USD Million)
    4. 3.4. Liquid Crystal on Silicon (LCOS)
      1. 3.4.1. Global Liquid Crystal on Silicon (LCOS) Volumetric Display Market, 2016 – 2026 (USD Million)
  4. Chapter 4 Volumetric Display Market – Display Type Analysis
    1. 4.1. Global Volumetric Display Market – Display Type Overview
    2. 4.2. Global Volumetric Display Market Share, by Display Type, 2020 & 2026 (USD Million)
    3. 4.3. Swept
      1. 4.3.1. Global Swept Volumetric Display Market, 2016 – 2026 (USD Million)
    4. 4.4. Static
      1. 4.4.1. Global Static Volumetric Display Market, 2016 – 2026 (USD Million)
    5. 4.5. Multi-Planar
      1. 4.5.1. Global Multi-Planar Volumetric Display Market, 2016 – 2026 (USD Million)
  5. Chapter 5 Volumetric Display Market – Application Analysis
    1. 5.1. Global Volumetric Display Market – Application Overview
    2. 5.2. Global Volumetric Display Market Share, by Application, 2020 & 2026 (USD Million)
    3. 5.3. Medical
      1. 5.3.1. Global Medical Volumetric Display Market, 2016 – 2026 (USD Million)
    4. 5.4. Aerospace & Defense
      1. 5.4.1. Global Aerospace & Defense Volumetric Display Market, 2016 – 2026 (USD Million)
    5. 5.5. Automotive
      1. 5.5.1. Global Automotive Volumetric Display Market, 2016 – 2026 (USD Million)
    6. 5.6. Oil & Gas
      1. 5.6.1. Global Oil & Gas Volumetric Display Market, 2016 – 2026 (USD Million)
    7. 5.7. Education
      1. 5.7.1. Global Education Volumetric Display Market, 2016 – 2026 (USD Million)
    8. 5.8. Entertainment
      1. 5.8.1. Global Entertainment Volumetric Display Market, 2016 – 2026 (USD Million)
    9. 5.9. Others
      1. 5.9.1. Global Others Volumetric Display Market, 2016 – 2026 (USD Million)
  6. Chapter 6 Volumetric Display Market – Regional Analysis
    1. 6.1. Global Volumetric Display Market Regional Overview
    2. 6.2. Global Volumetric Display Market Share, by Region, 2020 & 2026 (USD Million)
    3. 6.3. North America
      1. 6.3.1. North America Volumetric Display Market, 2016 – 2026 (USD Million)
        1. 6.3.1.1. North America Volumetric Display Market, by Country, 2016 - 2026 (USD Million)
      2. 6.3.2. North America Volumetric Display Market, by Component, 2016 – 2026
        1. 6.3.2.1. North America Volumetric Display Market, by Component, 2016 – 2026 (USD Million)
      3. 6.3.3. North America Volumetric Display Market, by Technology, 2016 – 2026
        1. 6.3.3.1. North America Volumetric Display Market, by Technology, 2016 – 2026 (USD Million)
      4. 6.3.4. North America Volumetric Display Market, by Display Type, 2016 – 2026
        1. 6.3.4.1. North America Volumetric Display Market, by Display Type, 2016 – 2026 (USD Million)
      5. 6.3.5. North America Volumetric Display Market, by Application, 2016 – 2026
        1. 6.3.5.1. North America Volumetric Display Market, by Application, 2016 – 2026 (USD Million)
      6. 6.3.6. U.S.
        1. 6.3.6.1. U.S. Volumetric Display Market, 2016 – 2026 (USD Million)
      7. 6.3.7. Canada
        1. 6.3.7.1. Canada Volumetric Display Market, 2016 – 2026 (USD Million)
    4. 6.4. Europe
      1. 6.4.1. Europe Volumetric Display Market, 2016 – 2026 (USD Million)
        1. 6.4.1.1. Europe Volumetric Display Market, by Country, 2016 - 2026 (USD Million)
      2. 6.4.2. Europe Volumetric Display Market, by Component, 2016 – 2026
        1. 6.4.2.1. Europe Volumetric Display Market, by Component, 2016 – 2026 (USD Million)
      3. 6.4.3. Europe Volumetric Display Market, by Technology, 2016 – 2026
        1. 6.4.3.1. Europe Volumetric Display Market, by Technology, 2016 – 2026 (USD Million)
      4. 6.4.4. Europe Volumetric Display Market, by Display Type, 2016 – 2026
        1. 6.4.4.1. Europe Volumetric Display Market, by Display Type, 2016 – 2026 (USD Million)
      5. 6.4.5. Europe Volumetric Display Market, by Application, 2016 – 2026
        1. 6.4.5.1. Europe Volumetric Display Market, by Application, 2016 – 2026 (USD Million)
      6. 6.4.6. Germany
        1. 6.4.6.1. Germany Volumetric Display Market, 2016 – 2026 (USD Million)
      7. 6.4.7. France
        1. 6.4.7.1. France Volumetric Display Market, 2016 – 2026 (USD Million)
      8. 6.4.8. U.K.
        1. 6.4.8.1. U.K. Volumetric Display Market, 2016 – 2026 (USD Million)
      9. 6.4.9. Italy
        1. 6.4.9.1. Italy Volumetric Display Market, 2016 – 2026 (USD Million)
      10. 6.4.10. Spain
        1. 6.4.10.1. Spain Volumetric Display Market, 2016 – 2026 (USD Million)
      11. 6.4.11. Rest of Europe
        1. 6.4.11.1. Rest of Europe Volumetric Display Market, 2016 – 2026 (USD Million)
    5. 6.5. Asia Pacific
      1. 6.5.1. Asia Pacific Volumetric Display Market, 2016 – 2026 (USD Million)
        1. 6.5.1.1. Asia Pacific Volumetric Display Market, by Country, 2016 - 2026 (USD Million)
      2. 6.5.2. Asia Pacific Volumetric Display Market, by Component, 2016 – 2026
        1. 6.5.2.1. Asia Pacific Volumetric Display Market, by Component, 2016 – 2026 (USD Million)
      3. 6.5.3. Asia Pacific Volumetric Display Market, by Technology, 2016 – 2026
        1. 6.5.3.1. Asia Pacific Volumetric Display Market, by Technology, 2016 – 2026 (USD Million)
      4. 6.5.4. Asia Pacific Volumetric Display Market, by Display Type, 2016 – 2026
        1. 6.5.4.1. Asia Pacific Volumetric Display Market, by Display Type, 2016 – 2026 (USD Million)
      5. 6.5.5. Asia Pacific Volumetric Display Market, by Application, 2016 – 2026
        1. 6.5.5.1. Asia Pacific Volumetric Display Market, by Application, 2016 – 2026 (USD Million)
      6. 6.5.6. China
        1. 6.5.6.1. China Volumetric Display Market, 2016 – 2026 (USD Million)
      7. 6.5.7. Japan
        1. 6.5.7.1. Japan Volumetric Display Market, 2016 – 2026 (USD Million)
      8. 6.5.8. India
        1. 6.5.8.1. India Volumetric Display Market, 2016 – 2026 (USD Million)
      9. 6.5.9. South Korea
        1. 6.5.9.1. South Korea Volumetric Display Market, 2016 – 2026 (USD Million)
      10. 6.5.10. South-East Asia
        1. 6.5.10.1. South-East Asia Volumetric Display Market, 2016 – 2026 (USD Million)
      11. 6.5.11. Rest of Asia Pacific
        1. 6.5.11.1. Rest of Asia Pacific Volumetric Display Market, 2016 – 2026 (USD Million)
    6. 6.6. Latin America
      1. 6.6.1. Latin America Volumetric Display Market, 2016 – 2026 (USD Million)
        1. 6.6.1.1. Latin America Volumetric Display Market, by Country, 2016 - 2026 (USD Million)
      2. 6.6.2. Latin America Volumetric Display Market, by Component, 2016 – 2026
        1. 6.6.2.1. Latin America Volumetric Display Market, by Component, 2016 – 2026 (USD Million)
      3. 6.6.3. Latin America Volumetric Display Market, by Technology, 2016 – 2026
        1. 6.6.3.1. Latin America Volumetric Display Market, by Technology, 2016 – 2026 (USD Million)
      4. 6.6.4. Latin America Volumetric Display Market, by Display Type, 2016 – 2026
        1. 6.6.4.1. Latin America Volumetric Display Market, by Display Type, 2016 – 2026 (USD Million)
      5. 6.6.5. Latin America Volumetric Display Market, by Application, 2016 – 2026
        1. 6.6.5.1. Latin America Volumetric Display Market, by Application, 2016 – 2026 (USD Million)
      6. 6.6.6. Brazil
        1. 6.6.6.1. Brazil Volumetric Display Market, 2016 – 2026 (USD Million)
      7. 6.6.7. Mexico
        1. 6.6.7.1. Mexico Volumetric Display Market, 2016 – 2026 (USD Million)
      8. 6.6.8. Rest of Latin America
        1. 6.6.8.1. Rest of Latin America Volumetric Display Market, 2016 – 2026 (USD Million)
    7. 6.7. Middle-East and Africa
      1. 6.7.1. Middle-East and Africa Volumetric Display Market, 2016 – 2026 (USD Million)
        1. 6.7.1.1. Middle-East and Africa Volumetric Display Market, by Country, 2016 - 2026 (USD Million)
      2. 6.7.2. Middle-East and Africa Volumetric Display Market, by Component, 2016 – 2026
        1. 6.7.2.1. Middle-East and Africa Volumetric Display Market, by Component, 2016 – 2026 (USD Million)
      3. 6.7.3. Middle-East and Africa Volumetric Display Market, by Technology, 2016 – 2026
        1. 6.7.3.1. Middle-East and Africa Volumetric Display Market, by Technology, 2016 – 2026 (USD Million)
      4. 6.7.4. Middle-East and Africa Volumetric Display Market, by Display Type, 2016 – 2026
        1. 6.7.4.1. Middle-East and Africa Volumetric Display Market, by Display Type, 2016 – 2026 (USD Million)
      5. 6.7.5. Middle-East and Africa Volumetric Display Market, by Application, 2016 – 2026
        1. 6.7.5.1. Middle-East and Africa Volumetric Display Market, by Application, 2016 – 2026 (USD Million)
      6. 6.7.6. GCC Countries
        1. 6.7.6.1. GCC Countries Volumetric Display Market, 2016 – 2026 (USD Million)
      7. 6.7.7. South Africa
        1. 6.7.7.1. South Africa Volumetric Display Market, 2016 – 2026 (USD Million)
      8. 6.7.8. Rest of Middle-East Africa
        1. 6.7.8.1. Rest of Middle-East Africa Volumetric Display Market, 2016 – 2026 (USD Million)
  7. Chapter 7 Volumetric Display Market – Competitive Landscape
    1. 7.1. Competitor Market Share – Revenue
    2. 7.2. Market Concentration Rate Analysis, Top 3 and Top 5 Players
    3. 7.3. Strategic Developments
      1. 7.3.1. Acquisitions and Mergers
      2. 7.3.2. New Products
      3. 7.3.3. Research & Development Activities
  8. Chapter 8 Company Profiles
    1. 8.1. Holoxica Ltd.
      1. 8.1.1. Company Overview
      2. 8.1.2. Product/Service Portfolio
      3. 8.1.3. Holoxica Ltd. Sales, Revenue, and Gross Margin
      4. 8.1.4. Holoxica Ltd. Revenue and Growth Rate
      5. 8.1.5. Holoxica Ltd. Market Share
      6. 8.1.6. Recent Initiatives, Funding/VC Activities, and Technological Innovations
    2. 8.2. 3DIcon Corporation
      1. 8.2.1. Company Overview
      2. 8.2.2. Product/Service Portfolio
      3. 8.2.3. 3DIcon Corporation Sales, Revenue, and Gross Margin
      4. 8.2.4. 3DIcon Corporation Revenue and Growth Rate
      5. 8.2.5. 3DIcon Corporation Market Share
      6. 8.2.6. Recent Initiatives, Funding/VC Activities, and Technological Innovations
    3. 8.3. Holoxica
      1. 8.3.1. Company Overview
      2. 8.3.2. Product/Service Portfolio
      3. 8.3.3. Holoxica Sales, Revenue, and Gross Margin
      4. 8.3.4. Holoxica Revenue and Growth Rate
      5. 8.3.5. Holoxica Market Share
      6. 8.3.6. Recent Initiatives, Funding/VC Activities, and Technological Innovations
    4. 8.4. Burton Inc.
      1. 8.4.1. Company Overview
      2. 8.4.2. Product/Service Portfolio
      3. 8.4.3. Burton Inc. Sales, Revenue, and Gross Margin
      4. 8.4.4. Burton Inc. Revenue and Growth Rate
      5. 8.4.5. Burton Inc. Market Share
      6. 8.4.6. Recent Initiatives, Funding/VC Activities, and Technological Innovations
    5. 8.5. SeeReal Technologies S.A
      1. 8.5.1. Company Overview
      2. 8.5.2. Product/Service Portfolio
      3. 8.5.3. SeeReal Technologies S.A Sales, Revenue, and Gross Margin
      4. 8.5.4. SeeReal Technologies S.A Revenue and Growth Rate
      5. 8.5.5. SeeReal Technologies S.A Market Share
      6. 8.5.6. Recent Initiatives, Funding/VC Activities, and Technological Innovations
    6. 8.6. LEIA Inc.
      1. 8.6.1. Company Overview
      2. 8.6.2. Product/Service Portfolio
      3. 8.6.3. LEIA Inc. Sales, Revenue, and Gross Margin
      4. 8.6.4. LEIA Inc. Revenue and Growth Rate
      5. 8.6.5. LEIA Inc. Market Share
      6. 8.6.6. Recent Initiatives, Funding/VC Activities, and Technological Innovations
    7. 8.7. Lightspace Technologies Inc.
      1. 8.7.1. Company Overview
      2. 8.7.2. Product/Service Portfolio
      3. 8.7.3. Lightspace Technologies Inc. Sales, Revenue, and Gross Margin
      4. 8.7.4. Lightspace Technologies Inc. Revenue and Growth Rate
      5. 8.7.5. Lightspace Technologies Inc. Market Share
      6. 8.7.6. Recent Initiatives, Funding/VC Activities, and Technological Innovations
    8. 8.8. Holografika Kft.
      1. 8.8.1. Company Overview
      2. 8.8.2. Product/Service Portfolio
      3. 8.8.3. Holografika Kft. Sales, Revenue, and Gross Margin
      4. 8.8.4. Holografika Kft. Revenue and Growth Rate
      5. 8.8.5. Holografika Kft. Market Share
      6. 8.8.6. Recent Initiatives, Funding/VC Activities, and Technological Innovations
    9. 8.9. Zebra Imaging
      1. 8.9.1. Company Overview
      2. 8.9.2. Product/Service Portfolio
      3. 8.9.3. Zebra Imaging Sales, Revenue, and Gross Margin
      4. 8.9.4. Zebra Imaging Revenue and Growth Rate
      5. 8.9.5. Zebra Imaging Market Share
      6. 8.9.6. Recent Initiatives, Funding/VC Activities, and Technological Innovations
    10. 8.10. Seekway Technologies
      1. 8.10.1. Company Overview
      2. 8.10.2. Product/Service Portfolio
      3. 8.10.3. Seekway Technologies Sales, Revenue, and Gross Margin
      4. 8.10.4. Seekway Technologies Revenue and Growth Rate
      5. 8.10.5. Seekway Technologies Market Share
      6. 8.10.6. Recent Initiatives, Funding/VC Activities, and Technological Innovations
    11. 8.11. Alioscopy
      1. 8.11.1. Company Overview
      2. 8.11.2. Product/Service Portfolio
      3. 8.11.3. Alioscopy Sales, Revenue, and Gross Margin
      4. 8.11.4. Alioscopy Revenue and Growth Rate
      5. 8.11.5. Alioscopy Market Share
      6. 8.11.6. Recent Initiatives, Funding/VC Activities, and Technological Innovations
    12. 8.12. Soscho GmbH
      1. 8.12.1. Company Overview
      2. 8.12.2. Product/Service Portfolio
      3. 8.12.3. Soscho GmbH Sales, Revenue, and Gross Margin
      4. 8.12.4. Soscho GmbH Revenue and Growth Rate
      5. 8.12.5. Soscho GmbH Market Share
      6. 8.12.6. Recent Initiatives, Funding/VC Activities, and Technological Innovations
    13. 8.13. The Coretec Group Inc
      1. 8.13.1. Company Overview
      2. 8.13.2. Product/Service Portfolio
      3. 8.13.3. The Coretec Group Inc Sales, Revenue, and Gross Margin
      4. 8.13.4. The Coretec Group Inc Revenue and Growth Rate
      5. 8.13.5. The Coretec Group Inc Market Share
      6. 8.13.6. Recent Initiatives, Funding/VC Activities, and Technological Innovations
    14. 8.14. Voxon Photonics Pty Ltd.
      1. 8.14.1. Company Overview
      2. 8.14.2. Product/Service Portfolio
      3. 8.14.3. Voxon Photonics Pty Ltd. Sales, Revenue, and Gross Margin
      4. 8.14.4. Voxon Photonics Pty Ltd. Revenue and Growth Rate
      5. 8.14.5. Voxon Photonics Pty Ltd. Market Share
      6. 8.14.6. Recent Initiatives, Funding/VC Activities, and Technological Innovations
  9. Chapter 9 Volumetric Display — Industry Analysis
    1. 9.1. Introduction and Taxonomy
    2. 9.2. Volumetric Display Market – Key Trends
      1. 9.2.1. Market Drivers
      2. 9.2.2. Market Restraints
      3. 9.2.3. Market Opportunities
    3. 9.3. Value Chain Analysis
    4. 9.4. Key Mandates and Regulations
    5. 9.5. Technology Roadmap and Timeline
    6. 9.6. Volumetric Display Market – Attractiveness Analysis
      1. 9.6.1. By Component
      2. 9.6.2. By Technology
      3. 9.6.3. By Display Type
      4. 9.6.4. By Application
      5. 9.6.5. By Region
  10. Chapter 10 Industrial Chain, Sourcing Strategy, and Downstream Buyers
    1. 10.1. Volumetric Display Industrial Chain Analysis
    2. 10.2. Downstream Buyers
    3. 10.3. Distributors/Traders List
  11. Chapter 11 Marketing Strategy Analysis
    1. 11.1. Marketing Channel
    2. 11.2. Direct Marketing
    3. 11.3. Indirect Marketing
    4. 11.4. Marketing Channel Development Trends
    5. 11.5. Economic/Political Environmental Change
  12. Chapter 12 Report Conclusion & Key Insights
    1. 12.1. Key Insights from Primary Interviews & Surveys Respondents
    2. 12.2. Key Takeaways from Analysts, Consultants, and Industry Leaders
  13. Chapter 13 Research Approach & Methodology
    1. 13.1. Report Description
    2. 13.2. Research Scope
    3. 13.3. Research Methodology
      1. 13.3.1. Secondary Research
      2. 13.3.2. Primary Research
      3. 13.3.3. Statistical Models
        1. 13.3.3.1. Company Share Analysis Model
        2. 13.3.3.2. Revenue Based Modeling
      4. 13.3.4. Research Limitations

      List of Figures

      Fig.1	Product Picture of Volumetric Display
      Fig.2	Global Volumetric Display Market, 2016 – 2026 (USD Million)
      Fig.3	Global Volumetric Display Market Absolute Revenue Opportunity, 2016 – 2026 (USD Million)
      Fig.4	Global Volumetric Display Market Incremental Revenue Opportunity, 2020 – 2026 (USD Million)
      Fig.5	COVID-19 Impacts on Volumetric Display Market
      Fig.6	COVID-19 Impact on the Players
      Fig.7	Business Strategies and Recommendations
      Fig.8	Global Volumetric Display Market Share, by Component, 2020 & 2026 (USD Million)
      Fig.9	Global Motor & Position Sensor Volumetric Display Market, 2016 – 2026 (USD Million)
      Fig.10	Global Projector Volumetric Display Market, 2016 – 2026 (USD Million)
      Fig.11	Global Mirror Volumetric Display Market, 2016 – 2026 (USD Million)
      Fig.12	Global Rendering Software Volumetric Display Market, 2016 – 2026 (USD Million)
      Fig.13	Global Rendering Electronics Volumetric Display Market, 2016 – 2026 (USD Million)
      Fig.14	Global Others Volumetric Display Market, 2016 – 2026 (USD Million)
      Fig.15	Global Volumetric Display Market Share, by Technology, 2020 & 2026 (USD Million)
      Fig.16	Global Digital Light Processing (DLP) Volumetric Display Market, 2016 – 2026 (USD Million)
      Fig.17	Global Liquid Crystal on Silicon (LCOS) Volumetric Display Market, 2016 – 2026 (USD Million)
      Fig.18	Global Volumetric Display Market Share, by Display Type, 2020 & 2026 (USD Million)
      Fig.19	Global Swept Volumetric Display Market, 2016 – 2026 (USD Million)
      Fig.20	Global Static Volumetric Display Market, 2016 – 2026 (USD Million)
      Fig.21	Global Multi-Planar Volumetric Display Market, 2016 – 2026 (USD Million)
      Fig.22	Global Volumetric Display Market Share, by Application, 2020 & 2026 (USD Million)
      Fig.23	Global Medical Volumetric Display Market, 2016 – 2026 (USD Million)
      Fig.24	Global Aerospace & Defense Volumetric Display Market, 2016 – 2026 (USD Million)
      Fig.25	Global Automotive Volumetric Display Market, 2016 – 2026 (USD Million)
      Fig.26	Global Oil & Gas Volumetric Display Market, 2016 – 2026 (USD Million)
      Fig.27	Global Education Volumetric Display Market, 2016 – 2026 (USD Million)
      Fig.28	Global Entertainment Volumetric Display Market, 2016 – 2026 (USD Million)
      Fig.29	Global Others Volumetric Display Market, 2016 – 2026 (USD Million)
      Fig.30	Global Volumetric Display Market Share, by Region, 2020 & 2026 (USD Million)
      Fig.31	North America Volumetric Display Market, 2016 – 2026 (USD Million)
      Fig.32	U.S. Volumetric Display Market, 2016 – 2026 (USD Million)
      Fig.33	Canada Volumetric Display Market, 2016 – 2026 (USD Million)
      Fig.34	Europe Volumetric Display Market, 2016 – 2026 (USD Million)
      Fig.35	Germany Volumetric Display Market, 2016 – 2026 (USD Million)
      Fig.36	France Volumetric Display Market, 2016 – 2026 (USD Million)
      Fig.37	U.K. Volumetric Display Market, 2016 – 2026 (USD Million)
      Fig.38	Italy Volumetric Display Market, 2016 – 2026 (USD Million)
      Fig.39	Spain Volumetric Display Market, 2016 – 2026 (USD Million)
      Fig.40	Rest of Europe Volumetric Display Market, 2016 – 2026 (USD Million)
      Fig.41	Asia Pacific Volumetric Display Market, 2016 – 2026 (USD Million)
      Fig.42	China Volumetric Display Market, 2016 – 2026 (USD Million)
      Fig.43	Japan Volumetric Display Market, 2016 – 2026 (USD Million)
      Fig.44	India Volumetric Display Market, 2016 – 2026 (USD Million)
      Fig.45	South  Korea Volumetric Display Market, 2016 – 2026 (USD Million)
      Fig.46	South-East Asia Volumetric Display Market, 2016 – 2026 (USD Million)
      Fig.47	Rest of Asia Pacific Volumetric Display Market, 2016 – 2026 (USD Million)
      Fig.48	Latin America Volumetric Display Market, 2016 – 2026 (USD Million)
      Fig.49	Brazil Volumetric Display Market, 2016 – 2026 (USD Million)
      Fig.50	Mexico Volumetric Display Market, 2016 – 2026 (USD Million)
      Fig.51	Rest of Latin America Volumetric Display Market, 2016 – 2026 (USD Million)
      Fig.52	Middle-East and Africa Volumetric Display Market, 2016 – 2026 (USD Million)
      Fig.53	GCC Countries Volumetric Display Market, 2016 – 2026 (USD Million)
      Fig.54	South Africa Volumetric Display Market, 2016 – 2026 (USD Million)
      Fig.55	Rest of Middle-East Africa Volumetric Display Market, 2016 – 2026 (USD Million)
      Fig.56	Competitor Market Share – Revenue
      Fig.57	Holoxica Ltd. Revenue and Growth Rate
      Fig.58	Holoxica Ltd. Market Share
      Fig.59	3DIcon Corporation Revenue and Growth Rate
      Fig.60	3DIcon Corporation Market Share
      Fig.61	Holoxica Revenue and Growth Rate
      Fig.62	Holoxica Market Share
      Fig.63	Burton Inc. Revenue and Growth Rate
      Fig.64	Burton Inc. Market Share
      Fig.65	SeeReal Technologies S.A Revenue and Growth Rate
      Fig.66	SeeReal Technologies S.A Market Share
      Fig.67	LEIA Inc. Revenue and Growth Rate
      Fig.68	LEIA Inc. Market Share
      Fig.69	Lightspace Technologies Inc. Revenue and Growth Rate
      Fig.70	Lightspace Technologies Inc. Market Share
      Fig.71	Holografika Kft. Revenue and Growth Rate
      Fig.72	Holografika Kft. Market Share
      Fig.73	Zebra Imaging Revenue and Growth Rate
      Fig.74	Zebra Imaging Market Share
      Fig.75	Seekway Technologies Revenue and Growth Rate
      Fig.76	Seekway Technologies Market Share
      Fig.77	Alioscopy Revenue and Growth Rate
      Fig.78	Alioscopy Market Share
      Fig.79	Soscho GmbH Revenue and Growth Rate
      Fig.80	Soscho GmbH Market Share
      Fig.81	The Coretec Group Inc Revenue and Growth Rate
      Fig.82	The Coretec Group Inc Market Share
      Fig.83	Voxon Photonics Pty Ltd. Revenue and Growth Rate
      Fig.84	Voxon Photonics Pty Ltd. Market Share
      Fig.85	Market Dynamics
      Fig.86	Global Volumetric Display – Value Chain Analysis
      Fig.87	Key Mandates and Regulations
      Fig.88	Technology Roadmap and Timeline
      Fig.89	Market Attractiveness Analysis – By Component
      Fig.90	Market Attractiveness Analysis – By Technology
      Fig.91	Market Attractiveness Analysis – By Display Type
      Fig.92	Market Attractiveness Analysis – By Application
      Fig.93	Market Attractiveness Analysis – By Region
      Fig.94	Volumetric Display Industrial Chain Analysis
      Fig.95	Market Channels
      Fig.96	Marketing Channel Development Trend
      Fig.97	Growth in World Gross Product, 2008-2018
      

      List of Tables

      Table 1	Global Volumetric Display Market, 2020 & 2026 (USD Million)
      Table 2	Global Volumetric Display Market, by Component, 2016 – 2026 (USD Million)
      Table 3	Global Volumetric Display Market, by Technology, 2016 – 2026 (USD Million)
      Table 4	Global Volumetric Display Market, by Display Type, 2016 – 2026 (USD Million)
      Table 5	Global Volumetric Display Market, by Application, 2016 – 2026 (USD Million)
      Table 6	Global Volumetric Display Market, by Region, 2016 – 2026 (USD Million)
      Table 7	North America Volumetric Display Market, by Country, 2016 – 2026 (USD Million)
      Table 8	North America Volumetric Display Market, by Component, 2016 – 2026 (USD Million)
      Table 9	North America Volumetric Display Market, by Technology, 2016 – 2026 (USD Million)
      Table 10 North America Volumetric Display Market, by Display Type, 2016 – 2026 (USD Million)
      Table 11 North America Volumetric Display Market, by Application, 2016 – 2026 (USD Million)
      Table 12 Europe Volumetric Display Market, by Country, 2016 – 2026 (USD Million)
      Table 13 Europe Volumetric Display Market, by Component, 2016 – 2026 (USD Million)
      Table 14 Europe Volumetric Display Market, by Technology, 2016 – 2026 (USD Million)
      Table 15 Europe Volumetric Display Market, by Display Type, 2016 – 2026 (USD Million)
      Table 16 Europe Volumetric Display Market, by Application, 2016 – 2026 (USD Million)
      Table 17 Asia Pacific Volumetric Display Market, by Country, 2016 – 2026 (USD Million)
      Table 18 Asia Pacific Volumetric Display Market, by Component, 2016 – 2026 (USD Million)
      Table 19 Asia Pacific Volumetric Display Market, by Technology, 2016 – 2026 (USD Million)
      Table 20 Asia Pacific Volumetric Display Market, by Display Type, 2016 – 2026 (USD Million)
      Table 21 Asia Pacific Volumetric Display Market, by Application, 2016 – 2026 (USD Million)
      Table 22 Latin America Volumetric Display Market, by Country, 2016 – 2026 (USD Million)
      Table 23 Latin America Volumetric Display Market, by Component, 2016 – 2026 (USD Million)
      Table 24 Latin America Volumetric Display Market, by Technology, 2016 – 2026 (USD Million)
      Table 25 Latin America Volumetric Display Market, by Display Type, 2016 – 2026 (USD Million)
      Table 26 Latin America Volumetric Display Market, by Application, 2016 – 2026 (USD Million)
      Table 27 Middle-East and Africa Volumetric Display Market, by Country, 2016 – 2026 (USD Million)
      Table 28 Middle-East and Africa Volumetric Display Market, by Component, 2016 – 2026 (USD Million)
      Table 29 Middle-East and Africa Volumetric Display Market, by Technology, 2016 – 2026 (USD Million)
      Table 30 Middle-East and Africa Volumetric Display Market, by Display Type, 2016 – 2026 (USD Million)
      Table 31 Middle-East and Africa Volumetric Display Market, by Application, 2016 – 2026 (USD Million)
      Table 32 Global Volumetric Display Market - Company Revenue Analysis, 2016 – 2020 (USD Million)
      Table 33 Global Volumetric Display Market - Company Revenue Share Analysis, 2016 – 2020 (%)
      Table 34 Acquisitions and Mergers
      Table 35 Market Drivers – Impact Analysis
      Table 36 Market Restraints
      Table 37 Market Opportunities
      Table 38 Major Buyers of Volumetric Display
      Table 39 Distributors/Traders of Volumetric Display by Region
      

Industry Major Market Players

  • Holoxica
  • Burton Inc.
  • LEIA Inc.
  • Lightspace Technologies Inc.
  • Voxon Photonics Pty Ltd.
  • The Coretec Group Inc.
  • Holoxica Ltd.
  • 3DIcon Corporation
  • Holografika Kft.
  • Zebra Imaging
  • Seekway Technologies
  • Alioscopy
  • Soscho GmbH
  • SeeReal Technologies S.A.