Search Market Research Report

Discover Our Latest Reports
Discover Our Featured Reports
Discover Top Selling Reports

Virtual Power Plant Market Size, Share Global Analysis Report, 2021 - 2026

report img

Virtual Power Plant Market By Technology (Distribution Generation, Demand Response, and Mixed Asset) By Component (Energy Generation Technology, Energy Storage Technologies, Information Communication Technology (ICT)), by End User (Commercial, Industrial, and Residential), and by Regions: Global and Regional Opportunity Analysis and Industry Forecast 2021 - 2026

Industry Insights

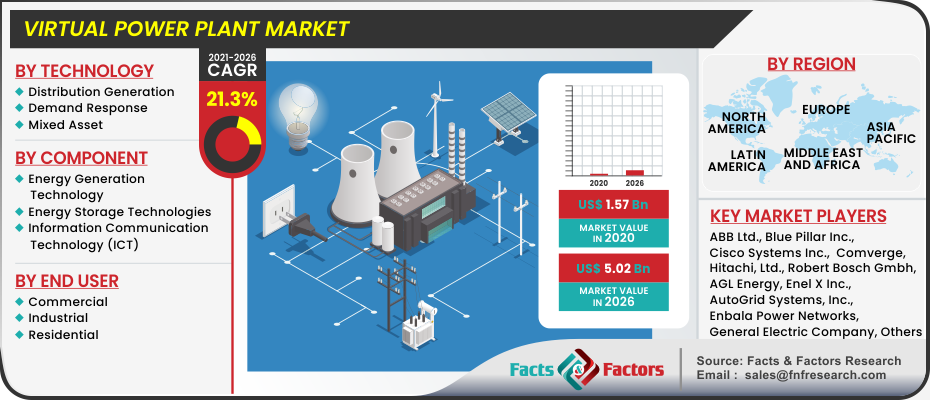
[216+ Pages Report] According to Facts and Factors, the global virtual power plants market was valued at USD 1.57 Billion in 2020 and is expected to produce over USD 5.02 Billion in revenue by the end of 2026, with a CAGR of approximately 21.3% between 2021 and 2026.

logoMarket Overview  

A VPP is defined as a virtual entity made up of even more power generation systems, controllable and storage units or flexible loads that interact with a single centralized authority responsible for monitoring the electrical energy flow within the cluster and its exchange with the main network, as well as monitoring and controlling functions across multiple DERs. Even though VPPs are currently only available on a megawatts of the power scale, they will soon be deployed on a gigawatt (gw) scale at utility level as the underlying ICTs evolve exponentially, particularly with the emergence of new disruptive technologies such as blockchain, artificial intelligence (AI), and machine learning. Advanced IT systems enable power providers to successfully manage their growing share of intermittent renewables, energy storage, and flexible usage. Microgrids make it easier to make use of DERs' flexibility and distributed nature. The concept of VPPs and aggregators is used to expand on this idea. Traditional peaking power plants and DR programs can be efficiently replaced or supplemented by aggregating various distributed resources, including load management.

Because it allows for the optimization of own energy supply and demand, a collaborative VPPVirtual Power Plant is a potential and commercial application now for SMEs in the manufacturing industry. Additional revenues are possible, but profitability is limited in the current market, as revenue potential is primarily limited to the futures market (where price spreads are currently low), making participation uneconomical for SMEs with limited load flexibility. Furthermore, the revenue potential is linked to the pool size's scalability. As a result, the number, size, and aggregated load curve of VPP participants are important to all value chain partners.

VPPs allow utilities to portray themselves as service providers and energy transition pioneers, allowing them to expand into new markets. For small and medium-sized energy supply enterprises, however, developing a scalable Virtual Power Plant (VPP) without the participation of cooperation partners is difficult to implement. Different approaches to entering the VPP market can be considered depending on the energy supply company's strengths, weaknesses, opportunities, and risks, as well as its strategy and objectives.

Virtual Power Plant Market

To know more about this report | Request Free Sample Copy

logoIndustry Growth Factors

A (VPP) is a decentralized power plant made up of decentralized power systems to integrate multiple applications of energy sources such as wind turbines, solar PV cells, and hydroelectric facilities. Furthermore, virtual power plants provide efficient power generation even during high-demand periods, as well as the ability to buy or sell power on the open market. A virtual power plant is a medium-scale power generating facility that incorporates several renewable energy sources like solar, wind, and other flexible power users, as well as storage devices. A sort of virtual power plant is mainly composed of several diversified assets that are connected via a central control system that interprets a wide range of data, including current power exchange pricing, price and weather forecasts, and system operator grid information.

Increased renewable energy penetration in the power production sector, as well as changes in power grid dynamics from centralized to distributed, are likely to boost the VPP industry. Further reductions in energy costs and the ease with which energy storage may be accessible will drive market demand. In their recent VPP venture, Tesla, for example, reported a 70% reduction in grid demand and up to a 30% reduction in rates.  Furthermore, compared to conventional power plant setup, VPP is more efficient and flexible in offering maximum demand electricity in a short notice time, which would further boost the market growth. Due to price volatility, the versatility in buying with Virtual Power Plant attracted the attention of new entrants. Potential customers can sell excess energy and acquire energy at a lower price on the trade market. Such characteristics of virtual power plants are likely to increase demand. High-frequency electromagnetic and radio waves, on the other hand, cause health risks in infants and the elderly, perhaps impeding growth. Nonetheless, government regulations requiring efficient energy generation will boost the demand for renewable energy, impact the growth of virtual power plants.

Virtual Power Plant for the Whole World The market has been divided into three categories: technology, end-user, and geography. The energy generation segment by technology currently owns the highest share of the virtual power plant market and is likely to maintain its dominance over the forecast period. Demand response is a highly profitable investment due to the long-term advantages to end-users and improved grid energy efficiency. As a result, demand response is likely to increase rapidly. Industrial by end-user, on the other hand, had the greatest market share in 2016 and is predicted to continue to do so over the projection period. Industrial end-users are among the earliest adopters of virtual power plant setups and services, contributing significantly to market growth. Electricity peak loads are highest in enterprises such as petroleum and chemical, paper & pulp among others, creating a profitable market for virtual power plants in the industrial sector.

Due to rigorous advances in the power sector, as well as expanding consumer demand for uninterruptible power supply, the market is likely to see a significant amount of technological advancement over the projection period. Multinationals and well-established corporations are also likely to invest heavily in the industry. During the forecast period, mergers and acquisitions are projected to occur.

logoSegmentation Analysis

The virtual power plant market is segmented based on technology, component and end-user:

As per technology (distribution generation, demand response, mixed-asset), by component (energy generation technology, energy storage technologies, information communication technology [ICT]), by end-user (commercial, industrial, residential). The implementation of new and advanced technologies, which has made them more multifunctional, has on condition that the industry with many worthwhile growth prospects in the coming years.

logo Regional Analysis

Due to the existence of a significant wide range of industry participants and fresh government policies across different European countries on 100 percent green energy, Europe emerged as the largest virtual power plant market share. In the virtual global power plant market, Asia-Pacific has the fastest growing market. This can be attributed to increased energy demand in rapidly industrialising countries like China and India. China, for example, contributes 36 percent of the steel industry's annual contribution to global GDP by country of operation. Because of the increased demand for renewable energy, the United States is likely to lead the industry in North America and see considerable demand for virtual power plants.

logoReport Scope

Report Attributes

Details

Market Size in 2020

USD 1.57 Billion

Projected Market Size in 2026

USD 5.02 Billion

CAGR Growth Rate

21.3% CAGR

Base Year

2020

Forecast Years

2021 - 2026

Key Market Players

ABB Ltd., Blue Pillar Inc., Cisco Systems Inc., Comverge, Hitachi, Ltd., Robert Bosch Gmbh, AGL Energy, AutoGrid Systems, Inc., Enbala Power Networks, Enel X Inc., General Electric Company, Siemens AG, Schneider Electric SE, Limejump Ltd., International Business Machines Corporation and among others.

Key Segment

By Technology, By Component, By End User, and By Region

Major Regions Covered

North America, Europe, Asia Pacific, Latin America, and the Middle East & Africa

Purchase Options

Request customized purchase options to meet your research needs. Explore purchase options

logo Covid-19 Analysis

The Covid-19 pandemic is rapidly spreading over the world. Almost every country is experiencing a pandemic at a different stage. Developing economies like India and China were effective in the early stages of containment and are continually developing further steps to limit Covid-19's detrimental effects. European countries have also seen a major drop in IT infrastructure investment. According to the International Data Corporation (IDC), because of the Covid-19 issue, which continues to affect the European economy, European IT spending on software, hardware, and IT services is expected to fall by 4.7 percent in 2020.

Covid-19's global impact has impacted business in countries like China and India, resulting in lower energy demand. As additional countries apply lockdowns to prevent the virus from spreading, utility and grid project spending has dropped at an unprecedented rate. In addition, weak demand due to lower consumer expenditure across a variety of applications has hampered the growth of virtual power plants. As part of their pandemic reaction, some governments have created a relief effort. Thailand's state-owned metropolitan electricity authority and provincial electricity authority, for example, framed a set of measures to ease the burden on consumers, including 3% bill reductions across all tariff classes, bill payment grace periods, refunding metre deposits for residential and small business users, and other benefits.

Government initiatives have put a strain on national finances, forcing a rethinking of renewable energy transitions and delaying power sector reforms. Due to large investments in developing energy infrastructure in emerging economies, the market is likely to gain traction. Furthermore, the VPP market has been hampered by a drop in demand within the power industry due to delays in power projects, as well as industrial investments due to Covid-19.

logo Competitive Players

Some of the essential players operating in the virtual power plant market are

  • ABB Ltd.
  • Blue Pillar Inc.
  • Cisco Systems Inc.
  • Comverge
  • Hitachi Ltd.
  • Robert Bosch Gmbh
  • AGL Energy
  • AutoGrid Systems Inc.
  • Enbala Power Networks
  • Enel X Inc.
  • General Electric Company
  • Siemens AG
  • Schneider Electric SE
  • Limejump Ltd.
  • International Business Machines Corporation

logoBy Technology:

  • Distribution Generation
  • Demand Response
  • Mixed Asset

logoBy Component:

  • Energy Generation Technology
  • Energy Storage Technologies
  • Information Communication Technology (ICT)

logoBy End User:

  • Commercial
  • Industrial
  • Residential

logoBy Region:
•    North America
o    U.S.
o    Canada
•    Europe
o    France
o    UK
o    Germany
o    Italy
o    Spain
o    Rest of Europe
•    Asia Pacific
o    China
o    India
o    Japan
o    South Korea
o    Southeast Asia
o    Rest of Asia-Pacific
•    Latin America
o    Brazil
o    Mexico
o    Rest of Latin America
•    Middle East & Africa
o    GCC
o    South Africa
o    Rest of Middle East & Africa

Table of Content

  1. Chapter 1 Executive Summary
    1. 1.1. Introduction of Virtual Power Plant
    2. 1.2. Global Virtual Power Plant Market, 2020 & 2026 (USD Billion)
    3. 1.3. Global Virtual Power Plant Market, 2016 – 2026 (USD Billion) (Megawatts)
    4. 1.4. Global Virtual Power Plant Market Absolute Revenue Opportunity, 2016 – 2026 (USD Billion)
    5. 1.5. Global Virtual Power Plant Market Incremental Revenue Opportunity, 2020 – 2026 (USD Billion)
  2. Chapter 2 Virtual Power Plant Market – Sales Channel Analysis
    1. 2.1. Global Virtual Power Plant Market – Sales Channel Overview
    2. 2.2. Global Virtual Power Plant Market Share, by Sales Channel, 2020 & 2026 (USD Billion)
    3. 2.3. Global Virtual Power Plant Market share, by Sales Channel, 2020 & 2026 (Megawatts)
    4. 2.4. Premium Food Service
      1. 2.4.1. Global Premium Food Service Virtual Power Plant Market, 2016 – 2026 (USD Billion)
      2. 2.4.2. Global Premium Food Service Virtual Power Plant Market, 2016 – 2026 (Megawatts)
    5. 2.5. Non Premium Food Service
      1. 2.5.1. Global Non Premium Food Service Virtual Power Plant Market, 2016 – 2026 (USD Billion)
      2. 2.5.2. Global Non Premium Food Service Virtual Power Plant Market, 2016 – 2026 (Megawatts)
    6. 2.6. B2B
      1. 2.6.1. Global B2B Virtual Power Plant Market, 2016 – 2026 (USD Billion)
      2. 2.6.2. Global B2B Virtual Power Plant Market, 2016 – 2026 (Megawatts)
  3. Chapter 3 Virtual Power Plant Market – Application Analysis
    1. 3.1. Global Virtual Power Plant Market – Application Overview
    2. 3.2. Global Virtual Power Plant Market Share, by Application, 2020 & 2026 (USD Billion)
    3. 3.3. Global Virtual Power Plant Market Share, by Application, 2020 & 2026 (Megawatts)
    4. 3.4. Savory
      1. 3.4.1. Global Savory Virtual Power Plant Market, 2016 – 2026 (USD Billion)
      2. 3.4.2. Global Savory Virtual Power Plant Market, 2016 – 2026 (Megawatts)
    5. 3.5. Sandwich
      1. 3.5.1. Global Sandwich Virtual Power Plant Market, 2016 – 2026 (USD Billion)
      2. 3.5.2. Global Sandwich Virtual Power Plant Market, 2016 – 2026 (Megawatts)
    6. 3.6. Salad Dressings & Dip
      1. 3.6.1. Global Salad Dressings & Dip Virtual Power Plant Market, 2016 – 2026 (USD Billion)
      2. 3.6.2. Global Salad Dressings & Dip Virtual Power Plant Market, 2016 – 2026 (Megawatts)
    7. 3.7. Baked Goods/Desserts
      1. 3.7.1. Global Baked Goods/Desserts Virtual Power Plant Market, 2016 – 2026 (USD Billion)
      2. 3.7.2. Global Baked Goods/Desserts Virtual Power Plant Market, 2016 – 2026 (Megawatts)
    8. 3.8. Ice Creams & Smoothies
      1. 3.8.1. Global Ice Creams & Smoothies Virtual Power Plant Market, 2016 – 2026 (USD Billion)
      2. 3.8.2. Global Ice Creams & Smoothies Virtual Power Plant Market, 2016 – 2026 (Megawatts)
  4. Chapter 4 Virtual Power Plant Market – Regional Analysis
    1. 4.1. Global Virtual Power Plant Market Regional Overview
    2. 4.2. Global Virtual Power Plant Market Share, by Region, 2020 & 2026 (USD Billion)
    3. 4.3. Global Virtual Power Plant Market Share, by Region, 2020 & 2026 (Megawatts)
    4. 4.4. North America
      1. 4.4.1. North America Virtual Power Plant Market, 2016 – 2026 (USD Billion)
        1. 4.4.1.1. North America Virtual Power Plant Market, by Country, 2016 - 2026 (USD Billion)
      2. 4.4.2. North America Market, 2016 – 2026 (Megawatts)
        1. 4.4.2.1. North America Virtual Power Plant Market, by Country, 2016 - 2026 (Megawatts)
      3. 4.4.3. North America Virtual Power Plant Market, by Sales Channel, 2016 – 2026
        1. 4.4.3.1. North America Virtual Power Plant Market, by Sales Channel, 2016 – 2026 (USD Billion)
        2. 4.4.3.2. North America Virtual Power Plant Market, by Sales Channel, 2016 – 2026 (Megawatts)
      4. 4.4.4. North America Virtual Power Plant Market, by Application, 2016 – 2026
        1. 4.4.4.1. North America Virtual Power Plant Market, by Application, 2016 – 2026 (USD Billion)
        2. 4.4.4.2. North America Virtual Power Plant Market, by Application, 2016 – 2026 (Megawatts)
      5. 4.4.5. U.S.
        1. 4.4.5.1. U.S. Virtual Power Plant Market, 2016 – 2026 (USD Billion)
        2. 4.4.5.2. U.S. Virtual Power Plant Market, 2016 – 2026 (Megawatts)
      6. 4.4.6. Canada
        1. 4.4.6.1. Canada Virtual Power Plant Market, 2016 – 2026 (USD Billion)
        2. 4.4.6.2. Canada Virtual Power Plant Market, 2016 – 2026 (Megawatts)
    5. 4.5. Europe
      1. 4.5.1. Europe Virtual Power Plant Market, 2016 – 2026 (USD Billion)
        1. 4.5.1.1. Europe Virtual Power Plant Market, by Country, 2016 - 2026 (USD Billion)
      2. 4.5.2. Europe Virtual Power Plant Market, 2016 – 2026 (Megawatts)
        1. 4.5.2.1. Europe Virtual Power Plant Market, by Country, 2016 - 2026 (Megawatts)
      3. 4.5.3. Europe Virtual Power Plant Market, by Sales Channel, 2016 – 2026
        1. 4.5.3.1. Europe Virtual Power Plant Market, by Sales Channel, 2016 – 2026 (USD Billion)
        2. 4.5.3.2. Europe Virtual Power Plant Market, by Sales Channel, 2016 – 2026 (Megawatts)
      4. 4.5.4. Europe Virtual Power Plant Market, by Application, 2016 – 2026
        1. 4.5.4.1. Europe Virtual Power Plant Market, by Application, 2016 – 2026 (USD Billion)
        2. 4.5.4.2. Europe Virtual Power Plant Market, by Application, 2016 – 2026 (Megawatts)
      5. 4.5.5. Germany
        1. 4.5.5.1. Germany Virtual Power Plant Market, 2016 – 2026 (USD Billion)
        2. 4.5.5.2. Germany Virtual Power Plant Market, 2016 – 2026 (Megawatts)
      6. 4.5.6. France
        1. 4.5.6.1. France Virtual Power Plant Market, 2016 – 2026 (USD Billion)
        2. 4.5.6.2. France Virtual Power Plant Market, 2016 – 2026 (Megawatts)
      7. 4.5.7. U.K.
        1. 4.5.7.1. U.K. Virtual Power Plant Market, 2016 – 2026 (USD Billion)
        2. 4.5.7.2. U.K. Virtual Power Plant Market, 2016 – 2026 (Megawatts)
      8. 4.5.8. Italy
        1. 4.5.8.1. Italy Virtual Power Plant Market, 2016 – 2026 (USD Billion)
        2. 4.5.8.2. Italy Virtual Power Plant Market, 2016 – 2026 (Megawatts)
      9. 4.5.9. Spain
        1. 4.5.9.1. Spain Virtual Power Plant Market, 2016 – 2026 (USD Billion)
        2. 4.5.9.2. Spain Virtual Power Plant Market, 2016 – 2026 (Megawatts)
      10. 4.5.10. Rest of Europe
        1. 4.5.10.1. Rest of Europe Virtual Power Plant Market, 2016 – 2026 (USD Billion)
        2. 4.5.10.2. Rest of Europe Virtual Power Plant Market, 2016 – 2026 (Megawatts)
    6. 4.6. Asia Pacific
      1. 4.6.1. Asia Pacific Virtual Power Plant Market, 2016 – 2026 (USD Billion)
        1. 4.6.1.1. Asia Pacific Virtual Power Plant Market, by Country, 2016 - 2026 (USD Billion)
      2. 4.6.2. Asia Pacific Virtual Power Plant Market, 2016 – 2026 (Megawatts)
        1. 4.6.2.1. Asia Pacific Virtual Power Plant Market, by Country, 2016 - 2026 (Megawatts)
      3. 4.6.3. Asia Pacific Virtual Power Plant Market, by Sales Channel, 2016 – 2026
        1. 4.6.3.1. Asia Pacific Virtual Power Plant Market, by Sales Channel, 2016 – 2026 (USD Billion)
        2. 4.6.3.2. Asia Pacific Virtual Power Plant Market, by Sales Channel, 2016 – 2026 (Megawatts)
      4. 4.6.4. Asia Pacific Virtual Power Plant Market, by Application, 2016 – 2026
        1. 4.6.4.1. Asia Pacific Virtual Power Plant Market, by Application, 2016 – 2026 (USD Billion)
        2. 4.6.4.2. Asia Pacific Virtual Power Plant Market, by Application, 2016 – 2026 (Megawatts)
      5. 4.6.5. China
        1. 4.6.5.1. China Virtual Power Plant Market, 2016 – 2026 (USD Billion)
        2. 4.6.5.2. China Virtual Power Plant Market, 2016 – 2026 (Megawatts)
      6. 4.6.6. India
        1. 4.6.6.1. India Virtual Power Plant Market, 2016 – 2026 (USD Billion)
        2. 4.6.6.2. India Virtual Power Plant Market, 2016 – 2026 (Megawatts)
      7. 4.6.7. Japan
        1. 4.6.7.1. Japan Virtual Power Plant Market, 2016 – 2026 (USD Billion)
        2. 4.6.7.2. Japan Virtual Power Plant Market, 2016 – 2026 (Megawatts)
      8. 4.6.8. South Korea
        1. 4.6.8.1. South Korea Virtual Power Plant Market, 2016 – 2026 (USD Billion)
        2. 4.6.8.2. South Korea Virtual Power Plant Market, 2016 – 2026 (Megawatts)
      9. 4.6.9. South-East Asia
        1. 4.6.9.1. South-East Asia Virtual Power Plant Market, 2016 – 2026 (USD Billion)
        2. 4.6.9.2. South-East Asia Virtual Power Plant Market, 2016 – 2026 (Megawatts)
      10. 4.6.10. Rest of Asia Pacific
        1. 4.6.10.1. Rest of Asia Pacific Virtual Power Plant Market, 2016 – 2026 (USD Billion)
        2. 4.6.10.2. Rest of Asia Pacific Virtual Power Plant Market, 2016 – 2026 (Megawatts)
    7. 4.7. Latin America
      1. 4.7.1. Latin America Virtual Power Plant Market, 2016 – 2026 (USD Billion)
        1. 4.7.1.1. Latin America Virtual Power Plant Market, by Country, 2016 - 2026 (USD Billion)
      2. 4.7.2. Latin America Virtual Power Plant Market, 2016 – 2026 (Megawatts)
        1. 4.7.2.1. Latin America Virtual Power Plant Market, by Country, 2016 - 2026 (Megawatts)
      3. 4.7.3. Latin America Virtual Power Plant Market, by Sales Channel, 2016 – 2026
        1. 4.7.3.1. Latin America Virtual Power Plant Market, by Sales Channel, 2016 – 2026 (USD Billion)
        2. 4.7.3.2. Latin America Virtual Power Plant Market, by Sales Channel, 2016 – 2026 (Megawatts)
      4. 4.7.4. Latin America Virtual Power Plant Market, by Application, 2016 – 2026
        1. 4.7.4.1. Latin America Virtual Power Plant Market, by Application, 2016 – 2026 (USD Billion)
        2. 4.7.4.2. Latin America Virtual Power Plant Market, by Application, 2016 – 2026 (Megawatts)
      5. 4.7.5. Brazil
        1. 4.7.5.1. Brazil Virtual Power Plant Market, 2016 – 2026 (USD Billion)
        2. 4.7.5.2. Brazil Virtual Power Plant Market, 2016 – 2026 (Megawatts)
      6. 4.7.6. Mexico
        1. 4.7.6.1. Mexico Virtual Power Plant Market, 2016 – 2026 (USD Billion)
        2. 4.7.6.2. Mexico Virtual Power Plant Market, 2016 – 2026 (Megawatts)
      7. 4.7.7. Rest of Latin America
        1. 4.7.7.1. Rest of Latin America Virtual Power Plant Market, 2016 – 2026 (USD Billion)
        2. 4.7.7.2. Rest of Latin America Virtual Power Plant Market, 2016 – 2026 (Megawatts)
    8. 4.8. Middle East & Africa
      1. 4.8.1. Middle East & Africa Virtual Power Plant Market, 2016 – 2026 (USD Billion)
        1. 4.8.1.1. Middle East & Africa Virtual Power Plant Market, by Country, 2016 - 2026 (USD Billion)
      2. 4.8.2. Middle East & Africa Virtual Power Plant Market, 2016 – 2026 (Megawatts)
        1. 4.8.2.1. Middle East & Africa Virtual Power Plant Market, by Country, 2016 - 2026 (Megawatts)
      3. 4.8.3. Middle East & Africa Virtual Power Plant Market, by Sales Channel, 2016 – 2026
        1. 4.8.3.1. Middle East & Africa Virtual Power Plant Market, by Sales Channel, 2016 – 2026 (USD Billion)
        2. 4.8.3.2. Middle East & Africa Virtual Power Plant Market, by Sales Channel, 2016 – 2026 (Megawatts)
      4. 4.8.4. Middle East & Africa Virtual Power Plant Market, by Application, 2016 – 2026
        1. 4.8.4.1. Middle East & Africa Virtual Power Plant Market, by Application, 2016 – 2026 (USD Billion)
        2. 4.8.4.2. Middle East & Africa Virtual Power Plant Market, by Application, 2016 – 2026 (Megawatts)
      5. 4.8.5. GCC
        1. 4.8.5.1. GCC Virtual Power Plant Market, 2016 – 2026 (USD Billion)
        2. 4.8.5.2. GCC Virtual Power Plant Market, 2016 – 2026 (Megawatts)
      6. 4.8.6. South Africa
        1. 4.8.6.1. South Africa Virtual Power Plant Market, 2016 – 2026 (USD Billion)
        2. 4.8.6.2. South Africa Virtual Power Plant Market, 2016 – 2026 (Megawatts)
      7. 4.8.7. Rest of Middle East & Africa
        1. 4.8.7.1. Rest of Middle East & Africa Virtual Power Plant Market, 2016 – 2026 (USD Billion)
        2. 4.8.7.2. Rest of Middle East & Africa Virtual Power Plant Market, 2016 – 2026 (Megawatts)
  5. Chapter 5 Virtual Power Plant Production, Consumption, Export, Import by Regions
    1. 5.1. Global Virtual Power Plant Production and Consumption, 2016 – 2026 (Megawatts)
    2. 5.2. Global Import and Export Analysis, by Region
  6. Chapter 6 Virtual Power Plant Market – Competitive Landscape
    1. 6.1. Competitor Market Share – Revenue
    2. 6.2. Market Concentration Rate Analysis, Top 3 and Top 5 Players
    3. 6.3. Competitor Market Share – Volume
    4. 6.4. Strategic Developments
      1. 6.4.1. Acquisitions and Mergers
      2. 6.4.2. New Products
      3. 6.4.3. Research & Development Activities
  7. Chapter 7 Company Profiles
    1. 7.1. Daisy Brand LLC
      1. 7.1.1. Company Overview
      2. 7.1.2. Product/Service Portfolio
      3. 7.1.3. Daisy Brand LLC Sales, Revenue, Price, and Gross Margin
      4. 7.1.4. Daisy Brand LLC Revenue and Growth Rate
      5. 7.1.5. Daisy Brand LLC Market Share
      6. 7.1.6. Recent Initiatives, Funding/VC Activities, and Technological Innovations
    2. 7.2. Dean Foods
      1. 7.2.1. Company Overview
      2. 7.2.2. Product/Service Portfolio
      3. 7.2.3. Dean Foods Sales, Revenue, Price, and Gross Margin
      4. 7.2.4. Dean Foods Revenue and Growth Rate
      5. 7.2.5. Dean Foods Market Share
      6. 7.2.6. Recent Initiatives, Funding/VC Activities, and Technological Innovations
    3. 7.3. Land O’ Lakes
      1. 7.3.1. Company Overview
      2. 7.3.2. Product/Service Portfolio
      3. 7.3.3. Land O’ Lakes Sales, Revenue, Price, and Gross Margin
      4. 7.3.4. Land O’ Lakes Revenue and Growth Rate
      5. 7.3.5. Land O’ Lakes Market Share
      6. 7.3.6. Recent Initiatives, Funding/VC Activities, and Technological Innovations
    4. 7.4. Scott Brothers Diary Inc.
      1. 7.4.1. Company Overview
      2. 7.4.2. Product/Service Portfolio
      3. 7.4.3. Scott Brothers Diary Inc. Sales, Revenue, Price, and Gross Margin
      4. 7.4.4. Scott Brothers Diary Inc. Revenue and Growth Rate
      5. 7.4.5. Scott Brothers Diary Inc. Market Share
      6. 7.4.6. Recent Initiatives, Funding/VC Activities, and Technological Innovations
    5. 7.5. Uelzena Ingredients
      1. 7.5.1. Company Overview
      2. 7.5.2. Product/Service Portfolio
      3. 7.5.3. Uelzena Ingredients Sales, Revenue, Price, and Gross Margin
      4. 7.5.4. Uelzena Ingredients Revenue and Growth Rate
      5. 7.5.5. Uelzena Ingredients Market Share
      6. 7.5.6. Recent Initiatives, Funding/VC Activities, and Technological Innovations
    6. 7.6. Compsey Creamery
      1. 7.6.1. Company Overview
      2. 7.6.2. Product/Service Portfolio
      3. 7.6.3. Compsey Creamery Sales, Revenue, Price, and Gross Margin
      4. 7.6.4. Compsey Creamery Revenue and Growth Rate
      5. 7.6.5. Compsey Creamery Market Share
      6. 7.6.6. Recent Initiatives, Funding/VC Activities, and Technological Innovations
    7. 7.7. Prairie Farms Dairy
      1. 7.7.1. Company Overview
      2. 7.7.2. Product/Service Portfolio
      3. 7.7.3. Prairie Farms Dairy Sales, Revenue, Price, and Gross Margin
      4. 7.7.4. Prairie Farms Dairy Revenue and Growth Rate
      5. 7.7.5. Prairie Farms Dairy Market Share
      6. 7.7.6. Recent Initiatives, Funding/VC Activities, and Technological Innovations
    8. 7.8. HP Hood LLC
      1. 7.8.1. Company Overview
      2. 7.8.2. Product/Service Portfolio
      3. 7.8.3. HP Hood LLC Sales, Revenue, Price, and Gross Margin
      4. 7.8.4. HP Hood LLC Revenue and Growth Rate
      5. 7.8.5. HP Hood LLC Market Share
      6. 7.8.6. Recent Initiatives, Funding/VC Activities, and Technological Innovations
    9. 7.9. Cabot Creamery
      1. 7.9.1. Company Overview
      2. 7.9.2. Product/Service Portfolio
      3. 7.9.3. Cabot Creamery Sales, Revenue, Price, and Gross Margin
      4. 7.9.4. Cabot Creamery Revenue and Growth Rate
      5. 7.9.5. Cabot Creamery Market Share
      6. 7.9.6. Recent Initiatives, Funding/VC Activities, and Technological Innovations
    10. 7.10. Barambah Organics Pty Ltd.
      1. 7.10.1. Company Overview
      2. 7.10.2. Product/Service Portfolio
      3. 7.10.3. Barambah Organics Pty Ltd. Sales, Revenue, Price, and Gross Margin
      4. 7.10.4. Barambah Organics Pty Ltd. Revenue and Growth Rate
      5. 7.10.5. Barambah Organics Pty Ltd. Market Share
      6. 7.10.6. Recent Initiatives, Funding/VC Activities, and Technological Innovations
    11. 7.11. Meggle
      1. 7.11.1. Company Overview
      2. 7.11.2. Product/Service Portfolio
      3. 7.11.3. Meggle Sales, Revenue, Price, and Gross Margin
      4. 7.11.4. Meggle Revenue and Growth Rate
      5. 7.11.5. Meggle Market Share
      6. 7.11.6. Recent Initiatives, Funding/VC Activities, and Technological Innovations
  8. Chapter 8 Virtual Power Plant — Industry Analysis
    1. 8.1. Introduction and Taxonomy
    2. 8.2. Virtual Power Plant Market – Key Trends
      1. 8.2.1. Market Drivers
      2. 8.2.2. Market Restraints
      3. 8.2.3. Market Opportunities
    3. 8.3. Value Chain Analysis
    4. 8.4. Key Mandates and Regulations
    5. 8.5. Technology Roadmap and Timeline
    6. 8.6. Virtual Power Plant Market – Attractiveness Analysis
      1. 8.6.1. By Sales Channel
      2. 8.6.2. By Application
      3. 8.6.3. By Region
  9. Chapter 9 Raw Material Analysis
    1. 9.1. Virtual Power Plant Key Raw Material Analysis
      1. 9.1.1. Key Raw Materials
      2. 9.1.2. Price Trend of Key Raw Materials
    2. 9.2. Key Suppliers of Raw Materials
    3. 9.3. Proportion of Manufacturing Cost Structure
      1. 9.3.1. Raw Materials Cost
      2. 9.3.2. Labor Cost
      3. 9.3.3. Manufacturing Expenses
      4. 9.3.4. Miscellaneous Expenses
    4. 9.4. Manufacturing Cost Analysis of Virtual Power Plant
  10. Chapter 10 Industrial Chain, Sourcing Strategy, and Downstream Buyers
    1. 10.1. Virtual Power Plant Industrial Chain Analysis
    2. 10.2. Upstream Raw Materials Sourcing
      1. 10.2.1. Risk Mitigation:
      2. 10.2.2. Supplier Relationships:
      3. 10.2.3. Business Processes:
      4. 10.2.4. Securing the Product:
    3. 10.3. Raw Materials Sources of Virtual Power Plant Major Manufacturers
    4. 10.4. Downstream Buyers
    5. 10.5. Distributors/Traders List
  11. Chapter 11 Marketing Strategy Analysis, Distributors
    1. 11.1. Marketing Channel
    2. 11.2. Direct Marketing
    3. 11.3. Indirect Marketing
    4. 11.4. Marketing Channel Development Trends
    5. 11.5. Economic/Political Environmental Change
  12. Chapter 12 Report Conclusion & Key Insights
    1. 12.1. Key Insights from Primary Interviews & Surveys Respondents
    2. 12.2. Key Takeaways from Analysts, Consultants, and Industry Leaders
  13. Chapter 13 Research Approach & Methodology
    1. 13.1. Report Description
    2. 13.2. Research Scope
    3. 13.3. Research Methodology
      1. 13.3.1. Secondary Research
      2. 13.3.2. Primary Research
      3. 13.3.3. Statistical Models
        1. 13.3.3.1. Company Share Analysis Model
        2. 13.3.3.2. Revenue Based Modeling
      4. 13.3.4. Research Limitations

      List of Figures

      Fig.1	Product Picture of Virtual Power Plant
      Fig.2	Global Virtual Power Plant Market, 2016 – 2026 (USD Billion)
      Fig.3	Global Virtual Power Plant Market, 2016 – 2026 (Megawatts)
      Fig.4	Global Virtual Power Plant Market Absolute Revenue Opportunity, 2016 – 2026 (USD Billion)
      Fig.5	Global Virtual Power Plant Market Incremental Revenue Opportunity, 2020 – 2026 (USD Billion)
      Fig.6	Global Virtual Power Plant Market Share, by Sales Channel, 2020 & 2026 (USD Billion)
      Fig.7	Global Virtual Power Plant Market Share, by Sales Channel, 2020 & 2026 (Megawatts)
      Fig.8	Global Premium Food Service Virtual Power Plant Market, 2016 – 2026 (USD Billion)
      Fig.9	Global Premium Food Service Virtual Power Plant Market, 2016 – 2026 (Megawatts)
      Fig.10	Global Non Premium Food Service Virtual Power Plant Market, 2016 – 2026 (USD Billion)
      Fig.11	Global Non Premium Food Service Virtual Power Plant  Market, 2016 – 2026 (Megawatts)
      Fig.12	Global B2B Virtual Power Plant Market, 2016 – 2026 (USD Billion)
      Fig.13	Global B2B Virtual Power Plant  Market, 2016 – 2026 (Megawatts)
      Fig.14	Global Virtual Power Plant Market Share, by Application, 2020 & 2026 (USD Billion)
      Fig.15	Global Virtual Power Plant Market Share, by Application, 2020 & 2026 (Megawatts)
      Fig.16	Global Savory Virtual Power Plant Market, 2016 – 2026 (USD Billion)
      Fig.17	Global Savory Virtual Power Plant  Market, 2016 – 2026 (Megawatts)
      Fig.18	Global Sandwich Virtual Power Plant Market, 2016 – 2026 (USD Billion)
      Fig.19	Global Sandwich Virtual Power Plant  Market, 2016 – 2026 (Megawatts)
      Fig.20	Global Salad Dressings & Dip Virtual Power Plant Market, 2016 – 2026 (USD Billion)
      Fig.21	Global Salad Dressings & Dip Virtual Power Plant  Market, 2016 – 2026 (Megawatts)
      Fig.22	Global Baked Goods/Desserts Virtual Power Plant Market, 2016 – 2026 (USD Billion)
      Fig.23	Global Baked Goods/Desserts Virtual Power Plant  Market, 2016 – 2026 (Megawatts)
      Fig.24	Global Ice Creams & Smoothies Virtual Power Plant Market, 2016 – 2026 (USD Billion)
      Fig.25	Global Ice Creams & Smoothies Virtual Power Plant  Market, 2016 – 2026 (Megawatts)
      Fig.26	Global Virtual Power Plant Market Share, by Region, 2020 & 2026 (USD Billion)
      Fig.27	Global Virtual Power Plant Market Share, by Region, 2020 & 2026 (Megawatts)
      Fig.28	North America Virtual Power Plant Market, 2016 – 2026 (USD Billion)
      Fig.29	North America Virtual Power Plant Market, 2016 – 2026 (Megawatts)
      Fig.30	U.S. Virtual Power Plant Market, 2016 – 2026 (USD Billion)
      Fig.31	U.S. Virtual Power Plant  Market, 2016 – 2026 (Megawatts)
      Fig.32	Canada Virtual Power Plant Market, 2016 – 2026 (USD Billion)
      Fig.33	Canada Virtual Power Plant  Market, 2016 – 2026 (Megawatts)
      Fig.34	Europe Virtual Power Plant Market, 2016 – 2026 (USD Billion)
      Fig.35	Europe Virtual Power Plant  Market, 2016 – 2026 (Megawatts)
      Fig.36	Germany Virtual Power Plant Market, 2016 – 2026 (USD Billion)
      Fig.37	Germany Virtual Power Plant  Market, 2016 – 2026 (Megawatts)
      Fig.38	France Virtual Power Plant Market, 2016 – 2026 (USD Billion)
      Fig.39	France Virtual Power Plant  Market, 2016 – 2026 (Megawatts)
      Fig.40	U.K. Virtual Power Plant Market, 2016 – 2026 (USD Billion)
      Fig.41	U.K. Virtual Power Plant  Market, 2016 – 2026 (Megawatts)
      Fig.42	Italy Virtual Power Plant Market, 2016 – 2026 (USD Billion)
      Fig.43	Italy Virtual Power Plant  Market, 2016 – 2026 (Megawatts)
      Fig.44	Spain Virtual Power Plant Market, 2016 – 2026 (USD Billion)
      Fig.45	Spain Virtual Power Plant  Market, 2016 – 2026 (Megawatts)
      Fig.46	Rest of Europe Virtual Power Plant Market, 2016 – 2026 (USD Billion)
      Fig.47	Rest of Europe Virtual Power Plant  Market, 2016 – 2026 (Megawatts)
      Fig.48	Asia Pacific Virtual Power Plant Market, 2016 – 2026 (USD Billion)
      Fig.49	Asia Pacific Virtual Power Plant  Market, 2016 – 2026 (Megawatts)
      Fig.50	China Virtual Power Plant Market, 2016 – 2026 (USD Billion)
      Fig.51	China Virtual Power Plant  Market, 2016 – 2026 (Megawatts)
      Fig.52	India Virtual Power Plant Market, 2016-2026 (USD Billion)
      Fig.53	India Virtual Power Plant  Market, 2016 – 2026 (Megawatts)
      Fig.54	Japan Virtual Power Plant Market, 2016 – 2026 (USD Billion)
      Fig.55	Japan Virtual Power Plant  Market, 2016 – 2026 (Megawatts)
      Fig.56	South Korea Virtual Power Plant Market, 2016 – 2026 (USD Billion)
      Fig.57	South Korea Virtual Power Plant  Market, 2016 – 2026 (Megawatts)
      Fig.58	South-East Asia Virtual Power Plant Market, 2016 – 2026 (USD Billion)
      Fig.59	South-East Asia Virtual Power Plant  Market, 2016 – 2026 (Megawatts)
      Fig.60	Rest of Asia Pacific Virtual Power Plant Market, 2016 – 2026 (USD Billion)
      Fig.61	Rest of Asia Pacific Virtual Power Plant  Market, 2016 – 2026 (Megawatts)
      Fig.62	Latin America Virtual Power Plant Market, 2016 – 2026 (USD Billion)
      Fig.63	Latin America Virtual Power Plant  Market, 2016 – 2026 (Megawatts)
      Fig.64	Brazil Virtual Power Plant Market, 2016 – 2026 (USD Billion)
      Fig.65	Brazil Virtual Power Plant  Market, 2016 – 2026 (Megawatts)
      Fig.66	Mexico Virtual Power Plant Market, 2016 – 2026 (USD Billion)
      Fig.67	Mexico Virtual Power Plant  Market, 2016 – 2026 (Megawatts)
      Fig.68	Rest of Latin America Virtual Power Plant Market, 2016 – 2026 (USD Billion)
      Fig.69	Rest of Latin America Virtual Power Plant  Market, 2016 – 2026 (Megawatts)
      Fig.70	Middle East & Africa Virtual Power Plant Market, 2016 – 2026 (USD Billion)
      Fig.71	Middle East & Africa Virtual Power Plant  Market, 2016 – 2026 (Megawatts)
      Fig.72	GCC Virtual Power Plant Market, 2016 – 2026 (USD Billion)
      Fig.73	GCC Virtual Power Plant Market, 2016 – 2026 (Megawatts)
      Fig.74	South Africa Virtual Power Plant Market, 2016 – 2026 (USD Billion)
      Fig.75	South Africa Virtual Power Plant  Market, 2016 – 2026 (Megawatts)
      Fig.76	Rest of Middle East & Africa Virtual Power Plant Market, 2016 – 2026 (USD Billion)
      Fig.77	Rest of Middle East & Africa Virtual Power Plant Market, 2016 – 2026 (Megawatts)
      Fig.78	Global Virtual Power Plant Production and Consumption, 2016 – 2026 (Megawatts)
      Fig.79	North America Virtual Power Plant Production and Consumption, 2016 – 2026 (Megawatts)
      Fig.80	Europe Virtual Power Plant Production and Consumption, 2016 – 2026 (USD Billion) (Megawatts)
      Fig.81	Asia Pacific Virtual Power Plant Production and Consumption, 2016 – 2026 (USD Billion) (Megawatts)
      Fig.82	Latin America Virtual Power Plant Production and Consumption, 2016 – 2026 (USD Billion) (Megawatts)
      Fig.83	Middle East and Africa Virtual Power Plant Production and Consumption, 2016 – 2026 (USD Billion) (Megawatts)
      Fig.84	Competitor Market Share – Revenue
      Fig.85	Competitor Market Share – Volume
      Fig.86	Daisy Brand LLC Revenue and Growth Rate
      Fig.87	Daisy Brand LLC Market Share
      Fig.88	Market Dynamics
      Fig.89	Global Virtual Power Plant – Value Chain Analysis
      Fig.90	Key Mandates and Regulations
      Fig.91	Technology Roadmap and Timeline
      Fig.92	Market Attractiveness Analysis – By Sales Channel
      Fig.93	Market Attractiveness Analysis – By Application
      Fig.94	Market Attractiveness Analysis – By Region
      Fig.95	Manufacturing Cost Structure of Virtual Power Plant
      Fig.96	Virtual Power Plant Industrial Chain Analysis
      Fig.97	Market Channels
      Fig.98	Marketing Channel Development Trend
      Fig.99	Growth in World Gross Product, 2008-2018
      

      List of Tables

      	
      Table 1	Global Virtual Power Plant Market, 2020 & 2026 (USD Billion)
      Table 2	Global Virtual Power Plant Market, by Sales Channel, 2016 – 2026 (USD Billion)
      Table 3	Global Virtual Power Plant Market, by Sales Channel, 2016 – 2026 (Megawatts)
      Table 4	Global Virtual Power Plant Market, by Application, 2016 – 2026 (USD Billion)
      Table 5	Global Virtual Power Plant Market, by Application, 2016 – 2026 (Megawatts)
      Table 6	Global Virtual Power Plant Market, by Region, 2016 – 2026 (USD Billion)
      Table 7	Global Virtual Power Plant Market, by Region, 2016 – 2026 (Megawatts)
      Table 8	North America Virtual Power Plant Market, by Country, 2016 – 2026 (USD Billion)
      Table 9	North America Virtual Power Plant Market, by Country, 2016 – 2026 (Megawatts)
      Table 10 North America Virtual Power Plant Market, by Sales Channel, 2016 – 2026 (USD Billion)
      Table 11 North America Virtual Power Plant Market, by Sales Channel, 2016 – 2026 (Megawatts)
      Table 12 North America Virtual Power Plant Market, by Application, 2016 – 2026 (USD Billion)
      Table 13 North America Virtual Power Plant Market, by Application, 2016 – 2026 (Megawatts)
      Table 14 Europe Virtual Power Plant Market, by Country, 2016 – 2026 (USD Billion)
      Table 15 Europe Virtual Power Plant Market, by Country, 2016 – 2026 (Megawatts)
      Table 16 Europe Virtual Power Plant Market, by Sales Channel, 2016 – 2026 (USD Billion)
      Table 17 Europe Virtual Power Plant Market, by Sales Channel, 2016 – 2026 (Megawatts)
      Table 18 Europe Virtual Power Plant Market, by Application, 2016 – 2026 (USD Billion)
      Table 19 Europe Virtual Power Plant Market, by Application, 2016 – 2026 (Megawatts)
      Table 20 Asia Pacific Virtual Power Plant Market, by Country, 2016 – 2026 (USD Billion)
      Table 21 Europe Virtual Power Plant Market, by Country, 2016 – 2026 (Megawatts)
      Table 22 Asia Pacific Virtual Power Plant Market, by Sales Channel, 2016 – 2026 (USD Billion)
      Table 23 Asia Pacific Virtual Power Plant Market, by Sales Channel, 2016 – 2026 (Megawatts)
      Table 24 Asia Pacific Virtual Power Plant Market, by Application (Recipes), 2016 – 2026 (USD Billion)
      Table 25 Asia Pacific Virtual Power Plant Market, by Application, 2016 – 2026 (Megawatts)
      Table 26 Latin America Virtual Power Plant Market, by Country, 2016 – 2026 (USD Billion)
      Table 27 Latin America Virtual Power Plant Market, by Country, 2016 – 2026 (Megawatts)
      Table 28 Latin America Virtual Power Plant Market, by Sales Channel, 2016 – 2026 (USD Billion)
      Table 29 Latin America Virtual Power Plant Market, by Sales Channel, 2016 – 2026 (Megawatts)
      Table 30 Latin America Virtual Power Plant Market, by Application, 2016 – 2026 (USD Billion)
      Table 31 Latin America Virtual Power Plant Market, by Application, 2016 – 2026 (Megawatts)
      Table 32 Middle East & Africa Virtual Power Plant Market, by Country, 2016 – 2026 (USD Billion)
      Table 33 Middle East & Africa Virtual Power Plant Market, by Country, 2016 – 2026 (Megawatts)
      Table 34 Middle East & Africa Virtual Power Plant Market, by Sales Channel, 2016 – 2026 (USD Billion)
      Table 35 Middle East & Africa Virtual Power Plant Market, by Sales Channel, 2016 – 2026 (Megawatts)
      Table 36 Middle East & Africa Virtual Power Plant Market, by Application, 2016 – 2026 (USD Billion)
      Table 37 Middle East & Africa Virtual Power Plant Market, by Application, 2016 – 2026 (Megawatts)
      Table 38 North America Virtual Power Plant Production, Consumption, Export, Import, 2016 – 2019
      Table 39 Europe Virtual Power Plant Production, Consumption, Export, Import, 2016 – 2019
      Table 40 Asia Pacific Virtual Power Plant Production, Consumption, Export, Import, 2016 – 2019
      Table 41 Latin America Virtual Power Plant Production, Consumption, Export, Import, 2016 – 2019
      Table 42 Middle East & Africa Virtual Power Plant Production, Consumption, Export, Import, 2016 – 2019
      Table 43 Global Virtual Power Plant Market - Company Revenue Analysis, 2016 – 2019 (USD Billion)
      Table 44 Global Virtual Power Plant Market - Company Revenue Share Analysis, 2016 – 2019 (%)
      Table 45 Global Virtual Power Plant Market - Company Volume Analysis, 2016 – 2019 (Megawatts)
      Table 46 Global Virtual Power Plant Market - Company Volume Share Analysis, 2016 – 2019 (%)
      Table 47 Acquisitions and Mergers
      Table 48 Market Drivers – Impact Analysis
      Table 49 Market Restraints
      Table 50 Market Opportunities
      Table 51 Production Base and Market Concentration Rate of Raw Material
      Table 52 Key Suppliers of Raw Materials
      Table 53 Raw Materials Sources of Virtual Power Plant Major Manufacturers
      Table 54 Major Buyers of Virtual Power Plant
      Table 55 Distributors/Traders of Virtual Power Plant by Region
      

Industry Major Market Players

  • ABB Ltd.
  • Blue Pillar Inc.
  • Cisco Systems Inc.
  • Comverge
  • Hitachi Ltd.
  • Robert Bosch Gmbh
  • AGL Energy
  • AutoGrid Systems Inc.
  • Enbala Power Networks
  • Enel X Inc.
  • General Electric Company
  • Siemens AG
  • Schneider Electric SE
  • Limejump Ltd.
  • International Business Machines Corporation