Search Market Research Report

Discover Our Latest Reports
Discover Our Featured Reports
Discover Top Selling Reports

Virtual Fitness Market Size, Share Global Analysis Report, 2021 – 2026

report img

Virtual Fitness Market By Streaming Type (Live & On-Demand), By Sessions (Group & Solo), By Devices (Smart TV, Smartphones, Laptops, Desktops & Tables, & Others), By Revenue Model (Subscription, Advertisement, & Hybrid), And By Regions - Global & Regional Industry Perspective, Comprehensive Analysis, and Forecast 2021 – 2026

Industry Insights

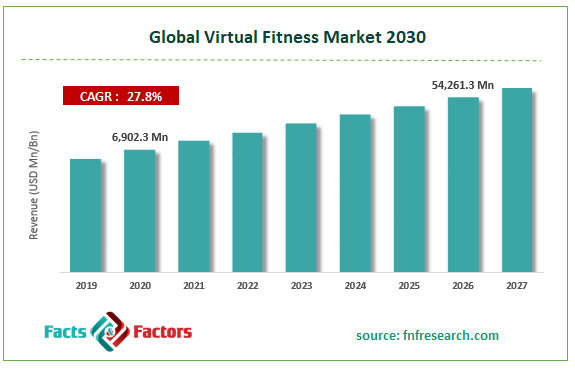
[197+ Pages Report] The latest findings and offers on the virtual fitness market released by Facts & Factors in a neatly titled “Global Virtual Fitness Market”. In this report, the global virtual fitness market was valued at USD 6,902.3 Million in the year 2020 and will grow at an estimated CAGR rate of 27.8% to an overall value of USD 54,261.3 Million by 2026.

Global Virtual Fitness Market Size

To know more about this report | Request Free Sample Copy

logoMarket Overview

Virtual fitness are a format of delivery of services that are often provided over-the-air (OTA) by means of online communication for a wide range of services. These services often pertain to exercises that are aimed at keeping the intended user at a fit and lean physique in terms of setting fitness goals, tracking caloric intake, gathering workout ideas, and sharing progress on social media in some cases. These platforms often have the ability to reach a wider audience base as users can work in tandem for achieving a common goal.

logoIndustry Growth Factors

The global virtual fitness market is expected to be driven by flexibility of services offered by the latter coupled with integration of a wider forms of exercise measures such as yoga and meditation to name a few. Additionally, the increasing number of the working population requiring fitness routines on an irregular time schedule coupled with increased smartphone and connectivity measures is expected to increase the footprint of the global virtual fitness market during the forecast period. Moreover, pro-fitness solutions and fitness policies coupled with increased adoption of fitness solution in the global overview is expected to open new revenue opportunities for the global virtual fitness market during the forecast period.

The global virtual fitness market is expected to be driven by the increasing advent of the ongoing pandemic which has given rise to social distancing measures coupled with work from home timelines to name a few. Furthermore, the global virtual fitness market is expected to reach a wider consumer base by a shifting tradition of people from gyms and offline fitness institutions towards virtual fitness solutions. However, lack of awareness regarding online fitness programs are expected to decrease the market share during the forecast period.

logoSegmentation Analysis

The global virtual fitness market is segmented into streaming type, sessions, devices, revenue model, and regions.

The global virtual fitness market is divided into live & on-demand on the basis of streaming type. The segment pertaining to live is expected to witness the largest market share during the advent of the forecast owing to factors pertaining to variety of content, comfort, and convenience measures coupled with integration of services owing to pilates, yoga, toning and dancing classes to name a few. The global virtual fitness market is bifurcated into groups and solo on the basis of sessions. The group sessions segment is expected to witness the largest market share during the advent of the forecast owing to increased adoption of group sessions for workout owing to factors pertaining to postural alignment, improving robust strength, and enhanced functional fitness measures to name a few. The global virtual fitness market is fragmented into smart TV, smartphones, laptops, desktops & tablets, and others on the basis of devices. The smartphones segment is expected to witness the largest market share during the advent of the forecast owing to increasing popularity of fitness applications in the sector coupled with increased adoption of smartphones for the usage of mobile applications to name a few. Based on revenue model, the global virtual fitness market is segregated into subscription, advertisement, and hybrid. The segment pertaining to hybrid is expected to occupy the largest market share during the advent of the forecast owing to increased number of consumers combining the ability to try the free sessions coupled with those willing to buy the subscription plans to name a few.

logo Report Scope

Report Attribute

Details

Market Size in 2020

USD 6,902.3 Million

Projected Market Size in 2026

USD 54,261.3 Million

CAGR Growth Rate

 27.8% CAGR

Base Year

2020

Forecast Years

2021-2026

Key Market Players

Fitbit, Inc., ClassPass, Inc., FitnessonDemand, Peloton, Wellbeats, Inc., REH-FIT, Les Mills International Ltd., Sworkit, Navigate Wellbeing Solutions, Peerfit, Inc., Viva Leisure, Wellbeats, Inc., Zwift, Csharter Fitness, Inc., Wexer, Fittr, and MoveGB, among others

Key Segments

Streaming Types, Sessions, Devices, Revenue Models, and Region

Major Regions Covered

North America, Europe, Asia Pacific, Latin America, and Middle East & Africa

Purchase Options

Request customized purchase options to meet your research needs. Explore purchase options

logo Regional Analysis

Asia-Pacific is expected to witness the largest market share during the advent of the forecast owing to increasing internet penetration solutions in the region coupled with the increasing demand for virtual fitness applications from emerging economies such as China and India to name a few. Additionally, increasing working population coupled with a hectic lifestyle of the patrons is expected to increase the footprint of the virtual fitness market during the forecast period. Moreover, internet proliferation and increased adoption of smartphones among the general population is expected to open new revenue opportunities for the virtual fitness market during the forecast period.

logo Competitive Players

The key market participants in the global virtual fitness market are Fitbit, Inc., ClassPass, Inc., FitnessonDemand, Peloton, Wellbeats, Inc., REH-FIT, Les Mills International Ltd., Sworkit, Navigate Wellbeing Solutions, Peerfit, Inc., Viva Leisure, Wellbeats, Inc., Zwift, Csharter Fitness, Inc., Wexer, Fittr, and MoveGB, among others.

  • Fitbit Inc.
  • ClassPass Inc.
  • FitnessonDemand
  • Peloton
  • Wellbeats Inc.
  • REH-FIT
  • Les Mills International Ltd.
  • Sworkit
  • Navigate Wellbeing Solutions
  • Peerfit Inc.
  • Viva Leisure
  • Wellbeats Inc.
  • Zwift
  • Csharter Fitness Inc.
  • Wexer
  • Fittr
  • MoveGB

logo By Streaming Type Segment Analysis

  • Live
  • On-Demand

logo By Sessions Segment Analysis

  • Group
  • Solo

logo By Devices Segment Analysis

  • Smart TV
  • Smartphones
  • Laptops
  • Desktops & Tables
  • Others

logo By Revenue Model Segment Analysis

  • Subscription
  • Advertisement
  • Hybrid

Table of Content

  1. Chapter 1 Executive Summary
    1. 1.1. Introduction of Virtual Fitness
    2. 1.2. Global Virtual Fitness Market, 2019 & 2026 (USD Million)
    3. 1.3. Global Virtual Fitness Market, 2016 – 2026 (USD Million)
    4. 1.4. Global Virtual Fitness Market Absolute Revenue Opportunity, 2016 – 2026 (USD Million)
    5. 1.5. Global Virtual Fitness Market Incremental Revenue Opportunity, 2020 – 2026 (USD Million)
  2. Chapter 2 Virtual Fitness Market – Streaming Type Analysis
    1. 2.1. Global Virtual Fitness Market – Streaming Type Overview
    2. 2.2. Global Virtual Fitness Market Share, by Streaming Type , 2019 & 2026 (USD Million)
    3. 2.3. Live
      1. 2.3.1. Global Live Virtual Fitness Market, 2016 – 2026 (USD Million)
    4. 2.4. On-Demand
      1. 2.4.1. Global On-Demand Virtual Fitness Market, 2016 – 2026 (USD Million)
  3. Chapter 3 Virtual Fitness Market – Sessions Analysis
    1. 3.1. Global Virtual Fitness Market – Sessions Overview
    2. 3.2. Global Virtual Fitness Market Share, by Sessions, 2019 & 2026 (USD Million)
    3. 3.3. Group
      1. 3.3.1. Global Group Virtual Fitness Market, 2016 – 2026 (USD Million)
    4. 3.4. Solo
      1. 3.4.1. Global Solo Virtual Fitness Market, 2016 – 2026 (USD Million)
  4. Chapter 4 Virtual Fitness Market – Devices Analysis
    1. 4.1. Global Virtual Fitness Market – Devices Overview
    2. 4.2. Global Virtual Fitness Market Share, by Devices, 2019 & 2026 (USD Million)
    3. 4.3. Smart TV
      1. 4.3.1. Global Smart TV Virtual Fitness Market, 2016 – 2026 (USD Million)
    4. 4.4. Smartphones
      1. 4.4.1. Global Smartphones Virtual Fitness Market, 2016 – 2026 (USD Million)
    5. 4.5. Laptops
      1. 4.5.1. Global Laptops Virtual Fitness Market, 2016 – 2026 (USD Million)
    6. 4.6. Desktops & Tables
      1. 4.6.1. Global Desktops & Tables Virtual Fitness Market, 2016 – 2026 (USD Million)
    7. 4.7. Others
      1. 4.7.1. Global Others Virtual Fitness Market, 2016 – 2026 (USD Million)
  5. Chapter 5 Virtual Fitness Market – Revenue Model Analysis
    1. 5.1. Global Virtual Fitness Market – Revenue Model Overview
    2. 5.2. Global Virtual Fitness Market Share, by Revenue Model, 2019 & 2026 (USD Million)
    3. 5.3. Subscription
      1. 5.3.1. Global Subscription Virtual Fitness Market, 2016 – 2026 (USD Million)
    4. 5.4. Advertisement
      1. 5.4.1. Global Advertisement Virtual Fitness Market, 2016 – 2026 (USD Million)
    5. 5.5. Hybrid
      1. 5.5.1. Global Hybrid Virtual Fitness Market, 2016 – 2026 (USD Million)
  6. Chapter 6 Virtual Fitness Market – Regional Analysis
    1. 6.1. Global Virtual Fitness Market Regional Overview
    2. 6.2. Global Virtual Fitness Market Share, by Region, 2019 & 2026 (USD Million)
    3. 6.3. North America
      1. 6.3.1. North America Virtual Fitness Market, 2016 – 2026 (USD Million)
        1. 6.3.1.1. North America Virtual Fitness Market, by Country, 2016 - 2026 (USD Million)
      2. 6.3.2. North America Virtual Fitness Market, by Streaming Type , 2016 – 2026
        1. 6.3.2.1. North America Virtual Fitness Market, by Streaming Type , 2016 – 2026 (USD Million)
      3. 6.3.3. North America Virtual Fitness Market, by Sessions, 2016 – 2026
        1. 6.3.3.1. North America Virtual Fitness Market, by Sessions, 2016 – 2026 (USD Million)
      4. 6.3.4. North America Virtual Fitness Market, by Devices, 2016 – 2026
        1. 6.3.4.1. North America Virtual Fitness Market, by Devices, 2016 – 2026 (USD Million)
      5. 6.3.5. North America Virtual Fitness Market, by Revenue Model, 2016 – 2026
        1. 6.3.5.1. North America Virtual Fitness Market, by Revenue Model, 2016 – 2026 (USD Million)
      6. 6.3.6. U.S.
        1. 6.3.6.1. U.S. Virtual Fitness Market, 2016 – 2026 (USD Million)
      7. 6.3.7. Canada
        1. 6.3.7.1. Canada Virtual Fitness Market, 2016 – 2026 (USD Million)
    4. 6.4. Europe
      1. 6.4.1. Europe Virtual Fitness Market, 2016 – 2026 (USD Million)
        1. 6.4.1.1. Europe Virtual Fitness Market, by Country, 2016 - 2026 (USD Million)
      2. 6.4.2. Europe Virtual Fitness Market, by Streaming Type , 2016 – 2026
        1. 6.4.2.1. Europe Virtual Fitness Market, by Streaming Type , 2016 – 2026 (USD Million)
      3. 6.4.3. Europe Virtual Fitness Market, by Sessions, 2016 – 2026
        1. 6.4.3.1. Europe Virtual Fitness Market, by Sessions, 2016 – 2026 (USD Million)
      4. 6.4.4. Europe Virtual Fitness Market, by Devices, 2016 – 2026
        1. 6.4.4.1. Europe Virtual Fitness Market, by Devices, 2016 – 2026 (USD Million)
      5. 6.4.5. Europe Virtual Fitness Market, by Revenue Model, 2016 – 2026
        1. 6.4.5.1. Europe Virtual Fitness Market, by Revenue Model, 2016 – 2026 (USD Million)
      6. 6.4.6. Germany
        1. 6.4.6.1. Germany Virtual Fitness Market, 2016 – 2026 (USD Million)
      7. 6.4.7. France
        1. 6.4.7.1. France Virtual Fitness Market, 2016 – 2026 (USD Million)
      8. 6.4.8. U.K.
        1. 6.4.8.1. U.K. Virtual Fitness Market, 2016 – 2026 (USD Million)
      9. 6.4.9. Italy
        1. 6.4.9.1. Italy Virtual Fitness Market, 2016 – 2026 (USD Million)
      10. 6.4.10. Spain
        1. 6.4.10.1. Spain Virtual Fitness Market, 2016 – 2026 (USD Million)
      11. 6.4.11. Rest of Europe
        1. 6.4.11.1. Rest of Europe Virtual Fitness Market, 2016 – 2026 (USD Million)
    5. 6.5. Asia Pacific
      1. 6.5.1. Asia Pacific Virtual Fitness Market, 2016 – 2026 (USD Million)
        1. 6.5.1.1. Asia Pacific Virtual Fitness Market, by Country, 2016 - 2026 (USD Million)
      2. 6.5.2. Asia Pacific Virtual Fitness Market, by Streaming Type , 2016 – 2026
        1. 6.5.2.1. Asia Pacific Virtual Fitness Market, by Streaming Type , 2016 – 2026 (USD Million)
      3. 6.5.3. Asia Pacific Virtual Fitness Market, by Sessions, 2016 – 2026
        1. 6.5.3.1. Asia Pacific Virtual Fitness Market, by Sessions, 2016 – 2026 (USD Million)
      4. 6.5.4. Asia Pacific Virtual Fitness Market, by Devices, 2016 – 2026
        1. 6.5.4.1. Asia Pacific Virtual Fitness Market, by Devices, 2016 – 2026 (USD Million)
      5. 6.5.5. Asia Pacific Virtual Fitness Market, by Revenue Model, 2016 – 2026
        1. 6.5.5.1. Asia Pacific Virtual Fitness Market, by Revenue Model, 2016 – 2026 (USD Million)
      6. 6.5.6. China
        1. 6.5.6.1. China Virtual Fitness Market, 2016 – 2026 (USD Million)
      7. 6.5.7. Japan
        1. 6.5.7.1. Japan Virtual Fitness Market, 2016 – 2026 (USD Million)
      8. 6.5.8. India
        1. 6.5.8.1. India Virtual Fitness Market, 2016 – 2026 (USD Million)
      9. 6.5.9. South Korea
        1. 6.5.9.1. South Korea Virtual Fitness Market, 2016 – 2026 (USD Million)
      10. 6.5.10. South-East Asia
        1. 6.5.10.1. South-East Asia Virtual Fitness Market, 2016 – 2026 (USD Million)
      11. 6.5.11. Rest of Asia Pacific
        1. 6.5.11.1. Rest of Asia Pacific Virtual Fitness Market, 2016 – 2026 (USD Million)
    6. 6.6. Latin America
      1. 6.6.1. Latin America Virtual Fitness Market, 2016 – 2026 (USD Million)
        1. 6.6.1.1. Latin America Virtual Fitness Market, by Country, 2016 - 2026 (USD Million)
      2. 6.6.2. Latin America Virtual Fitness Market, by Streaming Type , 2016 – 2026
        1. 6.6.2.1. Latin America Virtual Fitness Market, by Streaming Type , 2016 – 2026 (USD Million)
      3. 6.6.3. Latin America Virtual Fitness Market, by Sessions, 2016 – 2026
        1. 6.6.3.1. Latin America Virtual Fitness Market, by Sessions, 2016 – 2026 (USD Million)
      4. 6.6.4. Latin America Virtual Fitness Market, by Devices, 2016 – 2026
        1. 6.6.4.1. Latin America Virtual Fitness Market, by Devices, 2016 – 2026 (USD Million)
      5. 6.6.5. Latin America Virtual Fitness Market, by Revenue Model, 2016 – 2026
        1. 6.6.5.1. Latin America Virtual Fitness Market, by Revenue Model, 2016 – 2026 (USD Million)
      6. 6.6.6. Brazil
        1. 6.6.6.1. Brazil Virtual Fitness Market, 2016 – 2026 (USD Million)
      7. 6.6.7. Mexico
        1. 6.6.7.1. Mexico Virtual Fitness Market, 2016 – 2026 (USD Million)
      8. 6.6.8. Rest of Latin America
        1. 6.6.8.1. Rest of Latin America Virtual Fitness Market, 2016 – 2026 (USD Million)
    7. 6.7. The Middle-East and Africa
      1. 6.7.1. The Middle-East and Africa Virtual Fitness Market, 2016 – 2026 (USD Million)
        1. 6.7.1.1. The Middle-East and Africa Virtual Fitness Market, by Country, 2016 - 2026 (USD Million)
      2. 6.7.2. The Middle-East and Africa Virtual Fitness Market, by Streaming Type , 2016 – 2026
        1. 6.7.2.1. The Middle-East and Africa Virtual Fitness Market, by Streaming Type , 2016 – 2026 (USD Million)
      3. 6.7.3. The Middle-East and Africa Virtual Fitness Market, by Sessions, 2016 – 2026
        1. 6.7.3.1. The Middle-East and Africa Virtual Fitness Market, by Sessions, 2016 – 2026 (USD Million)
      4. 6.7.4. The Middle-East and Africa Virtual Fitness Market, by Devices, 2016 – 2026
        1. 6.7.4.1. The Middle-East and Africa Virtual Fitness Market, by Devices, 2016 – 2026 (USD Million)
      5. 6.7.5. The Middle-East and Africa Virtual Fitness Market, by Revenue Model, 2016 – 2026
        1. 6.7.5.1. The Middle-East and Africa Virtual Fitness Market, by Revenue Model, 2016 – 2026 (USD Million)
      6. 6.7.6. GCC Countries
        1. 6.7.6.1. GCC Countries Virtual Fitness Market, 2016 – 2026 (USD Million)
      7. 6.7.7. South Africa
        1. 6.7.7.1. South Africa Virtual Fitness Market, 2016 – 2026 (USD Million)
      8. 6.7.8. Rest of Middle-East Africa
        1. 6.7.8.1. Rest of Middle-East Africa Virtual Fitness Market, 2016 – 2026 (USD Million)
  7. Chapter 7 Virtual Fitness Market – Competitive Landscape
    1. 7.1. Competitor Market Share – Revenue
    2. 7.2. Market Concentration Rate Analysis, Top 3 and Top 5 Players
    3. 7.3. Strategic Developments
      1. 7.3.1. Acquisitions and Mergers
      2. 7.3.2. New Products
      3. 7.3.3. Research & Development Activities
  8. Chapter 8 Company Profiles
    1. 8.1. Fitbit Inc
      1. 8.1.1. Company Overview
      2. 8.1.2. Product/Service Portfolio
      3. 8.1.3. Fitbit Inc Sales, Revenue, and Gross Margin
      4. 8.1.4. Fitbit Inc Revenue and Growth Rate
      5. 8.1.5. Fitbit Inc Market Share
      6. 8.1.6. Recent Initiatives, Funding/VC Activities, and Technological Innovations
    2. 8.2. ClassPass Inc
      1. 8.2.1. Company Overview
      2. 8.2.2. Product/Service Portfolio
      3. 8.2.3. ClassPass Inc Sales, Revenue, and Gross Margin
      4. 8.2.4. ClassPass Inc Revenue and Growth Rate
      5. 8.2.5. ClassPass Inc Market Share
      6. 8.2.6. Recent Initiatives, Funding/VC Activities, and Technological Innovations
    3. 8.3. FitnessonDemand
      1. 8.3.1. Company Overview
      2. 8.3.2. Product/Service Portfolio
      3. 8.3.3. FitnessonDemand Sales, Revenue, and Gross Margin
      4. 8.3.4. FitnessonDemand Revenue and Growth Rate
      5. 8.3.5. FitnessonDemand Market Share
      6. 8.3.6. Recent Initiatives, Funding/VC Activities, and Technological Innovations
    4. 8.4. Peloton
      1. 8.4.1. Company Overview
      2. 8.4.2. Product/Service Portfolio
      3. 8.4.3. Peloton Sales, Revenue, and Gross Margin
      4. 8.4.4. Peloton Revenue and Growth Rate
      5. 8.4.5. Peloton Market Share
      6. 8.4.6. Recent Initiatives, Funding/VC Activities, and Technological Innovations
    5. 8.5. Wellbeats Inc
      1. 8.5.1. Company Overview
      2. 8.5.2. Product/Service Portfolio
      3. 8.5.3. Wellbeats Inc Sales, Revenue, and Gross Margin
      4. 8.5.4. Wellbeats Inc Revenue and Growth Rate
      5. 8.5.5. Wellbeats Inc Market Share
      6. 8.5.6. Recent Initiatives, Funding/VC Activities, and Technological Innovations
    6. 8.6. REH-FIT
      1. 8.6.1. Company Overview
      2. 8.6.2. Product/Service Portfolio
      3. 8.6.3. REH-FIT Sales, Revenue, and Gross Margin
      4. 8.6.4. REH-FIT Revenue and Growth Rate
      5. 8.6.5. REH-FIT Market Share
      6. 8.6.6. Recent Initiatives, Funding/VC Activities, and Technological Innovations
    7. 8.7. Les Mills International Ltd
      1. 8.7.1. Company Overview
      2. 8.7.2. Product/Service Portfolio
      3. 8.7.3. Les Mills International Ltd Sales, Revenue, and Gross Margin
      4. 8.7.4. Les Mills International Ltd Revenue and Growth Rate
      5. 8.7.5. Les Mills International Ltd Market Share
      6. 8.7.6. Recent Initiatives, Funding/VC Activities, and Technological Innovations
    8. 8.8. Sworkit
      1. 8.8.1. Company Overview
      2. 8.8.2. Product/Service Portfolio
      3. 8.8.3. Sworkit Sales, Revenue, and Gross Margin
      4. 8.8.4. Sworkit Revenue and Growth Rate
      5. 8.8.5. Sworkit Market Share
      6. 8.8.6. Recent Initiatives, Funding/VC Activities, and Technological Innovations
    9. 8.9. Navigate Wellbeing Solutions
      1. 8.9.1. Company Overview
      2. 8.9.2. Product/Service Portfolio
      3. 8.9.3. Navigate Wellbeing Solutions Sales, Revenue, and Gross Margin
      4. 8.9.4. Navigate Wellbeing Solutions Revenue and Growth Rate
      5. 8.9.5. Navigate Wellbeing Solutions Market Share
      6. 8.9.6. Recent Initiatives, Funding/VC Activities, and Technological Innovations
    10. 8.10. Peerfit Inc
      1. 8.10.1. Company Overview
      2. 8.10.2. Product/Service Portfolio
      3. 8.10.3. Peerfit Inc Sales, Revenue, and Gross Margin
      4. 8.10.4. Peerfit Inc Revenue and Growth Rate
      5. 8.10.5. Peerfit Inc Market Share
      6. 8.10.6. Recent Initiatives, Funding/VC Activities, and Technological Innovations
    11. 8.11. Viva Leisure
      1. 8.11.1. Company Overview
      2. 8.11.2. Product/Service Portfolio
      3. 8.11.3. Viva Leisure Sales, Revenue, and Gross Margin
      4. 8.11.4. Viva Leisure Revenue and Growth Rate
      5. 8.11.5. Viva Leisure Market Share
      6. 8.11.6. Recent Initiatives, Funding/VC Activities, and Technological Innovations
    12. 8.12. Wellbeats Inc
      1. 8.12.1. Company Overview
      2. 8.12.2. Product/Service Portfolio
      3. 8.12.3. Wellbeats Inc Sales, Revenue, and Gross Margin
      4. 8.12.4. Wellbeats Inc Revenue and Growth Rate
      5. 8.12.5. Wellbeats Inc Market Share
      6. 8.12.6. Recent Initiatives, Funding/VC Activities, and Technological Innovations
    13. 8.13. Zwift
      1. 8.13.1. Company Overview
      2. 8.13.2. Product/Service Portfolio
      3. 8.13.3. Zwift Sales, Revenue, and Gross Margin
      4. 8.13.4. Zwift Revenue and Growth Rate
      5. 8.13.5. Zwift Market Share
      6. 8.13.6. Recent Initiatives, Funding/VC Activities, and Technological Innovations
    14. 8.14. Csharter Fitness Inc
      1. 8.14.1. Company Overview
      2. 8.14.2. Product/Service Portfolio
      3. 8.14.3. Csharter Fitness Inc Sales, Revenue, and Gross Margin
      4. 8.14.4. Csharter Fitness Inc Revenue and Growth Rate
      5. 8.14.5. Csharter Fitness Inc Market Share
      6. 8.14.6. Recent Initiatives, Funding/VC Activities, and Technological Innovations
    15. 8.15. Wexer
      1. 8.15.1. Company Overview
      2. 8.15.2. Product/Service Portfolio
      3. 8.15.3. Wexer Sales, Revenue, and Gross Margin
      4. 8.15.4. Wexer Revenue and Growth Rate
      5. 8.15.5. Wexer Market Share
      6. 8.15.6. Recent Initiatives, Funding/VC Activities, and Technological Innovations
    16. 8.16. Fittr
      1. 8.16.1. Company Overview
      2. 8.16.2. Product/Service Portfolio
      3. 8.16.3. Fittr Sales, Revenue, and Gross Margin
      4. 8.16.4. Fittr Revenue and Growth Rate
      5. 8.16.5. Fittr Market Share
      6. 8.16.6. Recent Initiatives, Funding/VC Activities, and Technological Innovations
    17. 8.17. MoveGB
      1. 8.17.1. Company Overview
      2. 8.17.2. Product/Service Portfolio
      3. 8.17.3. MoveGB Sales, Revenue, and Gross Margin
      4. 8.17.4. MoveGB Revenue and Growth Rate
      5. 8.17.5. MoveGB Market Share
      6. 8.17.6. Recent Initiatives, Funding/VC Activities, and Technological Innovations
  9. Chapter 9 Virtual Fitness — Industry Analysis
    1. 9.1. Introduction and Taxonomy
    2. 9.2. Virtual Fitness Market – Key Trends
      1. 9.2.1. Market Drivers
      2. 9.2.2. Market Restraints
      3. 9.2.3. Market Opportunities
    3. 9.3. Value Chain Analysis
    4. 9.4. Key Mandates and Regulations
    5. 9.5. Technology Roadmap and Timeline
    6. 9.6. Virtual Fitness Market – Attractiveness Analysis
      1. 9.6.1. By Streaming Type
      2. 9.6.2. By Sessions
      3. 9.6.3. By Devices
      4. 9.6.4. By Revenue Model
      5. 9.6.5. By Region
  10. Chapter 10 Industrial Chain, Sourcing Strategy, and Downstream Buyers
    1. 10.1. Virtual Fitness Industrial Chain Analysis
    2. 10.2. Downstream Buyers
    3. 10.3. Distributors/Traders List
  11. Chapter 11 Marketing Strategy Analysis
    1. 11.1. Marketing Channel
    2. 11.2. Direct Marketing
    3. 11.3. Indirect Marketing
    4. 11.4. Marketing Channel Development Trends
    5. 11.5. Economic/Political Environmental Change
  12. Chapter 12 Report Conclusion & Key Insights
    1. 12.1. Key Insights from Primary Interviews & Surveys Respondents
    2. 12.2. Key Takeaways from Analysts, Consultants, and Industry Leaders
  13. Chapter 13 Research Approach & Methodology
    1. 13.1. Report Description
    2. 13.2. Research Scope
    3. 13.3. Research Methodology
      1. 13.3.1. Secondary Research
      2. 13.3.2. Primary Research
      3. 13.3.3. Statistical Models
        1. 13.3.3.1. Company Share Analysis Model
        2. 13.3.3.2. Revenue Based Modeling
      4. 13.3.4. Research Limitations

      List of Figures

      Fig.1	Product Picture of Virtual Fitness
      Fig.2	Global Virtual Fitness Market, 2016 – 2026 (USD Million)
      Fig.3	Global Virtual Fitness Market Absolute Revenue Opportunity, 2016 – 2026 (USD Million)
      Fig.4	Global Virtual Fitness Market Incremental Revenue Opportunity, 2020 – 2026 (USD Million)
      Fig.5	Global Virtual Fitness Market Share, by Streaming Type , 2019 & 2026 (USD Million)
      Fig.6	Global Live  Virtual Fitness Market, 2016 – 2026 (USD Million)
      Fig.7	Global On-Demand Virtual Fitness Market, 2016 – 2026 (USD Million)
      Fig.8	Global Virtual Fitness Market Share, by Sessions, 2019 & 2026 (USD Million)
      Fig.9	Global Group  Virtual Fitness Market, 2016 – 2026 (USD Million)
      Fig.10	Global Solo Virtual Fitness Market, 2016 – 2026 (USD Million)
      Fig.11	Global Virtual Fitness Market Share, by Devices, 2019 & 2026 (USD Million)
      Fig.12	Global Smart TV Virtual Fitness Market, 2016 – 2026 (USD Million)
      Fig.13	Global Smartphones  Virtual Fitness Market, 2016 – 2026 (USD Million)
      Fig.14	Global Laptops  Virtual Fitness Market, 2016 – 2026 (USD Million)
      Fig.15	Global Desktops & Tables  Virtual Fitness Market, 2016 – 2026 (USD Million)
      Fig.16	Global Others  Virtual Fitness Market, 2016 – 2026 (USD Million)
      Fig.17	Global Virtual Fitness Market Share, by Revenue Model, 2019 & 2026 (USD Million)
      Fig.18	Global Subscription Virtual Fitness Market, 2016 – 2026 (USD Million)
      Fig.19	Global Advertisement  Virtual Fitness Market, 2016 – 2026 (USD Million)
      Fig.20	Global Hybrid Virtual Fitness Market, 2016 – 2026 (USD Million)
      Fig.21	Global Virtual Fitness Market Share, by Region, 2019 & 2026 (USD Million)
      Fig.22	North America Virtual Fitness Market, 2016 – 2026 (USD Million)
      Fig.23	U.S. Virtual Fitness Market, 2016 – 2026 (USD Million)
      Fig.24	Canada Virtual Fitness Market, 2016 – 2026 (USD Million)
      Fig.25	Europe Virtual Fitness Market, 2016 – 2026 (USD Million)
      Fig.26	Germany Virtual Fitness Market, 2016 – 2026 (USD Million)
      Fig.27	France Virtual Fitness Market, 2016 – 2026 (USD Million)
      Fig.28	U.K. Virtual Fitness Market, 2016 – 2026 (USD Million)
      Fig.29	Italy Virtual Fitness Market, 2016 – 2026 (USD Million)
      Fig.30	Spain Virtual Fitness Market, 2016 – 2026 (USD Million)
      Fig.31	Rest of Europe Virtual Fitness Market, 2016 – 2026 (USD Million)
      Fig.32	Asia Pacific Virtual Fitness Market, 2016 – 2026 (USD Million)
      Fig.33	China Virtual Fitness Market, 2016 – 2026 (USD Million)
      Fig.34	Japan Virtual Fitness Market, 2016 – 2026 (USD Million)
      Fig.35	India Virtual Fitness Market, 2016 – 2026 (USD Million)
      Fig.36	South  Korea Virtual Fitness Market, 2016 – 2026 (USD Million)
      Fig.37	South-East Asia Virtual Fitness Market, 2016 – 2026 (USD Million)
      Fig.38	Rest of Asia Pacific Virtual Fitness Market, 2016 – 2026 (USD Million)
      Fig.39	Latin America Virtual Fitness Market, 2016 – 2026 (USD Million)
      Fig.40	Brazil Virtual Fitness Market, 2016 – 2026 (USD Million)
      Fig.41	Mexico Virtual Fitness Market, 2016 – 2026 (USD Million)
      Fig.42	Rest of Latin America Virtual Fitness Market, 2016 – 2026 (USD Million)
      Fig.43	The Middle-East and Africa Virtual Fitness Market, 2016 – 2026 (USD Million)
      Fig.44	GCC Countries Virtual Fitness Market, 2016 – 2026 (USD Million)
      Fig.45	South Africa Virtual Fitness Market, 2016 – 2026 (USD Million)
      Fig.46	Rest of Middle-East Africa Virtual Fitness Market, 2016 – 2026 (USD Million)
      Fig.47	Competitor Market Share – Revenue
      Fig.48	Fitbit Inc Revenue and Growth Rate
      Fig.49	Fitbit Inc Market Share
      Fig.50	ClassPass Inc Revenue and Growth Rate
      Fig.51	ClassPass Inc Market Share
      Fig.52	FitnessonDemand Revenue and Growth Rate
      Fig.53	FitnessonDemand Market Share
      Fig.54	Peloton Revenue and Growth Rate
      Fig.55	Peloton Market Share
      Fig.56	Wellbeats Inc Revenue and Growth Rate
      Fig.57	Wellbeats Inc Market Share
      Fig.58	REH-FIT Revenue and Growth Rate
      Fig.59	REH-FIT Market Share
      Fig.60	Les Mills International Ltd Revenue and Growth Rate
      Fig.61	Les Mills International Ltd Market Share
      Fig.62	Sworkit Revenue and Growth Rate
      Fig.63	Sworkit Market Share
      Fig.64	Navigate Wellbeing Solutions Revenue and Growth Rate
      Fig.65	Navigate Wellbeing Solutions Market Share
      Fig.66	Peerfit Inc Revenue and Growth Rate
      Fig.67	Peerfit Inc Market Share
      Fig.68	Viva Leisure Revenue and Growth Rate
      Fig.69	Viva Leisure Market Share
      Fig.70	Wellbeats Inc Revenue and Growth Rate
      Fig.71	Wellbeats Inc Market Share
      Fig.72	Zwift Revenue and Growth Rate
      Fig.73	Zwift Market Share
      Fig.74	Csharter Fitness Inc Revenue and Growth Rate
      Fig.75	Csharter Fitness Inc Market Share
      Fig.76	Wexer Revenue and Growth Rate
      Fig.77	Wexer Market Share
      Fig.78	Fittr Revenue and Growth Rate
      Fig.79	Fittr Market Share
      Fig.80	MoveGB Revenue and Growth Rate
      Fig.81	MoveGB Market Share
      Fig.82	Market Dynamics
      Fig.83	Global Virtual Fitness – Value Chain Analysis
      Fig.84	Key Mandates and Regulations
      Fig.85	Technology Roadmap and Timeline
      Fig.86	Market Attractiveness Analysis – By Streaming Type
      Fig.87	Market Attractiveness Analysis – By Sessions
      Fig.88	Market Attractiveness Analysis – By Devices
      Fig.89	Market Attractiveness Analysis – By Revenue Model
      Fig.90	Market Attractiveness Analysis – By Region
      Fig.91	Virtual Fitness Industrial Chain Analysis
      Fig.92	Market Channels
      Fig.93	Marketing Channel Development Trend
      Fig.94	Growth in World Gross Product, 2008-2018
      

      List of Tables

      Table 1	Global Virtual Fitness Market, 2019 & 2026 (USD Million)
      Table 2	Global Virtual Fitness Market, by Streaming Type , 2016 – 2026 (USD Million)
      Table 3	Global Virtual Fitness Market, by Sessions, 2016 – 2026 (USD Million)
      Table 4	Global Virtual Fitness Market, by Devices, 2016 – 2026 (USD Million)
      Table 5	Global Virtual Fitness Market, by Revenue Model, 2016 – 2026 (USD Million)
      Table 6	Global Virtual Fitness Market, by Region, 2016 – 2026 (USD Million)
      Table 7	North America Virtual Fitness Market, by Country, 2016 – 2026 (USD Million)
      Table 8	North America Virtual Fitness Market, by Streaming Type , 2016 – 2026 (USD Million)
      Table 9	North America Virtual Fitness Market, by Sessions, 2016 – 2026 (USD Million)
      Table 10 North America Virtual Fitness Market, by Devices, 2016 – 2026 (USD Million)
      Table 11 North America Virtual Fitness Market, by Revenue Model, 2016 – 2026 (USD Million)
      Table 12 Europe Virtual Fitness Market, by Country, 2016 – 2026 (USD Million)
      Table 13 Europe Virtual Fitness Market, by Streaming Type , 2016 – 2026 (USD Million)
      Table 14 Europe Virtual Fitness Market, by Sessions, 2016 – 2026 (USD Million)
      Table 15 Europe Virtual Fitness Market, by Devices, 2016 – 2026 (USD Million)
      Table 16 Europe Virtual Fitness Market, by Revenue Model, 2016 – 2026 (USD Million)
      Table 17 Asia Pacific Virtual Fitness Market, by Country, 2016 – 2026 (USD Million)
      Table 18 Asia Pacific Virtual Fitness Market, by Streaming Type , 2016 – 2026 (USD Million)
      Table 19 Asia Pacific Virtual Fitness Market, by Sessions, 2016 – 2026 (USD Million)
      Table 20 Asia Pacific Virtual Fitness Market, by Devices, 2016 – 2026 (USD Million)
      Table 21 Asia Pacific Virtual Fitness Market, by Revenue Model, 2016 – 2026 (USD Million)
      Table 22 Latin America Virtual Fitness Market, by Country, 2016 – 2026 (USD Million)
      Table 23 Latin America Virtual Fitness Market, by Streaming Type , 2016 – 2026 (USD Million)
      Table 24 Latin America Virtual Fitness Market, by Sessions, 2016 – 2026 (USD Million)
      Table 25 Latin America Virtual Fitness Market, by Devices, 2016 – 2026 (USD Million)
      Table 26 Latin America Virtual Fitness Market, by Revenue Model, 2016 – 2026 (USD Million)
      Table 27 The Middle-East and Africa Virtual Fitness Market, by Country, 2016 – 2026 (USD Million)
      Table 28 The Middle-East and Africa Virtual Fitness Market, by Streaming Type , 2016 – 2026 (USD Million)
      Table 29 The Middle-East and Africa Virtual Fitness Market, by Sessions, 2016 – 2026 (USD Million)
      Table 30 The Middle-East and Africa Virtual Fitness Market, by Devices, 2016 – 2026 (USD Million)
      Table 31 The Middle-East and Africa Virtual Fitness Market, by Revenue Model, 2016 – 2026 (USD Million)
      Table 32 Global Virtual Fitness Market - Company Revenue Analysis, 2016 – 2019 (USD Million)
      Table 33 Global Virtual Fitness Market - Company Revenue Share Analysis, 2016 – 2019 (%)
      Table 34 Acquisitions and Mergers
      Table 35 Market Drivers – Impact Analysis
      Table 36 Market Restraints
      Table 37 Market Opportunities
      Table 38 Major Buyers of Virtual Fitness
      Table 39 Distributors/Traders of Virtual Fitness by Region
      

Industry Major Market Players

  • Fitbit Inc.
  • ClassPass Inc.
  • FitnessonDemand
  • Peloton
  • Wellbeats Inc.
  • REH-FIT
  • Les Mills International Ltd.
  • Sworkit
  • Navigate Wellbeing Solutions
  • Peerfit Inc.
  • Viva Leisure
  • Wellbeats Inc.
  • Zwift
  • Csharter Fitness Inc.
  • Wexer
  • Fittr
  • MoveGB