Search Market Research Report

Discover Our Latest Reports
Discover Our Featured Reports
Discover Top Selling Reports

Third-Party Optical Transceivers Market Size, Share Global Analysis Report, 2026 - 2034-

report img

Third-Party Optical Transceivers Market Size, Share, Growth Analysis Report By Form Factor (SFP, SFP+, QSFP/QSFP+, XFP, CFP, and Others), By Data Rate (Up to 10 Gbps, 10–40 Gbps, 41–100 Gbps, Above 100 Gbps), By Application (Data Centers, Telecommunication, Enterprise Networks, Cloud Providers, Wireless Networks, and Others), By End-User (IT & Telecom, BFSI, Government, Education, Healthcare, and Others), and By Region - Global Industry Insights, Overview, Comprehensive Analysis, Trends, Statistical Research, Market Intelligence, Historical Data and Forecast 2026 - 2034-

Industry Insights

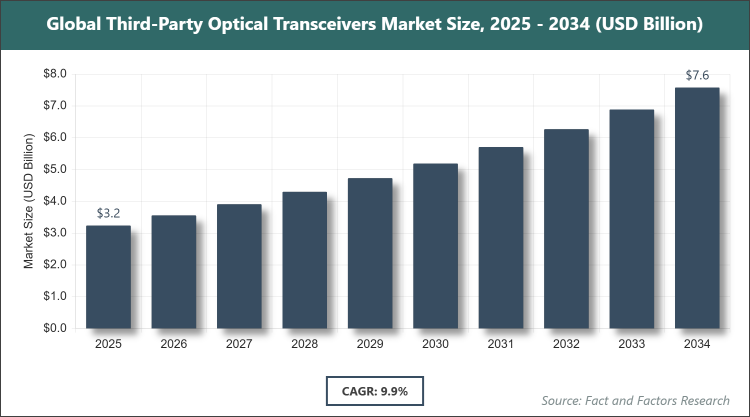
[238+ Pages Report] According to Facts & Factors, the global Third-Party Optical Transceivers market size was estimated at USD 3.24 billion in 2025 and is expected to reach USD 8.33 billion by the end of 2034. The Third-Party Optical Transceivers industry is anticipated to grow by a CAGR of 9.9% between 2026 and 2034. The Third-Party Optical Transceivers Market is driven by escalating demand for cost-effective high-speed data transmission solutions.

Global Third-Party Optical Transceivers Market Size

To know more about this report | Request Free Sample Copy

logoMarket Overview

Third-party optical transceivers refer to compatible networking modules produced by vendors other than original equipment manufacturers, enabling data transmission over fiber optic networks at reduced costs while meeting industry standards for interoperability and performance in applications such as data centers, telecommunications, and enterprise networks, without incorporating quantitative data in this foundational description.

logoKey Insights

  • As per the analysis shared by our research analyst, the global Third-Party Optical Transceivers market is estimated to grow annually at a CAGR of around 9.9% over the forecast period (2026-2034).
  • In terms of revenue, the global Third-Party Optical Transceivers market size was valued at around USD 3.24 billion in 2025 and is projected to reach USD 8.33 billion by 2034.
  • The market is driven by rising adoption of cloud computing and 5G networks requiring high-bandwidth solutions.
  • Based on the Form Factor, the QSFP/QSFP+ segment dominated the market in 2025 with a share of 44%, due to its support for high-speed data rates in data centers and telecom applications.
  • Based on the Data Rate, the Above 100 Gbps segment dominated the market in 2025 with a share of over 35%, attributed to the surge in demand for ultra-high-speed connectivity in AI and cloud infrastructures.
  • Based on the Application, the Data Centers segment dominated the market in 2025 with a share of over 40%, owing to the expansion of hyperscale facilities and need for efficient interconnects.
  • Based on the End-User, the IT & Telecom segment dominated the market in 2025 with a share of around 45%, driven by rapid 5G deployments and network upgrades.
  • Based on the region, Asia Pacific dominated the market in 2025 with a share of around 40%, fueled by rapid digital transformation and massive investments in telecom infrastructure in countries like China and India.

logoGrowth Drivers

  • Rising Demand for High-Speed Data Transmission

The relentless push for higher bandwidth in data centers and telecommunications networks is a primary catalyst, as third-party transceivers offer affordable alternatives to OEM products while supporting advanced speeds like 400G and beyond. This affordability enables broader adoption among small to medium enterprises, facilitating seamless upgrades to fiber optic infrastructures without prohibitive costs.

Technological advancements in transceiver design, such as improved compatibility and energy efficiency, further accelerate market penetration, allowing integration into diverse network environments and supporting the global shift towards digital economies reliant on real-time data exchange.

logoRestraints

  • Compatibility and Warranty Concerns

Potential interoperability issues with proprietary equipment from major vendors can hinder adoption, as network operators fear voided warranties or system failures, leading to reluctance in shifting from OEM solutions. This uncertainty often results in extended evaluation periods and increased testing costs, slowing market expansion.

Supply chain vulnerabilities, including component shortages and geopolitical tensions affecting raw material availability, compound these issues, potentially causing delays in deployment and elevating prices, which disproportionately impact budget-conscious buyers in emerging markets.

logoOpportunities

  • Expansion of 5G and Cloud Infrastructure

The global rollout of 5G networks and the proliferation of cloud services create avenues for third-party transceivers to fill gaps in high-volume deployments, offering scalable, cost-effective options for operators expanding coverage. Innovations in multi-vendor compatibility open doors for partnerships and custom solutions tailored to specific regional needs.

Sustainability trends favoring energy-efficient optics align with environmental regulations, positioning third-party providers to capture market share through eco-friendly designs that reduce power consumption in large-scale installations, attracting environmentally conscious enterprises.

logoChallenges

  • Stringent Regulatory and Quality Standards

Compliance with international standards for performance and safety poses significant hurdles, as varying regional regulations require extensive certification processes that increase operational costs for manufacturers. Failure to meet these can lead to market exclusion or legal repercussions, particularly in highly regulated sectors like healthcare and government.

Intensifying competition from OEMs, enhancing their own compatible line,s threatens market share, while intellectual property disputes over transceiver coding and firmware could result in litigation, diverting resources from innovation and growth initiatives.

logoReport Scope

Report Attribute

Details

Market Size 2025

USD 3.24 Billion

Projected Market Size in 2034

USD 8.33 Billion

CAGR Growth Rate

9.9% CAGR

Base Year

2025

Forecast Years

2026-2034

Key Market Players

Finisar Corporation, Cisco Systems Inc., Lumentum Holdings Inc., Juniper Networks Inc., Mellanox Technologies, Sumitomo Electric Industries Ltd., Accelink Technologies Co. Ltd., Foxconn Interconnect Technology, Hisense Broadband Multimedia Technologies Co. Ltd., Source Photonics Inc., and Others.

Key Segment

By Form Factor, By Data Rate, By Application, By End-User, and By Region

Major Regions Covered

North America, Europe, Asia Pacific, Latin America, and the Middle East & Africa

Purchase Options

Request customized purchase options to meet your research needs. Explore purchase options

logoMarket Segmentation

The Third-Party Optical Transceivers market is segmented by form factor, data rate, application, end-user, and region.

Based on Form Factor Segment, the Third-Party Optical Transceivers market is divided into SFP, SFP+, QSFP/QSFP+, XFP, CFP, and Others. The most dominant segment is QSFP/QSFP+, holding over 44% share, due to its ability to handle high-density, high-speed connections essential for modern data centers, driving the market by enabling efficient scaling of bandwidth-intensive applications like AI and video streaming; the second most dominant is SFP/SFP+, appreciated for its versatility in enterprise and telecom networks, contributing to growth through cost-effective upgrades in legacy systems and support for diverse transmission distances.

Based on Data Rate Segment, the Third-Party Optical Transceivers market is divided into Up to 10 Gbps, 10–40 Gbps, 41–100 Gbps, and Above 100 Gbps. The most dominant segment is Above 100 Gbps, with over 35% share, as it caters to the exploding need for ultra-fast data transfer in hyperscale environments, propelling the market forward by facilitating advanced technologies such as 5G and cloud computing; the second most dominant is 41–100 Gbps, which balances performance and cost for mid-tier applications, aiding market expansion through widespread adoption in enterprise networking and metro access.

Based on Application Segment, the Third-Party Optical Transceivers market is divided into Data Centers, Telecommunication, Enterprise Networks, Cloud Providers, Wireless Networks, and Others. The most dominant segment is Data Centers, capturing over 40% share, owing to the surge in global data traffic and need for high-performance interconnects, fueling market growth by supporting efficient, scalable infrastructure for big data and AI workloads; the second most dominant is Telecommunication, driven by 5G expansions requiring reliable high-speed links, advancing the market through enhanced connectivity in mobile and broadband services.

Based on End-User Segment, the Third-Party Optical Transceivers market is divided into IT & Telecom, BFSI, Government, Education, Healthcare, and Others. The most dominant segment is IT & Telecom, with around 45% share, due to its critical role in enabling seamless data transmission for network operators, driving the market by meeting the demands of digital transformation and high-speed internet; the second most dominant is BFSI, where secure and fast data handling is paramount, contributing to growth through applications in financial transactions and data security.

logoRecent Developments

  • In November 2023, Lumentum Operations LLC acquired Cloud Light Technology Limited for approximately USD 750 million, enhancing its capabilities in high-speed optical modules for cloud data centers.
  • In September 2023, Tower Semiconductor and InnoLight Technology collaborated to develop multi-generation high-speed optical transceivers using Tower’s Silicon Photonics platform.
  • In March 2023, Eoptolink Technology Inc., Ltd. launched Multimode BIDI Transceivers in 100G, 400G, and 800G versions, facilitating upgrades without replacing existing fiber infrastructure.
  • In 2023, Amphenol ICC acquired Finisar Corporation, strengthening its portfolio in optical components and modules.

logoRegional Analysis

  • Asia Pacific to dominate the global market

Asia Pacific emerges as a frontrunner in the third-party optical transceivers arena, bolstered by expansive telecommunications growth and a thriving e-commerce sector that demands robust data handling capabilities. China stands out as the dominating country, with its massive investments in 5G infrastructure and data center expansions fueling innovation and adoption of cost-effective transceiver solutions. The region's dynamic tech ecosystem, coupled with supportive government policies promoting digital connectivity, creates a fertile ground for market players to explore diverse applications from urban broadband to rural network enhancements.

North America maintains a strong foothold through its advanced technological landscape and emphasis on high-performance networking, with the United States leading as the dominating country via its concentration of hyperscale data centers and cutting-edge R&D facilities. This area thrives on a culture of innovation, where enterprises prioritize scalable and interoperable solutions to support cloud computing and AI-driven operations.

Europe exhibits resilience with its focus on regulatory compliance and sustainable practices, positioning Germany as the dominating country through its engineering prowess and commitment to high-quality manufacturing standards. The continent's integrated approach to digital infrastructure underscores a balanced strategy encompassing both traditional telecom and emerging IoT applications.

Latin America is gaining momentum amid increasing digital inclusion efforts and foreign investments, with Brazil as the dominating country leveraging its large population and growing tech hubs to advance network capabilities. This region capitalizes on economic diversification to bridge connectivity gaps in urban and remote areas alike.

The Middle East & Africa region is progressively advancing, driven by strategic infrastructure projects and oil-rich economies transitioning to digital diversification, with the United Arab Emirates leading as the dominating country through its visionary smart city initiatives and global trade connectivity. This area focuses on harnessing transceiver technologies to support expansive wireless networks and enterprise solutions.

logoCompetitive Analysis

The global Third-Party Optical Transceivers market is dominated by players:

  • Finisar Corporation
  • Cisco Systems Inc.
  • Lumentum Holdings Inc.
  • Juniper Networks Inc.
  • Mellanox Technologies
  • Sumitomo Electric Industries Ltd.
  • Accelink Technologies Co. Ltd.
  • Foxconn Interconnect Technology
  • Hisense Broadband Multimedia Technologies Co. Ltd.
  • Source Photonics Inc.

The global Third-Party Optical Transceivers market is segmented as follows:

logoBy Form Factor

  • SFP
  • SFP+
  • QSFP/QSFP+
  • XFP
  • CFP
  • Others

logoBy Data Rate

  • Up to 10 Gbps
  • 10–40 Gbps
  • 41–100 Gbps
  • Above 100 Gbps

logoBy Application

  • Data Centers
  • Telecommunication
  • Enterprise Networks
  • Cloud Providers
  • Wireless Networks
  • Others

logoBy End-User

  • IT & Telecom
  • BFSI
  • Government
  • Education
  • Healthcare
  • Others

logoBy Region

  • North America
    • The U.S.
    • Canada
    • Mexico
  • Europe
    • France
    • The UK
    • Spain
    • Germany
    • Italy
    • Rest of Europe
  • Asia Pacific
    • China
    • Japan
    • India
    • Australia
    • Southeast Asia
    • Rest of Asia Pacific
  • The Middle East & Africa
    • Saudi Arabia
    • UAE
    • Egypt
    • Kuwait
    • South Africa
    • Rest of the Middle East & Africa
  • Latin America
    • Brazil
    • Argentina
    • Rest of Latin America

Table of Content

  • Chapter 1. Preface
    • 1.1 Report Description and Scope
    • 1.2 Research Scope
    • 1.3 Research Methodology
      • 1.3.1 Market Research Type
      • 1.3.2 Market Research Methodology
  • Chapter 2. Executive Summary
    • 2.1 Global Third-Party Optical Transceivers Market, (2026 - 2034) (USD Billion)
    • 2.2 Global Third-Party Optical Transceivers Market: Snapshot
  • Chapter 3. Global Third-Party Optical Transceivers Market - Industry Analysis
    • 3.1 Third-Party Optical Transceivers Market: Market Dynamics
    • 3.2 Market Drivers
      • 3.2.1 Rising Demand for High-Speed Data Transmission
    • 3.3 Market Restraints
      • 3.3.1. Compatibility and Warranty Concerns
    • 3.4 Market Opportunities
      • 3.4.1. Expansion of 5G and Cloud Infrastructure
    • 3.5 Market Challenges
      • 3.5.1. Stringent Regulatory and Quality Standards
    • 3.6 Porter’s Five Forces Analysis
    • 3.7 Market Attractiveness Analysis
      • 3.7.1 Market Attractiveness Analysis By Form Factor
      • 3.7.2 Market Attractiveness Analysis By Data Rate
      • 3.7.3 Market Attractiveness Analysis By Application
      • 3.7.4 Market Attractiveness Analysis By End-User
  • Chapter 4. Global Third-Party Optical Transceivers Market- Competitive Landscape
    • 4.1 Company Market Share Analysis
      • 4.1.1 Global Third-Party Optical Transceivers Market: Company Market Share, 2025
    • 4.2 Strategic Development
      • 4.2.1 Acquisitions & Mergers
      • 4.2.2 New Product Launches
      • 4.2.3 Agreements, Partnerships, Collaborations, and Joint Ventures
      • 4.2.4 Research and Development and Regional Expansion
    • 4.3 Price Trend Analysis
  • Chapter 5. Global Third-Party Optical Transceivers Market - By Form Factor Segment Analysis
    • 5.1 Global Third-Party Optical Transceivers Market Overview: By Form Factor
      • 5.1.1 Global Third-Party Optical Transceivers Market Share, By Form Factor, 2025 and 2034
    • 5.2 SFP
      • 5.2.1 Global Third-Party Optical Transceivers Market by SFP, 2026 - 2034 (USD Billion)
    • 5.3 SFP+
      • 5.3.1 Global Third-Party Optical Transceivers Market by SFP+, 2026 - 2034 (USD Billion)
    • 5.4 QSFP/QSFP+
      • 5.4.1 Global Third-Party Optical Transceivers Market by QSFP/QSFP+, 2026 - 2034 (USD Billion)
    • 5.5 XFP
      • 5.5.1 Global Third-Party Optical Transceivers Market by XFP, 2026 - 2034 (USD Billion)
    • 5.6 CFP
      • 5.6.1 Global Third-Party Optical Transceivers Market by CFP, 2026 - 2034 (USD Billion)
    • 5.7 Others
      • 5.7.1 Global Third-Party Optical Transceivers Market by Others, 2026 - 2034 (USD Billion)
  • Chapter 6. Global Third-Party Optical Transceivers Market - By Data Rate Segment Analysis
    • 6.1 Global Third-Party Optical Transceivers Market Overview: By Data Rate
      • 6.1.1 Global Third-Party Optical Transceivers Market Share, By Data Rate, 2025 and 2034
    • 6.2 Up to 10 Gbps
      • 6.2.1 Global Third-Party Optical Transceivers Market by Up to 10 Gbps, 2026 - 2034 (USD Billion)
    • 6.3 10–40 Gbps
      • 6.3.1 Global Third-Party Optical Transceivers Market by 10–40 Gbps, 2026 - 2034 (USD Billion)
    • 6.4 41–100 Gbps
      • 6.4.1 Global Third-Party Optical Transceivers Market by 41–100 Gbps, 2026 - 2034 (USD Billion)
    • 6.5 Above 100 Gbps
      • 6.5.1 Global Third-Party Optical Transceivers Market by Above 100 Gbps, 2026 - 2034 (USD Billion)
  • Chapter 7. Global Third-Party Optical Transceivers Market - By Application Segment Analysis
    • 7.1 Global Third-Party Optical Transceivers Market Overview: By Application
      • 7.1.1 Global Third-Party Optical Transceivers Market Share, By Application, 2025 and 2034
    • 7.2 Data Centers
      • 7.2.1 Global Third-Party Optical Transceivers Market by Data Centers, 2026 - 2034 (USD Billion)
    • 7.3 Telecommunication
      • 7.3.1 Global Third-Party Optical Transceivers Market by Telecommunication, 2026 - 2034 (USD Billion)
    • 7.4 Enterprise Networks
      • 7.4.1 Global Third-Party Optical Transceivers Market by Enterprise Networks, 2026 - 2034 (USD Billion)
    • 7.5 Cloud Providers
      • 7.5.1 Global Third-Party Optical Transceivers Market by Cloud Providers, 2026 - 2034 (USD Billion)
    • 7.6 Wireless Networks
      • 7.6.1 Global Third-Party Optical Transceivers Market by Wireless Networks, 2026 - 2034 (USD Billion)
    • 7.7 Others
      • 7.7.1 Global Third-Party Optical Transceivers Market by Others, 2026 - 2034 (USD Billion)
  • Chapter 8. Global Third-Party Optical Transceivers Market - By End-User Segment Analysis
    • 8.1 Global Third-Party Optical Transceivers Market Overview: By End-User
      • 8.1.1 Global Third-Party Optical Transceivers Market Share, By End-User, 2025 and 2034
    • 8.2 IT & Telecom
      • 8.2.1 Global Third-Party Optical Transceivers Market by IT & Telecom, 2026 - 2034 (USD Billion)
    • 8.3 BFSI
      • 8.3.1 Global Third-Party Optical Transceivers Market by BFSI, 2026 - 2034 (USD Billion)
    • 8.4 Government
      • 8.4.1 Global Third-Party Optical Transceivers Market by Government, 2026 - 2034 (USD Billion)
    • 8.5 Education
      • 8.5.1 Global Third-Party Optical Transceivers Market by Education, 2026 - 2034 (USD Billion)
    • 8.6 Healthcare
      • 8.6.1 Global Third-Party Optical Transceivers Market by Healthcare, 2026 - 2034 (USD Billion)
    • 8.7 Others
      • 8.7.1 Global Third-Party Optical Transceivers Market by Others, 2026 - 2034 (USD Billion)
  • Chapter 9. Third-Party Optical Transceivers Market - Regional Analysis
    • 9.1 Global Third-Party Optical Transceivers Market Regional Overview
    • 9.2 Global Third-Party Optical Transceivers Market Share, by Region, 2025 & 2034 (USD Billion)
    • 9.3. North America
      • 9.3.1 North America Third-Party Optical Transceivers Market, 2026 - 2034 (USD Billion)
        • 9.3.1.1 North America Third-Party Optical Transceivers Market, by Country, 2026 - 2034 (USD Billion)
    • 9.4 North America Third-Party Optical Transceivers Market, by Form Factor, 2026 - 2034
      • 9.4.1 North America Third-Party Optical Transceivers Market, by Form Factor, 2026 - 2034 (USD Billion)
    • 9.5 North America Third-Party Optical Transceivers Market, by Data Rate, 2026 - 2034
      • 9.5.1 North America Third-Party Optical Transceivers Market, by Data Rate, 2026 - 2034 (USD Billion)
    • 9.6 North America Third-Party Optical Transceivers Market, by Application, 2026 - 2034
      • 9.6.1 North America Third-Party Optical Transceivers Market, by Application, 2026 - 2034 (USD Billion)
    • 9.7 North America Third-Party Optical Transceivers Market, by End-User, 2026 - 2034
      • 9.7.1 North America Third-Party Optical Transceivers Market, by End-User, 2026 - 2034 (USD Billion)
    • 9.8. Europe
      • 9.8.1 Europe Third-Party Optical Transceivers Market, 2026 - 2034 (USD Billion)
        • 9.8.1.1 Europe Third-Party Optical Transceivers Market, by Country, 2026 - 2034 (USD Billion)
    • 9.9 Europe Third-Party Optical Transceivers Market, by Form Factor, 2026 - 2034
      • 9.9.1 Europe Third-Party Optical Transceivers Market, by Form Factor, 2026 - 2034 (USD Billion)
    • 9.10 Europe Third-Party Optical Transceivers Market, by Data Rate, 2026 - 2034
      • 9.10.1 Europe Third-Party Optical Transceivers Market, by Data Rate, 2026 - 2034 (USD Billion)
    • 9.11 Europe Third-Party Optical Transceivers Market, by Application, 2026 - 2034
      • 9.11.1 Europe Third-Party Optical Transceivers Market, by Application, 2026 - 2034 (USD Billion)
    • 9.12 Europe Third-Party Optical Transceivers Market, by End-User, 2026 - 2034
      • 9.12.1 Europe Third-Party Optical Transceivers Market, by End-User, 2026 - 2034 (USD Billion)
    • 9.13. Asia Pacific
      • 9.13.1 Asia Pacific Third-Party Optical Transceivers Market, 2026 - 2034 (USD Billion)
        • 9.13.1.1 Asia Pacific Third-Party Optical Transceivers Market, by Country, 2026 - 2034 (USD Billion)
    • 9.14 Asia Pacific Third-Party Optical Transceivers Market, by Form Factor, 2026 - 2034
      • 9.14.1 Asia Pacific Third-Party Optical Transceivers Market, by Form Factor, 2026 - 2034 (USD Billion)
    • 9.15 Asia Pacific Third-Party Optical Transceivers Market, by Data Rate, 2026 - 2034
      • 9.15.1 Asia Pacific Third-Party Optical Transceivers Market, by Data Rate, 2026 - 2034 (USD Billion)
    • 9.16 Asia Pacific Third-Party Optical Transceivers Market, by Application, 2026 - 2034
      • 9.16.1 Asia Pacific Third-Party Optical Transceivers Market, by Application, 2026 - 2034 (USD Billion)
    • 9.17 Asia Pacific Third-Party Optical Transceivers Market, by End-User, 2026 - 2034
      • 9.17.1 Asia Pacific Third-Party Optical Transceivers Market, by End-User, 2026 - 2034 (USD Billion)
    • 9.18. Latin America
      • 9.18.1 Latin America Third-Party Optical Transceivers Market, 2026 - 2034 (USD Billion)
        • 9.18.1.1 Latin America Third-Party Optical Transceivers Market, by Country, 2026 - 2034 (USD Billion)
    • 9.19 Latin America Third-Party Optical Transceivers Market, by Form Factor, 2026 - 2034
      • 9.19.1 Latin America Third-Party Optical Transceivers Market, by Form Factor, 2026 - 2034 (USD Billion)
    • 9.20 Latin America Third-Party Optical Transceivers Market, by Data Rate, 2026 - 2034
      • 9.20.1 Latin America Third-Party Optical Transceivers Market, by Data Rate, 2026 - 2034 (USD Billion)
    • 9.21 Latin America Third-Party Optical Transceivers Market, by Application, 2026 - 2034
      • 9.21.1 Latin America Third-Party Optical Transceivers Market, by Application, 2026 - 2034 (USD Billion)
    • 9.22 Latin America Third-Party Optical Transceivers Market, by End-User, 2026 - 2034
      • 9.22.1 Latin America Third-Party Optical Transceivers Market, by End-User, 2026 - 2034 (USD Billion)
    • 9.23. The Middle-East and Africa
      • 9.23.1 The Middle-East and Africa Third-Party Optical Transceivers Market, 2026 - 2034 (USD Billion)
        • 9.23.1.1 The Middle-East and Africa Third-Party Optical Transceivers Market, by Country, 2026 - 2034 (USD Billion)
    • 9.24 The Middle-East and Africa Third-Party Optical Transceivers Market, by Form Factor, 2026 - 2034
      • 9.24.1 The Middle-East and Africa Third-Party Optical Transceivers Market, by Form Factor, 2026 - 2034 (USD Billion)
    • 9.25 The Middle-East and Africa Third-Party Optical Transceivers Market, by Data Rate, 2026 - 2034
      • 9.25.1 The Middle-East and Africa Third-Party Optical Transceivers Market, by Data Rate, 2026 - 2034 (USD Billion)
    • 9.26 The Middle-East and Africa Third-Party Optical Transceivers Market, by Application, 2026 - 2034
      • 9.26.1 The Middle-East and Africa Third-Party Optical Transceivers Market, by Application, 2026 - 2034 (USD Billion)
    • 9.27 The Middle-East and Africa Third-Party Optical Transceivers Market, by End-User, 2026 - 2034
      • 9.27.1 The Middle-East and Africa Third-Party Optical Transceivers Market, by End-User, 2026 - 2034 (USD Billion)
  • Chapter 10. Company Profiles
    • 10.1 Finisar Corporation
      • 10.1.1 Overview
      • 10.1.2 Financials
      • 10.1.3 Product Portfolio
      • 10.1.4 Business Strategy
      • 10.1.5 Recent Developments
    • 10.2 Cisco Systems Inc.
      • 10.2.1 Overview
      • 10.2.2 Financials
      • 10.2.3 Product Portfolio
      • 10.2.4 Business Strategy
      • 10.2.5 Recent Developments
    • 10.3 Lumentum Holdings Inc.
      • 10.3.1 Overview
      • 10.3.2 Financials
      • 10.3.3 Product Portfolio
      • 10.3.4 Business Strategy
      • 10.3.5 Recent Developments
    • 10.4 Juniper Networks Inc.
      • 10.4.1 Overview
      • 10.4.2 Financials
      • 10.4.3 Product Portfolio
      • 10.4.4 Business Strategy
      • 10.4.5 Recent Developments
    • 10.5 Mellanox Technologies
      • 10.5.1 Overview
      • 10.5.2 Financials
      • 10.5.3 Product Portfolio
      • 10.5.4 Business Strategy
      • 10.5.5 Recent Developments
    • 10.6 Sumitomo Electric Industries Ltd.
      • 10.6.1 Overview
      • 10.6.2 Financials
      • 10.6.3 Product Portfolio
      • 10.6.4 Business Strategy
      • 10.6.5 Recent Developments
    • 10.7 Accelink Technologies Co. Ltd.
      • 10.7.1 Overview
      • 10.7.2 Financials
      • 10.7.3 Product Portfolio
      • 10.7.4 Business Strategy
      • 10.7.5 Recent Developments
    • 10.8 Foxconn Interconnect Technology
      • 10.8.1 Overview
      • 10.8.2 Financials
      • 10.8.3 Product Portfolio
      • 10.8.4 Business Strategy
      • 10.8.5 Recent Developments
    • 10.9 Hisense Broadband Multimedia Technologies Co. Ltd.
      • 10.9.1 Overview
      • 10.9.2 Financials
      • 10.9.3 Product Portfolio
      • 10.9.4 Business Strategy
      • 10.9.5 Recent Developments
    • 10.10 Source Photonics Inc.
      • 10.10.1 Overview
      • 10.10.2 Financials
      • 10.10.3 Product Portfolio
      • 10.10.4 Business Strategy
      • 10.10.5 Recent Developments

List of Figures

  • 1. Market Research Type
  • 2. Market Research Methodology
  • 3. Global Third-Party Optical Transceivers Market, 2026 - 2034 (USD Billion)
  • 4. Porter’s Five Forces Analysis
  • 5. Global Third-Party Optical Transceivers Market Attractiveness, By Form Factor
  • 6. Global Third-Party Optical Transceivers Market Attractiveness, By Data Rate
  • 7. Global Third-Party Optical Transceivers Market Attractiveness, By Application
  • 8. Global Third-Party Optical Transceivers Market Attractiveness, By End-User
  • 9. Global Third-Party Optical Transceivers Market Share by Form Factor, 2026 and 2034 (USD Billion)
  • 10. Global Third-Party Optical Transceivers Market by SFP, 2026 - 2034 (USD Billion)
  • 11. Global Third-Party Optical Transceivers Market by SFP+, 2026 - 2034 (USD Billion)
  • 12. Global Third-Party Optical Transceivers Market by QSFP/QSFP+, 2026 - 2034 (USD Billion)
  • 13. Global Third-Party Optical Transceivers Market by XFP, 2026 - 2034 (USD Billion)
  • 14. Global Third-Party Optical Transceivers Market by CFP, 2026 - 2034 (USD Billion)
  • 15. Global Third-Party Optical Transceivers Market by Others, 2026 - 2034 (USD Billion)
  • 16. Global Third-Party Optical Transceivers Market Share by Data Rate, 2026 and 2034 (USD Billion)
  • 17. Global Third-Party Optical Transceivers Market by Up to 10 Gbps, 2026 - 2034 (USD Billion)
  • 18. Global Third-Party Optical Transceivers Market by 10–40 Gbps, 2026 - 2034 (USD Billion)
  • 19. Global Third-Party Optical Transceivers Market by 41–100 Gbps, 2026 - 2034 (USD Billion)
  • 20. Global Third-Party Optical Transceivers Market by Above 100 Gbps, 2026 - 2034 (USD Billion)
  • 21. Global Third-Party Optical Transceivers Market Share by Application, 2026 and 2034 (USD Billion)
  • 22. Global Third-Party Optical Transceivers Market by Data Centers, 2026 - 2034 (USD Billion)
  • 23. Global Third-Party Optical Transceivers Market by Telecommunication, 2026 - 2034 (USD Billion)
  • 24. Global Third-Party Optical Transceivers Market by Enterprise Networks, 2026 - 2034 (USD Billion)
  • 25. Global Third-Party Optical Transceivers Market by Cloud Providers, 2026 - 2034 (USD Billion)
  • 26. Global Third-Party Optical Transceivers Market by Wireless Networks, 2026 - 2034 (USD Billion)
  • 27. Global Third-Party Optical Transceivers Market by Others, 2026 - 2034 (USD Billion)
  • 28. Global Third-Party Optical Transceivers Market Share by End-User, 2026 and 2034 (USD Billion)
  • 29. Global Third-Party Optical Transceivers Market by IT & Telecom, 2026 - 2034 (USD Billion)
  • 30. Global Third-Party Optical Transceivers Market by BFSI, 2026 - 2034 (USD Billion)
  • 31. Global Third-Party Optical Transceivers Market by Government, 2026 - 2034 (USD Billion)
  • 32. Global Third-Party Optical Transceivers Market by Education, 2026 - 2034 (USD Billion)
  • 33. Global Third-Party Optical Transceivers Market by Healthcare, 2026 - 2034 (USD Billion)
  • 34. Global Third-Party Optical Transceivers Market by Others, 2026 - 2034 (USD Billion)
  • 35. Global Third-Party Optical Transceivers Market Share, by Region, 2026 and 2034
  • 36. North America Third-Party Optical Transceivers Market, 2026 - 2034 (USD Billion)
  • 37. Europe Third-Party Optical Transceivers Market, 2026 - 2034 (USD Billion)
  • 38. Asia Pacific Third-Party Optical Transceivers Market, 2026 - 2034 (USD Billion)
  • 39. Latin America Third-Party Optical Transceivers Market, 2026 - 2034 (USD Billion)
  • 40. The Middle-East and Africa Third-Party Optical Transceivers Market, 2026 - 2034 (USD Billion)

List of Tables

  • 1. Global Third-Party Optical Transceivers Market: Snapshot
  • 2. Drivers of the Third-Party Optical Transceivers Market: Impact Analysis
  • 3. North America Third-Party Optical Transceivers Market Revenue, By Form Factor, 2026 - 2034 (USD Billion)
  • 4. North America Third-Party Optical Transceivers Market Revenue, By Data Rate, 2026 - 2034 (USD Billion)
  • 5. North America Third-Party Optical Transceivers Market Revenue, By Application, 2026 - 2034 (USD Billion)
  • 6. North America Third-Party Optical Transceivers Market Revenue, By End-User, 2026 - 2034 (USD Billion)
  • 7. U.S. Third-Party Optical Transceivers Market Revenue, By Form Factor, 2026 - 2034 (USD Billion)
  • 8. U.S. Third-Party Optical Transceivers Market Revenue, By Data Rate, 2026 - 2034 (USD Billion)
  • 9. U.S. Third-Party Optical Transceivers Market Revenue, By Application, 2026 - 2034 (USD Billion)
  • 10. U.S. Third-Party Optical Transceivers Market Revenue, By End-User, 2026 - 2034 (USD Billion)
  • 11. Canada Third-Party Optical Transceivers Market Revenue, By Form Factor, 2026 - 2034 (USD Billion)
  • 12. Canada Third-Party Optical Transceivers Market Revenue, By Data Rate, 2026 - 2034 (USD Billion)
  • 13. Canada Third-Party Optical Transceivers Market Revenue, By Application, 2026 - 2034 (USD Billion)
  • 14. Canada Third-Party Optical Transceivers Market Revenue, By End-User, 2026 - 2034 (USD Billion)
  • 15. Europe Third-Party Optical Transceivers Market Revenue, By Form Factor, 2026 - 2034 (USD Billion)
  • 16. Europe Third-Party Optical Transceivers Market Revenue, By Data Rate, 2026 - 2034 (USD Billion)
  • 17. Europe Third-Party Optical Transceivers Market Revenue, By Application, 2026 - 2034 (USD Billion)
  • 18. Europe Third-Party Optical Transceivers Market Revenue, By End-User, 2026 - 2034 (USD Billion)
  • 19. Germany Third-Party Optical Transceivers Market Revenue, By Form Factor, 2026 - 2034 (USD Billion)
  • 20. Germany Third-Party Optical Transceivers Market Revenue, By Data Rate, 2026 - 2034 (USD Billion)
  • 21. Germany Third-Party Optical Transceivers Market Revenue, By Application, 2026 - 2034 (USD Billion)
  • 22. Germany Third-Party Optical Transceivers Market Revenue, By End-User, 2026 - 2034 (USD Billion)
  • 23. France Third-Party Optical Transceivers Market Revenue, By Form Factor, 2026 - 2034 (USD Billion)
  • 24. France Third-Party Optical Transceivers Market Revenue, By Data Rate, 2026 - 2034 (USD Billion)
  • 25. France Third-Party Optical Transceivers Market Revenue, By Application, 2026 - 2034 (USD Billion)
  • 26. France Third-Party Optical Transceivers Market Revenue, By End-User, 2026 - 2034 (USD Billion)
  • 27. U.K. Third-Party Optical Transceivers Market Revenue, By Form Factor, 2026 - 2034 (USD Billion)
  • 28. U.K. Third-Party Optical Transceivers Market Revenue, By Data Rate, 2026 - 2034 (USD Billion)
  • 29. U.K. Third-Party Optical Transceivers Market Revenue, By Application, 2026 - 2034 (USD Billion)
  • 30. U.K. Third-Party Optical Transceivers Market Revenue, By End-User, 2026 - 2034 (USD Billion)
  • 31. Italy Third-Party Optical Transceivers Market Revenue, By Form Factor, 2026 - 2034 (USD Billion)
  • 32. Italy Third-Party Optical Transceivers Market Revenue, By Data Rate, 2026 - 2034 (USD Billion)
  • 33. Italy Third-Party Optical Transceivers Market Revenue, By Application, 2026 - 2034 (USD Billion)
  • 34. Italy Third-Party Optical Transceivers Market Revenue, By End-User, 2026 - 2034 (USD Billion)
  • 35. Spain Third-Party Optical Transceivers Market Revenue, By Form Factor, 2026 - 2034 (USD Billion)
  • 36. Spain Third-Party Optical Transceivers Market Revenue, By Data Rate, 2026 - 2034 (USD Billion)
  • 37. Spain Third-Party Optical Transceivers Market Revenue, By Application, 2026 - 2034 (USD Billion)
  • 38. Spain Third-Party Optical Transceivers Market Revenue, By End-User, 2026 - 2034 (USD Billion)
  • 39. Rest of Europe Third-Party Optical Transceivers Market Revenue, By Form Factor, 2026 - 2034 (USD Billion)
  • 40. Rest of Europe Third-Party Optical Transceivers Market Revenue, By Data Rate, 2026 - 2034 (USD Billion)
  • 41. Rest of Europe Third-Party Optical Transceivers Market Revenue, By Application, 2026 - 2034 (USD Billion)
  • 42. Rest of Europe Third-Party Optical Transceivers Market Revenue, By End-User, 2026 - 2034 (USD Billion)
  • 43. Asia Pacific Third-Party Optical Transceivers Market Revenue, By Form Factor, 2026 - 2034 (USD Billion)
  • 44. Asia Pacific Third-Party Optical Transceivers Market Revenue, By Data Rate, 2026 - 2034 (USD Billion)
  • 45. Asia Pacific Third-Party Optical Transceivers Market Revenue, By Application, 2026 - 2034 (USD Billion)
  • 46. Asia Pacific Third-Party Optical Transceivers Market Revenue, By End-User, 2026 - 2034 (USD Billion)
  • 47. China Third-Party Optical Transceivers Market Revenue, By Form Factor, 2026 - 2034 (USD Billion)
  • 48. China Third-Party Optical Transceivers Market Revenue, By Data Rate, 2026 - 2034 (USD Billion)
  • 49. China Third-Party Optical Transceivers Market Revenue, By Application, 2026 - 2034 (USD Billion)
  • 50. China Third-Party Optical Transceivers Market Revenue, By End-User, 2026 - 2034 (USD Billion)
  • 51. Japan Third-Party Optical Transceivers Market Revenue, By Form Factor, 2026 - 2034 (USD Billion)
  • 52. Japan Third-Party Optical Transceivers Market Revenue, By Data Rate, 2026 - 2034 (USD Billion)
  • 53. Japan Third-Party Optical Transceivers Market Revenue, By Application, 2026 - 2034 (USD Billion)
  • 54. Japan Third-Party Optical Transceivers Market Revenue, By End-User, 2026 - 2034 (USD Billion)
  • 55. India Third-Party Optical Transceivers Market Revenue, By Form Factor, 2026 - 2034 (USD Billion)
  • 56. India Third-Party Optical Transceivers Market Revenue, By Data Rate, 2026 - 2034 (USD Billion)
  • 57. India Third-Party Optical Transceivers Market Revenue, By Application, 2026 - 2034 (USD Billion)
  • 58. India Third-Party Optical Transceivers Market Revenue, By End-User, 2026 - 2034 (USD Billion)
  • 59. South Korea Third-Party Optical Transceivers Market Revenue, By Form Factor, 2026 - 2034 (USD Billion)
  • 60. South Korea Third-Party Optical Transceivers Market Revenue, By Data Rate, 2026 - 2034 (USD Billion)
  • 61. South Korea Third-Party Optical Transceivers Market Revenue, By Application, 2026 - 2034 (USD Billion)
  • 62. South Korea Third-Party Optical Transceivers Market Revenue, By End-User, 2026 - 2034 (USD Billion)
  • 63. South-East Asia Third-Party Optical Transceivers Market Revenue, By Form Factor, 2026 - 2034 (USD Billion)
  • 64. South-East Asia Third-Party Optical Transceivers Market Revenue, By Data Rate, 2026 - 2034 (USD Billion)
  • 65. South-East Asia Third-Party Optical Transceivers Market Revenue, By Application, 2026 - 2034 (USD Billion)
  • 66. South-East Asia Third-Party Optical Transceivers Market Revenue, By End-User, 2026 - 2034 (USD Billion)
  • 67. Rest of Asia Pacific Third-Party Optical Transceivers Market Revenue, By Form Factor, 2026 - 2034 (USD Billion)
  • 68. Rest of Asia Pacific Third-Party Optical Transceivers Market Revenue, By Data Rate, 2026 - 2034 (USD Billion)
  • 69. Rest of Asia Pacific Third-Party Optical Transceivers Market Revenue, By Application, 2026 - 2034 (USD Billion)
  • 70. Rest of Asia Pacific Third-Party Optical Transceivers Market Revenue, By End-User, 2026 - 2034 (USD Billion)
  • 71. Latin America Third-Party Optical Transceivers Market Revenue, By Form Factor, 2026 - 2034 (USD Billion)
  • 72. Latin America Third-Party Optical Transceivers Market Revenue, By Data Rate, 2026 - 2034 (USD Billion)
  • 73. Latin America Third-Party Optical Transceivers Market Revenue, By Application, 2026 - 2034 (USD Billion)
  • 74. Latin America Third-Party Optical Transceivers Market Revenue, By End-User, 2026 - 2034 (USD Billion)
  • 75. Brazil Third-Party Optical Transceivers Market Revenue, By Form Factor, 2026 - 2034 (USD Billion)
  • 76. Brazil Third-Party Optical Transceivers Market Revenue, By Data Rate, 2026 - 2034 (USD Billion)
  • 77. Brazil Third-Party Optical Transceivers Market Revenue, By Application, 2026 - 2034 (USD Billion)
  • 78. Brazil Third-Party Optical Transceivers Market Revenue, By End-User, 2026 - 2034 (USD Billion)
  • 79. Mexico Third-Party Optical Transceivers Market Revenue, By Form Factor, 2026 - 2034 (USD Billion)
  • 80. Mexico Third-Party Optical Transceivers Market Revenue, By Data Rate, 2026 - 2034 (USD Billion)
  • 81. Mexico Third-Party Optical Transceivers Market Revenue, By Application, 2026 - 2034 (USD Billion)
  • 82. Mexico Third-Party Optical Transceivers Market Revenue, By End-User, 2026 - 2034 (USD Billion)
  • 83. Rest of Latin America Third-Party Optical Transceivers Market Revenue, By Form Factor, 2026 - 2034 (USD Billion)
  • 84. Rest of Latin America Third-Party Optical Transceivers Market Revenue, By Data Rate, 2026 - 2034 (USD Billion)
  • 85. Rest of Latin America Third-Party Optical Transceivers Market Revenue, By Application, 2026 - 2034 (USD Billion)
  • 86. Rest of Latin America Third-Party Optical Transceivers Market Revenue, By End-User, 2026 - 2034 (USD Billion)
  • 87. The Middle-East and Africa Third-Party Optical Transceivers Market Revenue, By Form Factor, 2026 - 2034 (USD Billion)
  • 88. The Middle-East and Africa Third-Party Optical Transceivers Market Revenue, By Data Rate, 2026 - 2034 (USD Billion)
  • 89. The Middle-East and Africa Third-Party Optical Transceivers Market Revenue, By Application, 2026 - 2034 (USD Billion)
  • 90. The Middle-East and Africa Third-Party Optical Transceivers Market Revenue, By End-User, 2026 - 2034 (USD Billion)
  • 91. GCC Countries Third-Party Optical Transceivers Market Revenue, By Form Factor, 2026 - 2034 (USD Billion)
  • 92. GCC Countries Third-Party Optical Transceivers Market Revenue, By Data Rate, 2026 - 2034 (USD Billion)
  • 93. GCC Countries Third-Party Optical Transceivers Market Revenue, By Application, 2026 - 2034 (USD Billion)
  • 94. GCC Countries Third-Party Optical Transceivers Market Revenue, By End-User, 2026 - 2034 (USD Billion)
  • 95. South Africa Third-Party Optical Transceivers Market Revenue, By Form Factor, 2026 - 2034 (USD Billion)
  • 96. South Africa Third-Party Optical Transceivers Market Revenue, By Data Rate, 2026 - 2034 (USD Billion)
  • 97. South Africa Third-Party Optical Transceivers Market Revenue, By Application, 2026 - 2034 (USD Billion)
  • 98. South Africa Third-Party Optical Transceivers Market Revenue, By End-User, 2026 - 2034 (USD Billion)
  • 99. Rest of Middle-East Africa Third-Party Optical Transceivers Market Revenue, By Form Factor, 2026 - 2034 (USD Billion)
  • 100. Rest of Middle-East Africa Third-Party Optical Transceivers Market Revenue, By Data Rate, 2026 - 2034 (USD Billion)
  • 101. Rest of Middle-East Africa Third-Party Optical Transceivers Market Revenue, By Application, 2026 - 2034 (USD Billion)
  • 102. Rest of Middle-East Africa Third-Party Optical Transceivers Market Revenue, By End-User, 2026 - 2034 (USD Billion)

Industry Major Market Players

  • Finisar Corporation
  • Cisco Systems Inc.
  • Lumentum Holdings Inc.
  • Juniper Networks Inc.
  • Mellanox Technologies
  • Sumitomo Electric Industries Ltd.
  • Accelink Technologies Co. Ltd.
  • Foxconn Interconnect Technology
  • Hisense Broadband Multimedia Technologies Co. Ltd.
  • Source Photonics Inc.