Search Market Research Report

Discover Our Latest Reports
Discover Our Featured Reports
Discover Top Selling Reports

Thermal Interface Materials Market Size, Share Global Analysis Report, 2021 – 2026

report img

Thermal Interface Materials Market by Type (Silicone, Epoxy, Polyimide, and Others), By Product Type (Greases & Adhesives, Tapes & Films, Gap Fillers, Metal-Based TIMs, Phase Change Materials, and Others), By Application (Computers, Telecom, Consumer Durables, Medical Devices, Industrial Machinery, Automotive Electronics, and Others), By Region: Global & Regional Industry Perspective, Comprehensive Analysis, and Forecast 2021 – 2026

Industry Insights

[209+ Pages Report] According to Facts and Factors, the global thermal interface materials market was registered at around USD 2.8 Billion in 2020 and is expected to generate approximately USD 5.1 Billion in revenue by the end of 2026, with a CAGR of approximately 10.4% between 2021 and 2026.

logoMarket Overview 

Thermal interface materials are materials that are used to disperse heat from electronic devices and enhance heat transmission. They are usually sandwiched between the dissipating device or heat-spreading substrate and the components or heat-generating chip. Thermal Interface Materials represent significant difficulties for materials research due to the numerous conceivable applications and a vast range of materials. Thermal management in the electronics industry is highly complicated and necessitates a thorough understanding of the material characteristics of the TIMs used.

logoReport Scope

Report Attributes

Details

Market Size in 2020

USD 2.8 Billion

Projected Market Size in 2026

USD 5.1 Billion

Growth Rate

CAGR 10.4%

Base Year

2020

Forecast Years

2021 – 2026

Key Market Players

The 3M Company, Parker Hannifin Corporation, Laird Technologies, Indium Corporation, Zalma Tech Co. Ltd., Schlegel Electronic Materials, Inc., Universal Science, Master Bond Inc., Electrolube Limited, Fuji Polymer Industries Co., Ltd., AIM Specialty Materials, DK Thermal, GrafTech International Ltd., AOS Thermal Compounds LLC, Shin-Etsu Chemical Co. Ltd., Semikron, RBC Industries, Inc., LORD Corporation, Aremco Products Inc., Timtronics, Wakefield-Vette, Inc., Momentive Performance Materials, Dow Corning Corporation, Henkel AG & Co. KGaA, and Honeywell International Inc. amongst others.

Key Segment

By Type, By Product Type, By Application, By Region

Major Regions Covered

North America, Europe, Asia Pacific, Latin America, and the Middle East & Africa

Purchase Options

Request customized purchase options to meet your research needs. Explore purchase options

logoIndustry Growth Factors

The commercial availability of a variety of thermal interface materials in a variety of forms, along with expanding uses in the electronic sector, is expected to boost penetration in the coming years. Thermal interface materials are used to conduct heat across two hard surfaces and are particularly useful when sophisticated electrical gadgets are in high demand. Thermal interfaces are well-known for providing effective heat management solutions, which are necessary for enhancing the overall performance and longevity of a system.

Because of its thermal conductivity, the product is expected to see considerable gains, which will assist to extend the life and efficiency of the electronic device or equipment where it is used. Conductive materials, such as metals, metal oxides, or silicone, are commonly used to create the product.

Consumer behavior for electronic gadgets such as cell phones, tablets, and video games has not been affected by the post-pandemic situation. Rather, in recent years, under the recession, consumer durables sales have been falling as well. Furthermore, due to an increasing need for pharmaceuticals and medical equipment, demand for pharmaceutical and medical gear, as well as lab equipment has grown.

Thermal Interface Materials Market

To know more about this report | Request Free Sample Copy

logoSegmentation Analysis

The global thermal interface materials market is segregated based on type, product type, application, and region. Based on type the market is bifurcated into polyimide, epoxy, silicone, and others. The silicone segment dominated in 2020 and is expected to continue its dominance in the forecast period. This can be attributed to its outstanding characteristics such as resistance to chemical attack, stability to mechanical stress, shock & vibration resistance, and temperature variation stability. Based on the product type the market is bifurcated into tapes & films, metal-based TIMs, greases & adhesives, phase change materials, gap fillers, and others. The greases & adhesives category dominated the product type segmentation in 2020 and is expected to dominate the segment in the upcoming years. This can be attributed to its growing use in several applications such as power conversion equipment, transmission & engine control modules, PCs, memory modules, server CPUs, and mobile phones among others. Based on application the market is divided into telecom, medical devices, automotive electronics, computers, consumer durables, industrial machinery, and others. The computers category dominated the application segmentation in 2020 and is expected to dominate the segment in the upcoming years. This can be attributed to the growing use of TIMs in GPUs and CPSs of computers.

logo Regional Analysis

Asia Pacific region dominated the market in 2020 with a market share of more than 35% and is anticipated to continue its dominance in the upcoming years. This is due to the existence of a big manufacturing zone in the area. Government policies, GST reductions, corporate tax reductions, changing lifestyles, consumer health awareness, and growing family incomes, in addition to the industrial base, have the potential to accelerate industry growth in this region. As more trucks and vans are utilized to deliver essentials across the area, sales in the automotive sector can only be achieved through vehicle refurbishing or repair. However, the government's continued focus on healthcare and the automotive sector, as well as its encouragement of FDI from Asian manufacturers, might help the business recover in the projected term. Despite Europe being a key market for the automobile sector and medical device production, the product is expected to lose income over time. This is owing to the fact that, as a result of the current pandemic epidemic, manufacturing operations have come to a halt due to a collapsed supply and demand for cars.

logo Competitive Players

Some main participants of the global thermal interface materials market are

  • The 3M Company
  • Parker Hannifin Corporation
  • Laird Technologies
  • Indium Corporation
  • Zalma Tech Co. Ltd.
  • Schlegel Electronic Materials Inc.
  • Universal Science
  • Master Bond Inc.
  • Electrolube Limited
  • Fuji Polymer Industries Co. Ltd.
  • AIM Specialty Materials
  • DK Thermal
  • GrafTech International Ltd.
  • AOS Thermal Compounds LLC
  • Shin-Etsu Chemical Co. Ltd.
  • Semikron
  • RBC Industries Inc.
  • LORD Corporation
  • Aremco Products Inc.
  • Timtronics
  • Wakefield-Vette Inc.
  • Momentive Performance Materials
  • Dow Corning Corporation
  • Henkel AG & Co. KGaA
  • Honeywell International Inc.

logoGlobal Thermal Interface Materials Market – By Type

  • Silicone
  • Epoxy
  • Polyimide
  • Others

logoGlobal Thermal Interface Materials Market – By Product Type

  • Greases & Adhesives
  • Tapes & Films
  • Gap Fillers
  • Metal-Based TIMs
  • Phase Change Materials
  • Others

logoGlobal Thermal Interface Materials Market – By Application

  • Computers
  • Telecom
  • Consumer Durables
  • Medical Devices
  • Industrial Machinery
  • Automotive Electronics
  • Others

logoGlobal Thermal Interface Materials Market – By Region

  • North America
    • U.S.
    • Canada
  • Europe
    • France
    • The UK
    • Spain
    • Germany
    • Italy
    • Rest of Europe
  • Asia Pacific
    • China
    • Japan
    • India
    • South Korea
    • Southeast Asia
    • Rest of Asia Pacific
  • Latin America
    • Brazil
    • Mexico
    • Rest of Latin America
  • Middle East & Africa
    • GCC Countries
    • South Africa
    • Rest of Middle East & Africa

Table of Content

  1. Chapter 1 Executive Summary
    1. 1.1. Introduction of Thermal Interface Materials
    2. 1.2. Global Thermal Interface Materials Market, 2020 & 2026 (USD Million)
    3. 1.3. Global Thermal Interface Materials Market, 2016 – 2026 (USD Million) (Kilo Tons)
    4. 1.4. Global Thermal Interface Materials Market Absolute Revenue Opportunity, 2016 – 2026 (USD Million)
    5. 1.5. Global Thermal Interface Materials Market Incremental Revenue Opportunity, 2020 – 2026 (USD Million)
  2. Chapter 2 Thermal Interface Materials Market – Type Analysis
    1. 2.1. Global Thermal Interface Materials Market – Type Overview
    2. 2.2. Global Thermal Interface Materials Market Share, by Type, 2020 & 2026 (USD Million)
    3. 2.3. Global Thermal Interface Materials Market share, by Type, 2020 & 2026 (Kilo Tons)
    4. 2.4. Silicone
      1. 2.4.1. Global Silicone Thermal Interface Materials Market, 2016 – 2026 (USD Million)
      2. 2.4.2. Global Silicone Thermal Interface Materials Market, 2016 – 2026 (Kilo Tons)
    5. 2.5. Epoxy
      1. 2.5.1. Global Epoxy Thermal Interface Materials Market, 2016 – 2026 (USD Million)
      2. 2.5.2. Global Epoxy Thermal Interface Materials Market, 2016 – 2026 (Kilo Tons)
    6. 2.6. Polyimide
      1. 2.6.1. Global Polyimide Thermal Interface Materials Market, 2016 – 2026 (USD Million)
      2. 2.6.2. Global Polyimide Thermal Interface Materials Market, 2016 – 2026 (Kilo Tons)
    7. 2.7. Others
      1. 2.7.1. Global Others Thermal Interface Materials Market, 2016 – 2026 (USD Million)
      2. 2.7.2. Global Others Thermal Interface Materials Market, 2016 – 2026 (Kilo Tons)
  3. Chapter 3 Thermal Interface Materials Market – Product Type Analysis
    1. 3.1. Global Thermal Interface Materials Market – Product Type Overview
    2. 3.2. Global Thermal Interface Materials Market Share, by Product Type, 2020 & 2026 (USD Million)
    3. 3.3. Global Thermal Interface Materials Market share, by Product Type, 2020 & 2026 (Kilo Tons)
    4. 3.4. Greases & Adhesives
      1. 3.4.1. Global Greases & Adhesives Thermal Interface Materials Market, 2016 – 2026 (USD Million)
      2. 3.4.2. Global Greases & Adhesives Thermal Interface Materials Market, 2016 – 2026 (Kilo Tons)
    5. 3.5. Tapes & Films
      1. 3.5.1. Global Tapes & Films Thermal Interface Materials Market, 2016 – 2026 (USD Million)
      2. 3.5.2. Global Tapes & Films Thermal Interface Materials Market, 2016 – 2026 (Kilo Tons)
    6. 3.6. Gap Fillers
      1. 3.6.1. Global Gap Fillers Thermal Interface Materials Market, 2016 – 2026 (USD Million)
      2. 3.6.2. Global Gap Fillers Thermal Interface Materials Market, 2016 – 2026 (Kilo Tons)
    7. 3.7. Metal-Based TIMs
      1. 3.7.1. Global Metal-Based TIMs Thermal Interface Materials Market, 2016 – 2026 (USD Million)
      2. 3.7.2. Global Metal-Based TIMs Thermal Interface Materials Market, 2016 – 2026 (Kilo Tons)
    8. 3.8. Phase Change Materials
      1. 3.8.1. Global Phase Change Materials Thermal Interface Materials Market, 2016 – 2026 (USD Million)
      2. 3.8.2. Global Phase Change Materials Thermal Interface Materials Market, 2016 – 2026 (Kilo Tons)
    9. 3.9. Others
      1. 3.9.1. Global Others Thermal Interface Materials Market, 2016 – 2026 (USD Million)
      2. 3.9.2. Global Others Thermal Interface Materials Market, 2016 – 2026 (Kilo Tons)
  4. Chapter 4 Thermal Interface Materials Market – Application Analysis
    1. 4.1. Global Thermal Interface Materials Market – Application Overview
    2. 4.2. Global Thermal Interface Materials Market Share, by Application, 2020 & 2026 (USD Million)
    3. 4.3. Global Thermal Interface Materials Market share, by Application, 2020 & 2026 (Kilo Tons)
    4. 4.4. Computers
      1. 4.4.1. Global Computers Thermal Interface Materials Market, 2016 – 2026 (USD Million)
      2. 4.4.2. Global Computers Thermal Interface Materials Market, 2016 – 2026 (Kilo Tons)
    5. 4.5. Telecom
      1. 4.5.1. Global Telecom Thermal Interface Materials Market, 2016 – 2026 (USD Million)
      2. 4.5.2. Global Telecom Thermal Interface Materials Market, 2016 – 2026 (Kilo Tons)
    6. 4.6. Consumer Durables
      1. 4.6.1. Global Consumer Durables Thermal Interface Materials Market, 2016 – 2026 (USD Million)
      2. 4.6.2. Global Consumer Durables Thermal Interface Materials Market, 2016 – 2026 (Kilo Tons)
    7. 4.7. Medical Devices
      1. 4.7.1. Global Medical Devices Thermal Interface Materials Market, 2016 – 2026 (USD Million)
      2. 4.7.2. Global Medical Devices Thermal Interface Materials Market, 2016 – 2026 (Kilo Tons)
    8. 4.8. Industrial Machinery
      1. 4.8.1. Global Industrial Machinery Thermal Interface Materials Market, 2016 – 2026 (USD Million)
      2. 4.8.2. Global Industrial Machinery Thermal Interface Materials Market, 2016 – 2026 (Kilo Tons)
    9. 4.9. Automotive Electronics
      1. 4.9.1. Global Automotive Electronics Thermal Interface Materials Market, 2016 – 2026 (USD Million)
      2. 4.9.2. Global Automotive Electronics Thermal Interface Materials Market, 2016 – 2026 (Kilo Tons)
    10. 4.10. Others
      1. 4.10.1. Global Others Thermal Interface Materials Market, 2016 – 2026 (USD Million)
      2. 4.10.2. Global Others Thermal Interface Materials Market, 2016 – 2026 (Kilo Tons)
  5. Chapter 5 Thermal Interface Materials Market – Regional Analysis
    1. 5.1. Global Thermal Interface Materials Market Regional Overview
    2. 5.2. Global Thermal Interface Materials Market Share, by Region, 2020 & 2026 (USD Million)
    3. 5.3. Global Thermal Interface Materials Market Share, by Region, 2020 & 2026 (Kilo Tons)
    4. 5.4. North America
      1. 5.4.1. North America Thermal Interface Materials Market, 2016 – 2026 (USD Million)
        1. 5.4.1.1. North America Thermal Interface Materials Market, by Country, 2016 – 2026 (USD Million)
      2. 5.4.2. North America Market, 2016 – 2026 (Kilo Tons)
        1. 5.4.2.1. North America Thermal Interface Materials Market, by Country, 2016 – 2026 (Kilo Tons)
      3. 5.4.3. North America Thermal Interface Materials Market, by Type, 2016 – 2026
        1. 5.4.3.1. North America Thermal Interface Materials Market, by Type, 2016 – 2026 (USD Million)
        2. 5.4.3.2. North America Thermal Interface Materials Market, by Type, 2016 – 2026 (Kilo Tons)
      4. 5.4.4. North America Thermal Interface Materials Market, by Product Type, 2016 – 2026
        1. 5.4.4.1. North America Thermal Interface Materials Market, by Product Type, 2016 – 2026 (USD Million)
        2. 5.4.4.2. North America Thermal Interface Materials Market, by Product Type, 2016 – 2026 (Kilo Tons)
      5. 5.4.5. North America Thermal Interface Materials Market, by Application, 2016 – 2026
        1. 5.4.5.1. North America Thermal Interface Materials Market, by Application, 2016 – 2026 (USD Million)
        2. 5.4.5.2. North America Thermal Interface Materials Market, by Application, 2016 – 2026 (Kilo Tons)
      6. 5.4.6. U.S.
        1. 5.4.6.1. U.S. Thermal Interface Materials Market, 2016 – 2026 (USD Million)
        2. 5.4.6.2. U.S. Thermal Interface Materials Market, 2016 – 2026 (Kilo Tons)
      7. 5.4.7. Canada
        1. 5.4.7.1. Canada Thermal Interface Materials Market, 2016 – 2026 (USD Million)
        2. 5.4.7.2. Canada Thermal Interface Materials Market, 2016 – 2026 (Kilo Tons)
    5. 5.5. Europe
      1. 5.5.1. Europe Thermal Interface Materials Market, 2016 – 2026 (USD Million)
        1. 5.5.1.1. Europe Thermal Interface Materials Market, by Country, 2016 – 2026 (USD Million)
      2. 5.5.2. Europe Market, 2016 – 2026 (Kilo Tons)
        1. 5.5.2.1. Europe Thermal Interface Materials Market, by Country, 2016 – 2026 (Kilo Tons)
      3. 5.5.3. Europe Thermal Interface Materials Market, by Type, 2016 – 2026
        1. 5.5.3.1. Europe Thermal Interface Materials Market, by Type, 2016 – 2026 (USD Million)
        2. 5.5.3.2. Europe Thermal Interface Materials Market, by Type, 2016 – 2026 (Kilo Tons)
      4. 5.5.4. Europe Thermal Interface Materials Market, by Product Type, 2016 – 2026
        1. 5.5.4.1. Europe Thermal Interface Materials Market, by Product Type, 2016 – 2026 (USD Million)
        2. 5.5.4.2. Europe Thermal Interface Materials Market, by Product Type, 2016 – 2026 (Kilo Tons)
      5. 5.5.5. Europe Thermal Interface Materials Market, by Application, 2016 – 2026
        1. 5.5.5.1. Europe Thermal Interface Materials Market, by Application, 2016 – 2026 (USD Million)
        2. 5.5.5.2. Europe Thermal Interface Materials Market, by Application, 2016 – 2026 (Kilo Tons)
      6. 5.5.6. Germany
        1. 5.5.6.1. Germany Thermal Interface Materials Market, 2016 – 2026 (USD Million)
        2. 5.5.6.2. Germany Thermal Interface Materials Market, 2016 – 2026 (Kilo Tons)
      7. 5.5.7. France
        1. 5.5.7.1. France Thermal Interface Materials Market, 2016 – 2026 (USD Million)
        2. 5.5.7.2. France Thermal Interface Materials Market, 2016 – 2026 (Kilo Tons)
      8. 5.5.8. U.K.
        1. 5.5.8.1. U.K. Thermal Interface Materials Market, 2016 – 2026 (USD Million)
        2. 5.5.8.2. U.K. Thermal Interface Materials Market, 2016 – 2026 (Kilo Tons)
      9. 5.5.9. Italy
        1. 5.5.9.1. Italy Thermal Interface Materials Market, 2016 – 2026 (USD Million)
        2. 5.5.9.2. Italy Thermal Interface Materials Market, 2016 – 2026 (Kilo Tons)
      10. 5.5.10. Spain
        1. 5.5.10.1. Spain Thermal Interface Materials Market, 2016 – 2026 (USD Million)
        2. 5.5.10.2. Spain Thermal Interface Materials Market, 2016 – 2026 (Kilo Tons)
      11. 5.5.11. Rest of Europe
        1. 5.5.11.1. Rest of Europe Thermal Interface Materials Market, 2016 – 2026 (USD Million)
        2. 5.5.11.2. Rest of Europe Thermal Interface Materials Market, 2016 – 2026 (Kilo Tons)
    6. 5.6. Asia Pacific
      1. 5.6.1. Asia Pacific Thermal Interface Materials Market, 2016 – 2026 (USD Million)
        1. 5.6.1.1. Asia Pacific Thermal Interface Materials Market, by Country, 2016 – 2026 (USD Million)
      2. 5.6.2. Asia Pacific Market, 2016 – 2026 (Kilo Tons)
        1. 5.6.2.1. Asia Pacific Thermal Interface Materials Market, by Country, 2016 – 2026 (Kilo Tons)
      3. 5.6.3. Asia Pacific Thermal Interface Materials Market, by Type, 2016 – 2026
        1. 5.6.3.1. Asia Pacific Thermal Interface Materials Market, by Type, 2016 – 2026 (USD Million)
        2. 5.6.3.2. Asia Pacific Thermal Interface Materials Market, by Type, 2016 – 2026 (Kilo Tons)
      4. 5.6.4. Asia Pacific Thermal Interface Materials Market, by Product Type, 2016 – 2026
        1. 5.6.4.1. Asia Pacific Thermal Interface Materials Market, by Product Type, 2016 – 2026 (USD Million)
        2. 5.6.4.2. Asia Pacific Thermal Interface Materials Market, by Product Type, 2016 – 2026 (Kilo Tons)
      5. 5.6.5. Asia Pacific Thermal Interface Materials Market, by Application, 2016 – 2026
        1. 5.6.5.1. Asia Pacific Thermal Interface Materials Market, by Application, 2016 – 2026 (USD Million)
        2. 5.6.5.2. Asia Pacific Thermal Interface Materials Market, by Application, 2016 – 2026 (Kilo Tons)
      6. 5.6.6. China
        1. 5.6.6.1. China Thermal Interface Materials Market, 2016 – 2026 (USD Million)
        2. 5.6.6.2. China Thermal Interface Materials Market, 2016 – 2026 (Kilo Tons)
      7. 5.6.7. Japan
        1. 5.6.7.1. Japan Thermal Interface Materials Market, 2016 – 2026 (USD Million)
        2. 5.6.7.2. Japan Thermal Interface Materials Market, 2016 – 2026 (Kilo Tons)
      8. 5.6.8. India
        1. 5.6.8.1. India Thermal Interface Materials Market, 2016 – 2026 (USD Million)
        2. 5.6.8.2. India Thermal Interface Materials Market, 2016 – 2026 (Kilo Tons)
      9. 5.6.9. South Korea
        1. 5.6.9.1. South Korea Thermal Interface Materials Market, 2016 – 2026 (USD Million)
        2. 5.6.9.2. South Korea Thermal Interface Materials Market, 2016 – 2026 (Kilo Tons)
      10. 5.6.10. South-East Asia
        1. 5.6.10.1. South-East Asia Thermal Interface Materials Market, 2016 – 2026 (USD Million)
        2. 5.6.10.2. South-East Asia Thermal Interface Materials Market, 2016 – 2026 (Kilo Tons)
      11. 5.6.11. Rest of Asia Pacific
        1. 5.6.11.1. Rest of Asia Pacific Thermal Interface Materials Market, 2016 – 2026 (USD Million)
        2. 5.6.11.2. Rest of Asia Pacific Thermal Interface Materials Market, 2016 – 2026 (Kilo Tons)
    7. 5.7. Latin America
      1. 5.7.1. Latin America Thermal Interface Materials Market, 2016 – 2026 (USD Million)
        1. 5.7.1.1. Latin America Thermal Interface Materials Market, by Country, 2016 – 2026 (USD Million)
      2. 5.7.2. Latin America Market, 2016 – 2026 (Kilo Tons)
        1. 5.7.2.1. Latin America Thermal Interface Materials Market, by Country, 2016 – 2026 (Kilo Tons)
      3. 5.7.3. Latin America Thermal Interface Materials Market, by Type, 2016 – 2026
        1. 5.7.3.1. Latin America Thermal Interface Materials Market, by Type, 2016 – 2026 (USD Million)
        2. 5.7.3.2. Latin America Thermal Interface Materials Market, by Type, 2016 – 2026 (Kilo Tons)
      4. 5.7.4. Latin America Thermal Interface Materials Market, by Product Type, 2016 – 2026
        1. 5.7.4.1. Latin America Thermal Interface Materials Market, by Product Type, 2016 – 2026 (USD Million)
        2. 5.7.4.2. Latin America Thermal Interface Materials Market, by Product Type, 2016 – 2026 (Kilo Tons)
      5. 5.7.5. Latin America Thermal Interface Materials Market, by Application, 2016 – 2026
        1. 5.7.5.1. Latin America Thermal Interface Materials Market, by Application, 2016 – 2026 (USD Million)
        2. 5.7.5.2. Latin America Thermal Interface Materials Market, by Application, 2016 – 2026 (Kilo Tons)
      6. 5.7.6. Brazil
        1. 5.7.6.1. Brazil Thermal Interface Materials Market, 2016 – 2026 (USD Million)
        2. 5.7.6.2. Brazil Thermal Interface Materials Market, 2016 – 2026 (Kilo Tons)
      7. 5.7.7. Mexico
        1. 5.7.7.1. Mexico Thermal Interface Materials Market, 2016 – 2026 (USD Million)
        2. 5.7.7.2. Mexico Thermal Interface Materials Market, 2016 – 2026 (Kilo Tons)
      8. 5.7.8. Rest of Latin America
        1. 5.7.8.1. Rest of Latin America Thermal Interface Materials Market, 2016 – 2026 (USD Million)
        2. 5.7.8.2. Rest of Latin America Thermal Interface Materials Market, 2016 – 2026 (Kilo Tons)
    8. 5.8. The Middle-East and Africa
      1. 5.8.1. The Middle-East and Africa Thermal Interface Materials Market, 2016 – 2026 (USD Million)
        1. 5.8.1.1. The Middle-East and Africa Thermal Interface Materials Market, by Country, 2016 – 2026 (USD Million)
      2. 5.8.2. The Middle-East and Africa Market, 2016 – 2026 (Kilo Tons)
        1. 5.8.2.1. The Middle-East and Africa Thermal Interface Materials Market, by Country, 2016 – 2026 (Kilo Tons)
      3. 5.8.3. The Middle-East and Africa Thermal Interface Materials Market, by Type, 2016 – 2026
        1. 5.8.3.1. The Middle-East and Africa Thermal Interface Materials Market, by Type, 2016 – 2026 (USD Million)
        2. 5.8.3.2. The Middle-East and Africa Thermal Interface Materials Market, by Type, 2016 – 2026 (Kilo Tons)
      4. 5.8.4. The Middle-East and Africa Thermal Interface Materials Market, by Product Type, 2016 – 2026
        1. 5.8.4.1. The Middle-East and Africa Thermal Interface Materials Market, by Product Type, 2016 – 2026 (USD Million)
        2. 5.8.4.2. The Middle-East and Africa Thermal Interface Materials Market, by Product Type, 2016 – 2026 (Kilo Tons)
      5. 5.8.5. The Middle-East and Africa Thermal Interface Materials Market, by Application, 2016 – 2026
        1. 5.8.5.1. The Middle-East and Africa Thermal Interface Materials Market, by Application, 2016 – 2026 (USD Million)
        2. 5.8.5.2. The Middle-East and Africa Thermal Interface Materials Market, by Application, 2016 – 2026 (Kilo Tons)
      6. 5.8.6. GCC Countries
        1. 5.8.6.1. GCC Countries Thermal Interface Materials Market, 2016 – 2026 (USD Million)
        2. 5.8.6.2. GCC Countries Thermal Interface Materials Market, 2016 – 2026 (Kilo Tons)
      7. 5.8.7. South Africa
        1. 5.8.7.1. South Africa Thermal Interface Materials Market, 2016 – 2026 (USD Million)
        2. 5.8.7.2. South Africa Thermal Interface Materials Market, 2016 – 2026 (Kilo Tons)
      8. 5.8.8. Rest of Middle-East Africa
        1. 5.8.8.1. Rest of Middle-East Africa Thermal Interface Materials Market, 2016 – 2026 (USD Million)
        2. 5.8.8.2. Rest of Middle-East Africa Thermal Interface Materials Market, 2016 – 2026 (Kilo Tons)
  6. Chapter 6 Thermal Interface Materials Production, Consumption, Export, Import by Regions
    1. 6.1. Global Thermal Interface Materials Production and Consumption, 2016 – 2026 (Kilo Tons)
    2. 6.2. Global Import and Export Analysis, by Region
  7. Chapter 7 Thermal Interface Materials Market – Competitive Landscape
    1. 7.1. Competitor Market Share – Revenue
    2. 7.2. Market Concentration Rate Analysis, Top 3 and Top 5 Players
    3. 7.3. Competitor Market Share – Volume
    4. 7.4. Strategic Developments
      1. 7.4.1. Acquisitions and Mergers
      2. 7.4.2. New Products
      3. 7.4.3. Research & Development Activities
  8. Chapter 8 Company Profiles
    1. 8.1. Honeywell International Inc.
      1. 8.1.1. Company Overview
      2. 8.1.2. Product/Service Portfolio
      3. 8.1.3. Honeywell International Inc. Sales, Revenue, Price, and Gross Margin
      4. 8.1.4. Honeywell International Inc. Revenue and Growth Rate
      5. 8.1.5. Honeywell International Inc. Market Share
      6. 8.1.6. Recent Initiatives, Funding/VC Activities, and Technological Innovations
    2. 8.2. The 3M Company
      1. 8.2.1. Company Overview
      2. 8.2.2. Product/Service Portfolio
      3. 8.2.3. The 3M Company Sales, Revenue, Price, and Gross Margin
      4. 8.2.4. The 3M Company Revenue and Growth Rate
      5. 8.2.5. The 3M Company Market Share
      6. 8.2.6. Recent Initiatives, Funding/VC Activities, and Technological Innovations
    3. 8.3. Henkel AG & Co. KGaA
      1. 8.3.1. Company Overview
      2. 8.3.2. Product/Service Portfolio
      3. 8.3.3. Henkel AG & Co. KGaA Sales, Revenue, Price, and Gross Margin
      4. 8.3.4. Henkel AG & Co. KGaA Revenue and Growth Rate
      5. 8.3.5. Henkel AG & Co. KGaA Market Share
      6. 8.3.6. Recent Initiatives, Funding/VC Activities, and Technological Innovations
    4. 8.4. Parker Hannifin Corporation
      1. 8.4.1. Company Overview
      2. 8.4.2. Product/Service Portfolio
      3. 8.4.3. Parker Hannifin Corporation Sales, Revenue, Price, and Gross Margin
      4. 8.4.4. Parker Hannifin Corporation Revenue and Growth Rate
      5. 8.4.5. Parker Hannifin Corporation Market Share
      6. 8.4.6. Recent Initiatives, Funding/VC Activities, and Technological Innovations
    5. 8.5. Dow Corning Corporation
      1. 8.5.1. Company Overview
      2. 8.5.2. Product/Service Portfolio
      3. 8.5.3. Dow Corning Corporation Sales, Revenue, Price, and Gross Margin
      4. 8.5.4. Dow Corning Corporation Revenue and Growth Rate
      5. 8.5.5. Dow Corning Corporation Market Share
      6. 8.5.6. Recent Initiatives, Funding/VC Activities, and Technological Innovations
    6. 8.6. Laird Technologies
      1. 8.6.1. Company Overview
      2. 8.6.2. Product/Service Portfolio
      3. 8.6.3. Laird Technologies Sales, Revenue, Price, and Gross Margin
      4. 8.6.4. Laird Technologies Revenue and Growth Rate
      5. 8.6.5. Laird Technologies Market Share
      6. 8.6.6. Recent Initiatives, Funding/VC Activities, and Technological Innovations
    7. 8.7. Momentive Performance Materials
      1. 8.7.1. Company Overview
      2. 8.7.2. Product/Service Portfolio
      3. 8.7.3. Momentive Performance Materials Sales, Revenue, Price, and Gross Margin
      4. 8.7.4. Momentive Performance Materials Revenue and Growth Rate
      5. 8.7.5. Momentive Performance Materials Market Share
      6. 8.7.6. Recent Initiatives, Funding/VC Activities, and Technological Innovations
    8. 8.8. Indim Corporation
      1. 8.8.1. Company Overview
      2. 8.8.2. Product/Service Portfolio
      3. 8.8.3. Indim Corporation Sales, Revenue, Price, and Gross Margin
      4. 8.8.4. Indim Corporation Revenue and Growth Rate
      5. 8.8.5. Indim Corporation Market Share
      6. 8.8.6. Recent Initiatives, Funding/VC Activities, and Technological Innovations
    9. 8.9. Wakefield-Vette, Inc.
      1. 8.9.1. Company Overview
      2. 8.9.2. Product/Service Portfolio
      3. 8.9.3. Wakefield-Vette, Inc. Sales, Revenue, Price, and Gross Margin
      4. 8.9.4. Wakefield-Vette, Inc. Revenue and Growth Rate
      5. 8.9.5. Wakefield-Vette, Inc. Market Share
      6. 8.9.6. Recent Initiatives, Funding/VC Activities, and Technological Innovations
    10. 8.10. Zalma Tech Co. Ltd.
      1. 8.10.1. Company Overview
      2. 8.10.2. Product/Service Portfolio
      3. 8.10.3. Zalma Tech Co. Ltd. Sales, Revenue, Price, and Gross Margin
      4. 8.10.4. Zalma Tech Co. Ltd. Revenue and Growth Rate
      5. 8.10.5. Zalma Tech Co. Ltd. Market Share
      6. 8.10.6. Recent Initiatives, Funding/VC Activities, and Technological Innovations
    11. 8.11. Timtronics
      1. 8.11.1. Company Overview
      2. 8.11.2. Product/Service Portfolio
      3. 8.11.3. Timtronics Sales, Revenue, Price, and Gross Margin
      4. 8.11.4. Timtronics Revenue and Growth Rate
      5. 8.11.5. Timtronics Market Share
      6. 8.11.6. Recent Initiatives, Funding/VC Activities, and Technological Innovations
    12. 8.12. Schlegel Electronic Materials, Inc.
      1. 8.12.1. Company Overview
      2. 8.12.2. Product/Service Portfolio
      3. 8.12.3. Schlegel Electronic Materials, Inc. Sales, Revenue, Price, and Gross Margin
      4. 8.12.4. Schlegel Electronic Materials, Inc. Revenue and Growth Rate
      5. 8.12.5. Schlegel Electronic Materials, Inc. Market Share
      6. 8.12.6. Recent Initiatives, Funding/VC Activities, and Technological Innovations
    13. 8.13. Aremco Products Inc.
      1. 8.13.1. Company Overview
      2. 8.13.2. Product/Service Portfolio
      3. 8.13.3. Aremco Products Inc. Sales, Revenue, Price, and Gross Margin
      4. 8.13.4. Aremco Products Inc. Revenue and Growth Rate
      5. 8.13.5. Aremco Products Inc. Market Share
      6. 8.13.6. Recent Initiatives, Funding/VC Activities, and Technological Innovations
    14. 8.14. Universal Science
      1. 8.14.1. Company Overview
      2. 8.14.2. Product/Service Portfolio
      3. 8.14.3. Universal Science Sales, Revenue, Price, and Gross Margin
      4. 8.14.4. Universal Science Revenue and Growth Rate
      5. 8.14.5. Universal Science Market Share
      6. 8.14.6. Recent Initiatives, Funding/VC Activities, and Technological Innovations
    15. 8.15. LORD Corporation
      1. 8.15.1. Company Overview
      2. 8.15.2. Product/Service Portfolio
      3. 8.15.3. LORD Corporation Sales, Revenue, Price, and Gross Margin
      4. 8.15.4. LORD Corporation Revenue and Growth Rate
      5. 8.15.5. LORD Corporation Market Share
      6. 8.15.6. Recent Initiatives, Funding/VC Activities, and Technological Innovations
    16. 8.16. Master Bond Inc.
      1. 8.16.1. Company Overview
      2. 8.16.2. Product/Service Portfolio
      3. 8.16.3. Master Bond Inc. Sales, Revenue, Price, and Gross Margin
      4. 8.16.4. Master Bond Inc. Revenue and Growth Rate
      5. 8.16.5. Master Bond Inc. Market Share
      6. 8.16.6. Recent Initiatives, Funding/VC Activities, and Technological Innovations
    17. 8.17. RBC Industries, Inc.
      1. 8.17.1. Company Overview
      2. 8.17.2. Product/Service Portfolio
      3. 8.17.3. RBC Industries, Inc. Sales, Revenue, Price, and Gross Margin
      4. 8.17.4. RBC Industries, Inc. Revenue and Growth Rate
      5. 8.17.5. RBC Industries, Inc. Market Share
      6. 8.17.6. Recent Initiatives, Funding/VC Activities, and Technological Innovations
    18. 8.18. Electrolube Limited
      1. 8.18.1. Company Overview
      2. 8.18.2. Product/Service Portfolio
      3. 8.18.3. Electrolube Limited Sales, Revenue, Price, and Gross Margin
      4. 8.18.4. Electrolube Limited Revenue and Growth Rate
      5. 8.18.5. Electrolube Limited Market Share
      6. 8.18.6. Recent Initiatives, Funding/VC Activities, and Technological Innovations
    19. 8.19. Semikron
      1. 8.19.1. Company Overview
      2. 8.19.2. Product/Service Portfolio
      3. 8.19.3. Semikron Sales, Revenue, Price, and Gross Margin
      4. 8.19.4. Semikron Revenue and Growth Rate
      5. 8.19.5. Semikron Market Share
      6. 8.19.6. Recent Initiatives, Funding/VC Activities, and Technological Innovations
    20. 8.20. Fuji Polymer Industries Co., Ltd.
      1. 8.20.1. Company Overview
      2. 8.20.2. Product/Service Portfolio
      3. 8.20.3. Fuji Polymer Industries Co., Ltd. Sales, Revenue, Price, and Gross Margin
      4. 8.20.4. Fuji Polymer Industries Co., Ltd. Revenue and Growth Rate
      5. 8.20.5. Fuji Polymer Industries Co., Ltd. Market Share
      6. 8.20.6. Recent Initiatives, Funding/VC Activities, and Technological Innovations
    21. 8.21. Shin-Etsu Chemical Co. Ltd.
      1. 8.21.1. Company Overview
      2. 8.21.2. Product/Service Portfolio
      3. 8.21.3. Shin-Etsu Chemical Co. Ltd. Sales, Revenue, Price, and Gross Margin
      4. 8.21.4. Shin-Etsu Chemical Co. Ltd. Revenue and Growth Rate
      5. 8.21.5. Shin-Etsu Chemical Co. Ltd. Market Share
      6. 8.21.6. Recent Initiatives, Funding/VC Activities, and Technological Innovations
    22. 8.22. AIM Specialty Materials
      1. 8.22.1. Company Overview
      2. 8.22.2. Product/Service Portfolio
      3. 8.22.3. AIM Specialty Materials Sales, Revenue, Price, and Gross Margin
      4. 8.22.4. AIM Specialty Materials Revenue and Growth Rate
      5. 8.22.5. AIM Specialty Materials Market Share
      6. 8.22.6. Recent Initiatives, Funding/VC Activities, and Technological Innovations
    23. 8.23. AOS Thermal Compounds LLC
      1. 8.23.1. Company Overview
      2. 8.23.2. Product/Service Portfolio
      3. 8.23.3. AOS Thermal Compounds LLC Sales, Revenue, Price, and Gross Margin
      4. 8.23.4. AOS Thermal Compounds LLC Revenue and Growth Rate
      5. 8.23.5. AOS Thermal Compounds LLC Market Share
      6. 8.23.6. Recent Initiatives, Funding/VC Activities, and Technological Innovations
    24. 8.24. DK Thermal
      1. 8.24.1. Company Overview
      2. 8.24.2. Product/Service Portfolio
      3. 8.24.3. DK Thermal Sales, Revenue, Price, and Gross Margin
      4. 8.24.4. DK Thermal Revenue and Growth Rate
      5. 8.24.5. DK Thermal Market Share
      6. 8.24.6. Recent Initiatives, Funding/VC Activities, and Technological Innovations
    25. 8.25. GrafTech International Ltd.
      1. 8.25.1. Company Overview
      2. 8.25.2. Product/Service Portfolio
      3. 8.25.3. GrafTech International Ltd. Sales, Revenue, Price, and Gross Margin
      4. 8.25.4. GrafTech International Ltd. Revenue and Growth Rate
      5. 8.25.5. GrafTech International Ltd. Market Share
      6. 8.25.6. Recent Initiatives, Funding/VC Activities, and Technological Innovations
    26. 8.26. Others
      1. 8.26.1. Company Overview
      2. 8.26.2. Product/Service Portfolio
      3. 8.26.3. Others Sales, Revenue, Price, and Gross Margin
      4. 8.26.4. Others Revenue and Growth Rate
      5. 8.26.5. Others Market Share
      6. 8.26.6. Recent Initiatives, Funding/VC Activities, and Technological Innovations
  9. Chapter 9 Thermal Interface Materials — Industry Analysis
    1. 9.1. Introduction and Taxonomy
    2. 9.2. Thermal Interface Materials Market – Key Trends
      1. 9.2.1. Market Drivers
      2. 9.2.2. Market Restraints
      3. 9.2.3. Market Opportunities
    3. 9.3. Value Chain Analysis
    4. 9.4. Key Mandates and Regulations
    5. 9.5. Technology Roadmap and Timeline
    6. 9.6. Thermal Interface Materials Market – Attractiveness Analysis
      1. 9.6.1. By Type
      2. 9.6.2. By Product Type
      3. 9.6.3. By Application
      4. 9.6.4. By Region
  10. Chapter 10 Raw Material Analysis
    1. 10.1. Thermal Interface Materials Key Raw Material Analysis
      1. 10.1.1. Key Raw Materials
      2. 10.1.2. Price Trend of Key Raw Materials
    2. 10.2. Key Suppliers of Raw Materials
    3. 10.3. Proportion of Manufacturing Cost Structure
      1. 10.3.1. Raw Materials Cost
      2. 10.3.2. Labor Cost
      3. 10.3.3. Manufacturing Expenses
      4. 10.3.4. Miscellaneous Expenses
    4. 10.4. Manufacturing Cost Analysis of Thermal Interface Materials
  11. Chapter 11 Industrial Chain, Sourcing Strategy, and Downstream Buyers
    1. 11.1. Thermal Interface Materials Industrial Chain Analysis
    2. 11.2. Upstream Raw Materials Sourcing
      1. 11.2.1. Risk Mitigation:
      2. 11.2.2. Supplier Relationships:
      3. 11.2.3. Business Processes:
      4. 11.2.4. Securing the Product:
    3. 11.3. Raw Materials Sources of Thermal Interface Materials Major Manufacturers
    4. 11.4. Downstream Buyers
    5. 11.5. Distributors/Traders List
  12. Chapter 12 Marketing Strategy Analysis, Distributors
    1. 12.1. Marketing Channel
    2. 12.2. Direct Marketing
    3. 12.3. Indirect Marketing
    4. 12.4. Marketing Channel Development Trends
    5. 12.5. Economic/Political Environmental Change
  13. Chapter 13 Report Conclusion & Key Insights
    1. 13.1. Key Insights from Primary Interviews & Surveys Respondents
    2. 13.2. Key Takeaways from Analysts, Consultants, and Industry Leaders
  14. Chapter 14 Research Approach & Methodology
    1. 14.1. Report Description
    2. 14.2. Research Scope
    3. 14.3. Research Methodology
      1. 14.3.1. Secondary Research
      2. 14.3.2. Primary Research
      3. 14.3.3. Statistical Models
        1. 14.3.3.1. Company Share Analysis Model
        2. 14.3.3.2. Revenue Based Modeling
      4. 14.3.4. Research Limitations 

      List of Figures

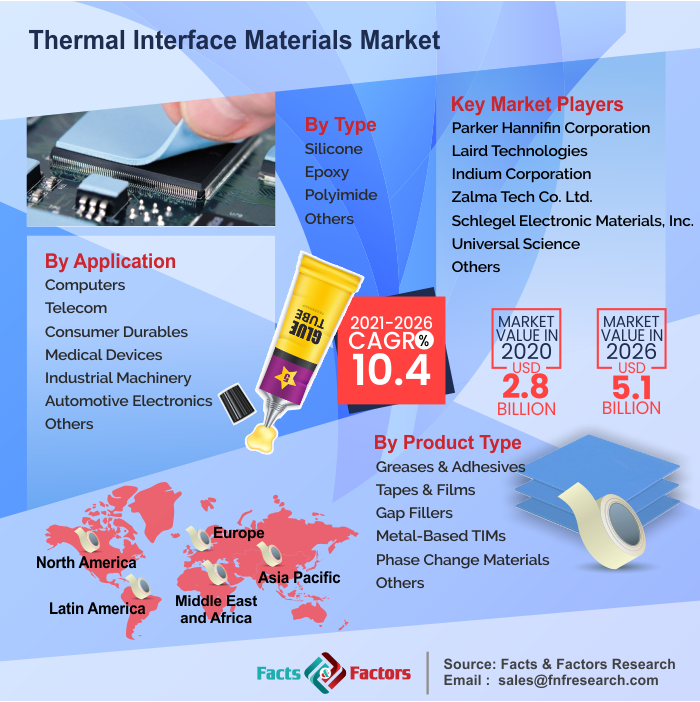
      Fig.1	Product Picture of Thermal Interface Materials
      Fig.2	Global Thermal Interface Materials Market, 2016 – 2026 (USD Million)
      Fig.3	Global Thermal Interface Materials Market, 2016 – 2026 (Kilo Tons)
      Fig.4	Global Thermal Interface Materials Market Absolute Revenue Opportunity, 2016 – 2026 (USD Million)
      Fig.5	Global Thermal Interface Materials Market Incremental Revenue Opportunity, 2020 – 2026 (USD Million)
      Fig.6	Global Thermal Interface Materials Market Share, by Type, 2020 & 2026 (USD Million)
      Fig.7	Global Thermal Interface Materials Market Share, by Type, 2020 & 2026 (Kilo Tons)
      Fig.8	Global Silicone Thermal Interface Materials Market, 2016 – 2026 (USD Million)
      Fig.9	Global Silicone Thermal Interface Materials Market, 2016 – 2026 (Kilo Tons)
      Fig.10	Global Epoxy Thermal Interface Materials Market, 2016 – 2026 (USD Million)
      Fig.11	Global Epoxy Thermal Interface Materials Market, 2016 – 2026 (Kilo Tons)
      Fig.12	Global Polyimide Thermal Interface Materials Market, 2016 – 2026 (USD Million)
      Fig.13	Global Polyimide Thermal Interface Materials Market, 2016 – 2026 (Kilo Tons)
      Fig.14	Global Others Thermal Interface Materials Market, 2016 – 2026 (USD Million)
      Fig.15	Global Others Thermal Interface Materials Market, 2016 – 2026 (Kilo Tons)
      Fig.16	Global Thermal Interface Materials Market Share, by Product Type, 2020 & 2026 (USD Million)
      Fig.17	Global Thermal Interface Materials Market Share, by Product Type, 2020 & 2026 (Kilo Tons)
      Fig.18	Global Greases & Adhesives Thermal Interface Materials Market, 2016 – 2026 (USD Million)
      Fig.19	Global Greases & Adhesives Thermal Interface Materials Market, 2016 – 2026 (Kilo Tons)
      Fig.20	Global Tapes & Films Thermal Interface Materials Market, 2016 – 2026 (USD Million)
      Fig.21	Global Tapes & Films Thermal Interface Materials Market, 2016 – 2026 (Kilo Tons)
      Fig.22	Global Gap Fillers Thermal Interface Materials Market, 2016 – 2026 (USD Million)
      Fig.23	Global Gap Fillers Thermal Interface Materials Market, 2016 – 2026 (Kilo Tons)
      Fig.24	Global Metal-Based TIMs Thermal Interface Materials Market, 2016 – 2026 (USD Million)
      Fig.25	Global Metal-Based TIMs Thermal Interface Materials Market, 2016 – 2026 (Kilo Tons)
      Fig.26	Global Phase Change Materials Thermal Interface Materials Market, 2016 – 2026 (USD Million)
      Fig.27	Global Phase Change Materials Thermal Interface Materials Market, 2016 – 2026 (Kilo Tons)
      Fig.28	Global Others Thermal Interface Materials Market, 2016 – 2026 (USD Million)
      Fig.29	Global Others Thermal Interface Materials Market, 2016 – 2026 (Kilo Tons)
      Fig.30	Global Thermal Interface Materials Market Share, by Application, 2020 & 2026 (USD Million)
      Fig.31	Global Thermal Interface Materials Market Share, by Application, 2020 & 2026 (Kilo Tons)
      Fig.32	Global Computers Thermal Interface Materials Market, 2016 – 2026 (USD Million)
      Fig.33	Global Computers Thermal Interface Materials Market, 2016 – 2026 (Kilo Tons)
      Fig.34	Global Telecom Thermal Interface Materials Market, 2016 – 2026 (USD Million)
      Fig.35	Global Telecom Thermal Interface Materials Market, 2016 – 2026 (Kilo Tons)
      Fig.36	Global Consumer Durables Thermal Interface Materials Market, 2016 – 2026 (USD Million)
      Fig.37	Global Consumer Durables Thermal Interface Materials Market, 2016 – 2026 (Kilo Tons)
      Fig.38	Global Medical Devices Thermal Interface Materials Market, 2016 – 2026 (USD Million)
      Fig.39	Global Medical Devices Thermal Interface Materials Market, 2016 – 2026 (Kilo Tons)
      Fig.40	Global Industrial Machinery Thermal Interface Materials Market, 2016 – 2026 (USD Million)
      Fig.41	Global Industrial Machinery Thermal Interface Materials Market, 2016 – 2026 (Kilo Tons)
      Fig.42	Global Automotive Electronics Thermal Interface Materials Market, 2016 – 2026 (USD Million)
      Fig.43	Global Automotive Electronics Thermal Interface Materials Market, 2016 – 2026 (Kilo Tons)
      Fig.44	Global Others Thermal Interface Materials Market, 2016 – 2026 (USD Million)
      Fig.45	Global Others Thermal Interface Materials Market, 2016 – 2026 (Kilo Tons)
      Fig.46	Global Thermal Interface Materials Market Share, by Region, 2020 & 2026 (USD Million)
      Fig.47	Global Thermal Interface Materials Market Share, by Region, 2020 & 2026 (Kilo Tons)
      Fig.48	North America Thermal Interface Materials Market, 2016 – 2026 (USD Million)
      Fig.49	North America Thermal Interface Materials Market, 2016 – 2026 (Kilo Tons)
      Fig.50	U.S. Thermal Interface Materials Market, 2016 – 2026 (USD Million)
      Fig.51	U.S. Thermal Interface Materials  Market, 2016 – 2026 (Kilo Tons)
      Fig.52	Canada Thermal Interface Materials Market, 2016 – 2026 (USD Million)
      Fig.53	Canada Thermal Interface Materials  Market, 2016 – 2026 (Kilo Tons)
      Fig.54	Europe Thermal Interface Materials Market, 2016 – 2026 (USD Million)
      Fig.55	Europe Thermal Interface Materials Market, 2016 – 2026 (Kilo Tons)
      Fig.56	Germany Thermal Interface Materials Market, 2016 – 2026 (USD Million)
      Fig.57	Germany Thermal Interface Materials  Market, 2016 – 2026 (Kilo Tons)
      Fig.58	France Thermal Interface Materials Market, 2016 – 2026 (USD Million)
      Fig.59	France Thermal Interface Materials  Market, 2016 – 2026 (Kilo Tons)
      Fig.60	U.K. Thermal Interface Materials Market, 2016 – 2026 (USD Million)
      Fig.61	U.K. Thermal Interface Materials  Market, 2016 – 2026 (Kilo Tons)
      Fig.62	Italy Thermal Interface Materials Market, 2016 – 2026 (USD Million)
      Fig.63	Italy Thermal Interface Materials  Market, 2016 – 2026 (Kilo Tons)
      Fig.64	Spain Thermal Interface Materials Market, 2016 – 2026 (USD Million)
      Fig.65	Spain Thermal Interface Materials  Market, 2016 – 2026 (Kilo Tons)
      Fig.66	Rest of Europe Thermal Interface Materials Market, 2016 – 2026 (USD Million)
      Fig.67	Rest of Europe Thermal Interface Materials  Market, 2016 – 2026 (Kilo Tons)
      Fig.68	Asia Pacific Thermal Interface Materials Market, 2016 – 2026 (USD Million)
      Fig.69	Asia Pacific Thermal Interface Materials Market, 2016 – 2026 (Kilo Tons)
      Fig.70	China Thermal Interface Materials Market, 2016 – 2026 (USD Million)
      Fig.71	China Thermal Interface Materials  Market, 2016 – 2026 (Kilo Tons)
      Fig.72	Japan Thermal Interface Materials Market, 2016 – 2026 (USD Million)
      Fig.73	Japan Thermal Interface Materials  Market, 2016 – 2026 (Kilo Tons)
      Fig.74	India Thermal Interface Materials Market, 2016 – 2026 (USD Million)
      Fig.75	India Thermal Interface Materials  Market, 2016 – 2026 (Kilo Tons)
      Fig.76	South  Korea Thermal Interface Materials Market, 2016 – 2026 (USD Million)
      Fig.77	South  Korea Thermal Interface Materials  Market, 2016 – 2026 (Kilo Tons)
      Fig.78	South-East Asia Thermal Interface Materials Market, 2016 – 2026 (USD Million)
      Fig.79	South-East Asia Thermal Interface Materials  Market, 2016 – 2026 (Kilo Tons)
      Fig.80	Rest of Asia Pacific Thermal Interface Materials Market, 2016 – 2026 (USD Million)
      Fig.81	Rest of Asia Pacific Thermal Interface Materials  Market, 2016 – 2026 (Kilo Tons)
      Fig.82	Latin America Thermal Interface Materials Market, 2016 – 2026 (USD Million)
      Fig.83	Latin America Thermal Interface Materials Market, 2016 – 2026 (Kilo Tons)
      Fig.84	Brazil Thermal Interface Materials Market, 2016 – 2026 (USD Million)
      Fig.85	Brazil Thermal Interface Materials  Market, 2016 – 2026 (Kilo Tons)
      Fig.86	Mexico Thermal Interface Materials Market, 2016 – 2026 (USD Million)
      Fig.87	Mexico Thermal Interface Materials  Market, 2016 – 2026 (Kilo Tons)
      Fig.88	Rest of Latin America Thermal Interface Materials Market, 2016 – 2026 (USD Million)
      Fig.89	Rest of Latin America Thermal Interface Materials  Market, 2016 – 2026 (Kilo Tons)
      Fig.90	The Middle-East and Africa Thermal Interface Materials Market, 2016 – 2026 (USD Million)
      Fig.91	The Middle-East and Africa Thermal Interface Materials Market, 2016 – 2026 (Kilo Tons)
      Fig.92	GCC Countries Thermal Interface Materials Market, 2016 – 2026 (USD Million)
      Fig.93	GCC Countries Thermal Interface Materials  Market, 2016 – 2026 (Kilo Tons)
      Fig.94	South Africa Thermal Interface Materials Market, 2016 – 2026 (USD Million)
      Fig.95	South Africa Thermal Interface Materials  Market, 2016 – 2026 (Kilo Tons)
      Fig.96	Rest of Middle-East Africa Thermal Interface Materials Market, 2016 – 2026 (USD Million)
      Fig.97	Rest of Middle-East Africa Thermal Interface Materials  Market, 2016 – 2026 (Kilo Tons)
      Fig.98	Global Thermal Interface Materials Production and Consumption, 2016 – 2026 (Kilo Tons)
      Fig.99	North America Thermal Interface Materials Production and Consumption, 2016 – 2026 (USD Million) (Kilo Tons)
      Fig.100	Europe Thermal Interface Materials Production and Consumption, 2016 – 2026 (USD Million) (Kilo Tons)
      Fig.101	Asia Pacific Thermal Interface Materials Production and Consumption, 2016 – 2026 (USD Million) (Kilo Tons)
      Fig.102	Latin America Thermal Interface Materials Production and Consumption, 2016 – 2026 (USD Million) (Kilo Tons)
      Fig.103	The Middle-East and Africa Thermal Interface Materials Production and Consumption, 2016 – 2026 (USD Million) (Kilo Tons)
      Fig.104	Competitor Market Share – Revenue
      Fig.105	Competitor Market Share – Volume
      Fig.106	Honeywell International Inc. Revenue and Growth Rate
      Fig.107	Honeywell International Inc. Market Share
      Fig.108	The 3M Company Revenue and Growth Rate
      Fig.109	The 3M Company Market Share
      Fig.110	Henkel AG & Co. KGaA Revenue and Growth Rate
      Fig.111	Henkel AG & Co. KGaA Market Share
      Fig.112	Parker Hannifin Corporation Revenue and Growth Rate
      Fig.113	Parker Hannifin Corporation Market Share
      Fig.114	Dow Corning Corporation Revenue and Growth Rate
      Fig.115	Dow Corning Corporation Market Share
      Fig.116	Laird Technologies Revenue and Growth Rate
      Fig.117	Laird Technologies Market Share
      Fig.118	Momentive Performance Materials Revenue and Growth Rate
      Fig.119	Momentive Performance Materials Market Share
      Fig.120	Indim Corporation Revenue and Growth Rate
      Fig.121	Indim Corporation Market Share
      Fig.122	Wakefield-Vette, Inc. Revenue and Growth Rate
      Fig.123	Wakefield-Vette, Inc. Market Share
      Fig.124	Zalma Tech Co. Ltd. Revenue and Growth Rate
      Fig.125	Zalma Tech Co. Ltd. Market Share
      Fig.126	Timtronics Revenue and Growth Rate
      Fig.127	Timtronics Market Share
      Fig.128	Schlegel Electronic Materials, Inc. Revenue and Growth Rate
      Fig.129	Schlegel Electronic Materials, Inc. Market Share
      Fig.130	Aremco Products Inc. Revenue and Growth Rate
      Fig.131	Aremco Products Inc. Market Share
      Fig.132	Universal Science Revenue and Growth Rate
      Fig.133	Universal Science Market Share
      Fig.134	LORD Corporation Revenue and Growth Rate
      Fig.135	LORD Corporation Market Share
      Fig.136	Master Bond Inc. Revenue and Growth Rate
      Fig.137	Master Bond Inc. Market Share
      Fig.138	RBC Industries, Inc. Revenue and Growth Rate
      Fig.139	RBC Industries, Inc. Market Share
      Fig.140	Electrolube Limited Revenue and Growth Rate
      Fig.141	Electrolube Limited Market Share
      Fig.142	Semikron Revenue and Growth Rate
      Fig.143	Semikron Market Share
      Fig.144	Fuji Polymer Industries Co., Ltd. Revenue and Growth Rate
      Fig.145	Fuji Polymer Industries Co., Ltd. Market Share
      Fig.146	Shin-Etsu Chemical Co. Ltd. Revenue and Growth Rate
      Fig.147	Shin-Etsu Chemical Co. Ltd. Market Share
      Fig.148	AIM Specialty Materials Revenue and Growth Rate
      Fig.149	AIM Specialty Materials Market Share
      Fig.150	AOS Thermal Compounds LLC Revenue and Growth Rate
      Fig.151	AOS Thermal Compounds LLC Market Share
      Fig.152	DK Thermal Revenue and Growth Rate
      Fig.153	DK Thermal Market Share
      Fig.154	GrafTech International Ltd. Revenue and Growth Rate
      Fig.155	GrafTech International Ltd. Market Share
      Fig.156	Others Revenue and Growth Rate
      Fig.157	Others Market Share
      Fig.158	Market Dynamics
      Fig.159	Global Thermal Interface Materials – Value Chain Analysis
      Fig.160	Key Mandates and Regulations
      Fig.161	Technology Roadmap and Timeline
      Fig.162	Market Attractiveness Analysis – By Type
      Fig.163	Market Attractiveness Analysis – By Product Type
      Fig.164	Market Attractiveness Analysis – By Application
      Fig.165	Market Attractiveness Analysis – By Region
      Fig.166	Manufacturing Cost Structure of Thermal Interface Materials
      Fig.167	Thermal Interface Materials Industrial Chain Analysis
      Fig.168	Market Channels
      Fig.169	Marketing Channel Development Trend
      Fig.170	Growth in World Gross Product, 2008-2018
      

      List of Tables

      	
      Table 1	Global Thermal Interface Materials Market, 2020 & 2026 (USD Million)
      Table 2	Global Thermal Interface Materials Market, by Type, 2016 – 2026 (USD Million)
      Table 3	Global Thermal Interface Materials Market, by Type, 2016 – 2026 (Kilo Tons)
      Table 4	Global Thermal Interface Materials Market, by Product Type, 2016 – 2026 (USD Million)
      Table 5	Global Thermal Interface Materials Market, by Product Type, 2016 – 2026 (Kilo Tons)
      Table 6	Global Thermal Interface Materials Market, by Application, 2016 – 2026 (USD Million)
      Table 7	Global Thermal Interface Materials Market, by Application, 2016 – 2026 (Kilo Tons)
      Table 8	Global Thermal Interface Materials Market, by Region, 2016 – 2026 (USD Million)
      Table 9 Global Thermal Interface Materials Market, by Region, 2016 – 2026 (Kilo Tons)
      Table 10 North America Thermal Interface Materials Market, by Country, 2016 – 2026 (USD Million)
      Table 11 North America Thermal Interface Materials Market, by Country, 2016 – 2026 (Kilo Tons)
      Table 12 North America Thermal Interface Materials Market, by Type, 2016 – 2026 (USD Million)
      Table 13 North America Thermal Interface Materials Market, by Type, 2016 – 2026 (Kilo Tons)
      Table 14 North America Thermal Interface Materials Market, by Product Type, 2016 – 2026 (USD Million)
      Table 15 North America Thermal Interface Materials Market, by Product Type, 2016 – 2026 (Kilo Tons)
      Table 16 North America Thermal Interface Materials Market, by Application, 2016 – 2026 (USD Million)
      Table 17 North America Thermal Interface Materials Market, by Application, 2016 – 2026 (Kilo Tons)
      Table 18 Europe Thermal Interface Materials Market, by Country, 2016 – 2026 (USD Million)
      Table 19 Europe Thermal Interface Materials Market, by Country, 2016 – 2026 (Kilo Tons)
      Table 20 Europe Thermal Interface Materials Market, by Type, 2016 – 2026 (USD Million)
      Table 21 Europe Thermal Interface Materials Market, by Type, 2016 – 2026 (Kilo Tons)
      Table 22 Europe Thermal Interface Materials Market, by Product Type, 2016 – 2026 (USD Million)
      Table 23 Europe Thermal Interface Materials Market, by Product Type, 2016 – 2026 (Kilo Tons)
      Table 24 Europe Thermal Interface Materials Market, by Application, 2016 – 2026 (USD Million)
      Table 25 Europe Thermal Interface Materials Market, by Application, 2016 – 2026 (Kilo Tons)
      Table 26 Asia Pacific Thermal Interface Materials Market, by Country, 2016 – 2026 (USD Million)
      Table 27 Asia Pacific Thermal Interface Materials Market, by Country, 2016 – 2026 (Kilo Tons)
      Table 28 Asia Pacific Thermal Interface Materials Market, by Type, 2016 – 2026 (USD Million)
      Table 29 Asia Pacific Thermal Interface Materials Market, by Type, 2016 – 2026 (Kilo Tons)
      Table 30 Asia Pacific Thermal Interface Materials Market, by Product Type, 2016 – 2026 (USD Million)
      Table 31 Asia Pacific Thermal Interface Materials Market, by Product Type, 2016 – 2026 (Kilo Tons)
      Table 32 Asia Pacific Thermal Interface Materials Market, by Application, 2016 – 2026 (USD Million)
      Table 33 Asia Pacific Thermal Interface Materials Market, by Application, 2016 – 2026 (Kilo Tons)
      Table 34 Latin America Thermal Interface Materials Market, by Country, 2016 – 2026 (USD Million)
      Table 35 Latin America Thermal Interface Materials Market, by Country, 2016 – 2026 (Kilo Tons)
      Table 36 Latin America Thermal Interface Materials Market, by Type, 2016 – 2026 (USD Million)
      Table 37 Latin America Thermal Interface Materials Market, by Type, 2016 – 2026 (Kilo Tons)
      Table 38 Latin America Thermal Interface Materials Market, by Product Type, 2016 – 2026 (USD Million)
      Table 39 Latin America Thermal Interface Materials Market, by Product Type, 2016 – 2026 (Kilo Tons)
      Table 40 Latin America Thermal Interface Materials Market, by Application, 2016 – 2026 (USD Million)
      Table 41 Latin America Thermal Interface Materials Market, by Application, 2016 – 2026 (Kilo Tons)
      Table 42 The Middle-East and Africa Thermal Interface Materials Market, by Country, 2016 – 2026 (USD Million)
      Table 43 The Middle-East and Africa Thermal Interface Materials Market, by Country, 2016 – 2026 (Kilo Tons)
      Table 44 The Middle-East and Africa Thermal Interface Materials Market, by Type, 2016 – 2026 (USD Million)
      Table 45 The Middle-East and Africa Thermal Interface Materials Market, by Type, 2016 – 2026 (Kilo Tons)
      Table 46 The Middle-East and Africa Thermal Interface Materials Market, by Product Type, 2016 – 2026 (USD Million)
      Table 47 The Middle-East and Africa Thermal Interface Materials Market, by Product Type, 2016 – 2026 (Kilo Tons)
      Table 48 The Middle-East and Africa Thermal Interface Materials Market, by Application, 2016 – 2026 (USD Million)
      Table 49 The Middle-East and Africa Thermal Interface Materials Market, by Application, 2016 – 2026 (Kilo Tons)
      Table 50 North America Thermal Interface Materials Production, Consumption, Export, Import, 2016 – 2019
      Table 51 Europe Thermal Interface Materials Production, Consumption, Export, Import, 2016 – 2019
      Table 52 Asia Pacific Thermal Interface Materials Production, Consumption, Export, Import, 2016 – 2019
      Table 53 Latin America Thermal Interface Materials Production, Consumption, Export, Import, 2016 – 2019
      Table 54 The Middle-East and Africa Thermal Interface Materials Production, Consumption, Export, Import, 2016 – 2019
      Table 55 Global Thermal Interface Materials Market - Company Revenue Analysis, 2016 – 2019 (USD Million)
      Table 56 Global Thermal Interface Materials Market - Company Revenue Share Analysis, 2016 – 2019 (%)
      Table 57 Global Thermal Interface Materials Market - Company Volume Analysis, 2016 – 2019 (Kilo Tons)
      Table 58 Global Thermal Interface Materials Market - Company Volume Share Analysis, 2016 – 2019 (%)
      Table 59 Acquisitions and Mergers
      Table 60 Market Drivers – Impact Analysis
      Table 61 Market Restraints
      Table 62 Market Opportunities
      Table 63 Production Base and Market Concentration Rate of Raw Material
      Table 64 Key Suppliers of Raw Materials
      Table 65 Raw Materials Sources of Thermal Interface Materials Major Manufacturers
      Table 66 Major Buyers of Thermal Interface Materials
      Table 67 Distributors/Traders of Thermal Interface Materials by Region
      

Industry Major Market Players

  • The 3M Company
  • Parker Hannifin Corporation
  • Laird Technologies
  • Indium Corporation
  • Zalma Tech Co. Ltd.
  • Schlegel Electronic Materials Inc.
  • Universal Science
  • Master Bond Inc.
  • Electrolube Limited
  • Fuji Polymer Industries Co. Ltd.
  • AIM Specialty Materials
  • DK Thermal
  • GrafTech International Ltd.
  • AOS Thermal Compounds LLC
  • Shin-Etsu Chemical Co. Ltd.
  • Semikron
  • RBC Industries Inc.
  • LORD Corporation
  • Aremco Products Inc.
  • Timtronics
  • Wakefield-Vette Inc.
  • Momentive Performance Materials
  • Dow Corning Corporation
  • Henkel AG & Co. KGaA
  • Honeywell International Inc.