Search Market Research Report

Discover Our Latest Reports
Discover Our Featured Reports
Discover Top Selling Reports

Smart Lighting Market Size, Share, Growth, Trends Analysis Forecast 2020-2026

report img

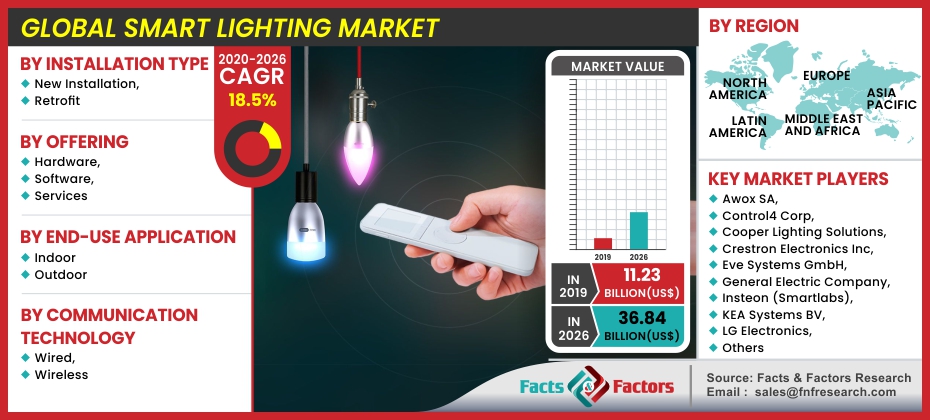
Smart Lighting Market By Installation Type (New Installation, and Retrofit), By Offering (Hardware, Software, and Services), By End-use Application (Indoor and Outdoor), and By Communication Technology (Wired, and Wireless): Global Industry Perspective, Comprehensive Analysis, and Forecast, 2020 – 2026

Industry Insights

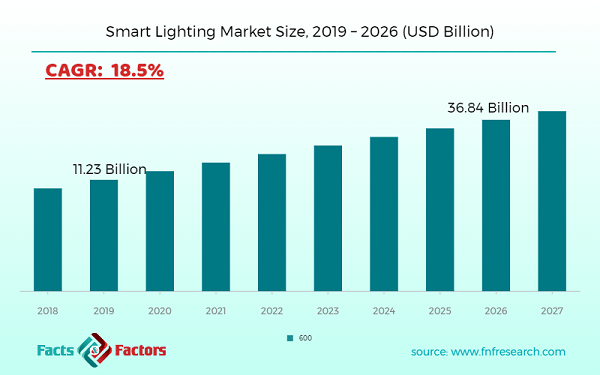
[195+ Pages Report] According to the report published by Facts and Factors, the global smart lighting market size was valued around USD 11.23 billion in 2019 and is expected to grow to around USD 36.84 billion in 2026 with a compound annual growth rate (CAGR) of roughly 18.5% between 2020 and 2026. The report analyzes the global smart lighting market drivers, challenges, and the impact they have on the demands during the forecast period. In addition, the report explores emerging opportunities in the smart lighting market.

Smart Lighting Market Size

To know more about this report | Request Free Sample Copy

logoMarket Overview

Smart Lighting is one of the most important lighting solutions for offering solutions for both outdoor and indoor uses using the latest upgraded technology products like LEDs, fluorescent bulbs, Luminaires, and other lighting solutions. When opposed to conventional incandescent and halogen lighting, smart lighting has greater energy efficiency. The key aim is to have longevity in terms of breakage resistance and vibration immunity. Street lighting, tunnel and bridge lighting, architectural, industrial, office lighting, and projection lighting are all examples of smart lighting applications. Smart lighting is a lighting industry innovation that uses a control system to intelligently control light based on parameters such as occupancy, movement, temperature, amount of natural light, and so on. Lighting uses a lot of electricity, so it's expensive.

Industries and government agencies are concentrating on lowering energy consumption by replacing obsolete and advanced lighting control systems with more powerful and advanced lighting systems. Automated lighting control not only provides cost-effective and versatile lighting, but it also keeps track of the users' tasks. As a result, the market for smart lighting systems is skyrocketing. Wireless networking, for example, is a modern technology that is rapidly gaining traction. Smart lighting may be used in a range of environments, including residential, government buildings, manufacturing, and automobiles.

logoIndustry Growth Factors

Government regulations around the world are pushing the smart lighting industry by restricting the use of outdated lighting technologies. Governments all over the world are trying to phase out outdated lamps like incandescent and halogen lamps and promote the use of environmentally sustainable lighting. Tungsten halogen and compact fluorescent lamps will be phased out of use in Europe by 2020, according to new EU regulations. According to the current Ecodesign Law, lamps must have a maximum standby capacity of 0.5W and a minimum energy requirement of 85 lumens. This will promote the selling of energy-saving lamps in the country. Governments around the world are also providing tax cuts and incentives to facilitate the use of more energy-efficient lighting technologies. This is a significant factor in the market's expansion.

Global Smart Lighting Market

To know more about this report | Request Free Sample Copy

The market's adoption has been driven by the rapid increase in the number of smart city development projects and investments. When the world becomes more industrialized and urbanized, so does the amount of energy consumed in cities. Cities are thought to consume more than 60% of the world's resources, with lighting alone accounting for 19% of global electricity consumption. Governments are dependent on advanced technology technologies to leverage assets and resources more efficiently in order to reduce energy usage and effectively manage resources. This is promoting the growth of smart city projects around the world, which will help the smart lighting industry meet demand.

However, when compared to conventional lighting alternatives, the massive prices of smart lighting solutions are a major stumbling block to the market's growth. Furthermore, the security problems surrounding the use of wired lighting and smart lighting systems will stymie market expansion.

logoGlobal Smart Lighting Market: Segmentation

Global smart lighting market is segmented into four notable segments which are offering, communication technology, installation type, and application type.

The industry is divided into three groups based on what they offer: hardware, software, and services. In 2019, the hardware segment is projected to expand at the fastest CAGR, reaching USD Billion in the forecast period of 2019 to 2026. Because of the increased use of LED lighting items such as luminaires, bulbs, and lamps for indoor and outdoor spaces, as well as increasing awareness about energy usage in LED lighting, the hardware segment is expected to dominate the global smart lighting market.

The market is divided into two groups of installations: new installations and retrofit installations. In the forecast period of 2019 to 2026, the retrofit installation category has the highest CAGR. Due to its lower installation cost as compared to new fixtures, the retrofit installation segment is expected to dominate the global smart lighting market.

The market is divided into wired and wireless network technology segments based on communication technology. In the forecast period of 2019 to 2026, wired technologies are projected to develop at the fastest CAGR. Wired infrastructure is gaining a greater share of the market because it is 20 percent to 30 percent less costly than wireless and uses less electricity. Due to growing accessibility of open source software and advances in wireless technologies, as well as rising demand for wireless smart lighting systems for both building and home automation, wireless technology is expected to develop at the fastest CAGR during the forecasting era.

The market is divided into two categories based on application type: outdoor application and indoor application.

logoGlobal Smart Lighting Market: Regional Analysis

Based on regions, the global Smart Lighting market can be divided into five main regions.

The Asia-Pacific area has seen substantial growth in the smart lighting industry over recent years and is projected to rise quickly over the predicted time span. Smart technology in the region is generated and developed; scaled up the smart lighting platform in both the private and trade sectors; and growing public infrastructure investments are raising demand growth in the region.

GSMA predicts that China will make up about one third of the world IoT connections by 2025 by about 4.1 billion IoT connections. The largest trend beneficiary over the projected timeframe is predicted to be smart lighting systems. The smart device technologies are being launched by technology giants in the region, including Tencent, JD, Baidu and Alibaba. In these giants, the majority of China's market share is spread. These brands are trendy and can fuel business demand.

logoReport Scope

Report Attribute

Details

Market Size in 2019

USD 11.23 Billion

Projected Market Size in 2026

USD 36.84 Billion

CAGR Growth Rate

18.5%

Base Year

2019

Forecast Years

2020-2026

Key Market Players

Awox SA, Control4 Corp, Cooper Lighting Solutions, Crestron Electronics Inc, Eve Systems GmbH, General Electric Company, Insteon (Smartlabs), KEA Systems BV, LG Electronics, Lutron Electronics, Sengled USA Inc, Signify Holdings, Wiz Connected Lighting, Wyze Labs Inc., and Others.

Key Segment

By Installation Type, By Offering, By End-use Application, and By Region

Major Regions Covered

North America, Europe, Asia Pacific, Latin America, and the Middle East & Africa

Purchase Options

Request customized purchase options to meet your research needs. Explore purchase options

logoSome of the key players in the Smart Lighting market

  • Awox SA
  • Control4 Corp
  • Cooper Lighting Solutions
  • Crestron Electronics Inc
  • Eve Systems GmbH
  • General Electric Company
  • Insteon (Smartlabs)
  • KEA Systems BV
  • LG Electronics
  • Lutron Electronics
  • Sengled USA Inc
  • Signify Holdings
  • Wiz Connected Lighting
  • Wyze Labs Inc.

The global Smart Lighting market is segmented as follows:

logoBy Installation Type:

  • New Installation
  • Retrofit

logoBy Offering:

  • Hardware
  • Lights & Luminaires
  • Smart bulbs
  • Fixtures
  • Lighting Controls
  • LED drivers & ballasts
  • Sensors
  • Switches
  • Manual on/off switches
  • Electronic switches
  • Dimmers
  • Wired dimmers
  • Wireless dimmers
  • Relay units
  • Gateways
  • Software
  • Local/Web Based
  • Cloud Based
  •  Services
  • Pre-installation Services
  • Post-installation Services

logoBy End-use Application:

  • Indoor
  • Residential
  • Commercial
  • Industrial
  • Others
  • Outdoor
  • Highways & Roadways Lighting
  • Architectural Lighting
  • Lighting for Public Places

logoBy Communication Technology:

  • Wired
  • DALI
  • PLC
  • POE
  • Wired Hybrid Protocols
  • Wireless
  • ZigBee
  • Bluetooth/BLE
  • EnOcean
  • Wi-Fi
  • 6LoWPAN
  • Wireless Hybrid Protocols

logoBy Regional Segment Analysis

  • North America
    • U.S.
    • Canada
  • Europe
    • U.K.
    • France
    • Germany
  • The Asia Pacific
    • China
    • Japan
    • India
  • Latin America
    • Brazil
    • Mexico
  • The Middle East and Africa

Table of Content

  1. Chapter 1 Executive Summary
    1. 1.1. Introduction of Smart Lighting
    2. 1.2. Global Smart Lighting Market, 2019 & 2026 (USD Billion)
    3. 1.3. COVID-19 Impacts on Smart Lighting Market
      1. 1.3.1. Short Term COVID-19 Impact on the Market
      2. 1.3.2. Mid-Term COVID-19 Impact on the Market
      3. 1.3.3. Long-Term COVID-19 Impact on the Market
    4. 1.4. Business Strategies and Recommendations
    5. 1.5. Global Smart Lighting Market, 2016 – 2026 (USD Billion)
    6. 1.6. Global Smart Lighting Market Absolute Revenue Opportunity, 2016 – 2026 (USD Billion)
    7. 1.7. Global Smart Lighting Market Incremental Revenue Opportunity, 2020 – 2026 (USD Billion)
  2. Chapter 2 Smart Lighting Market – Installation Type Analysis
    1. 2.1. Global Smart Lighting Market – Installation Type Overview
    2. 2.2. Global Smart Lighting Market Share, by Installation Type, 2019 & 2026 (USD Billion)
    3. 2.3. New Installation
      1. 2.3.1. Global New Installation Smart Lighting Market, 2016 – 2026 (USD Billion)
    4. 2.4. Retrofit
      1. 2.4.1. Global Retrofit Smart Lighting Market, 2016 – 2026 (USD Billion)
  3. Chapter 3 Smart Lighting Market – Offering Analysis
    1. 3.1. Global Smart Lighting Market – Offering Overview
    2. 3.2. Global Smart Lighting Market Share, by Offering, 2019 & 2026 (USD Billion)
    3. 3.3. Hardware
      1. 3.3.1. Global Hardware Smart Lighting Market, 2016 – 2026 (USD Billion)
    4. 3.4. Software
      1. 3.4.1. Global Software Smart Lighting Market, 2016 – 2026 (USD Billion)
    5. 3.5. Services
      1. 3.5.1. Global Services Smart Lighting Market, 2016 – 2026 (USD Billion)
  4. Chapter 4 Smart Lighting Market – End-use Application Analysis
    1. 4.1. Global Smart Lighting Market – End-use Application Overview
    2. 4.2. Global Smart Lighting Market Share, by End-use Application, 2019 & 2026 (USD Billion)
    3. 4.3. Indoor
      1. 4.3.1. Global Indoor Smart Lighting Market, 2016 – 2026 (USD Billion)
    4. 4.4. Outdoor
      1. 4.4.1. Global Outdoor Smart Lighting Market, 2016 – 2026 (USD Billion)
  5. Chapter 5 Smart Lighting Market – Communication Technology Analysis
    1. 5.1. Global Smart Lighting Market – Communication Technology Overview
    2. 5.2. Global Smart Lighting Market Share, by Communication Technology, 2019 & 2026 (USD Billion)
    3. 5.3. Wired
      1. 5.3.1. Global Wired Smart Lighting Market, 2016 – 2026 (USD Billion)
    4. 5.4. Wireless
      1. 5.4.1. Global Wireless Smart Lighting Market, 2016 – 2026 (USD Billion)
  6. Chapter 6 Smart Lighting Market – Regional Analysis
    1. 6.1. Global Smart Lighting Market Regional Overview
    2. 6.2. Global Smart Lighting Market Share, by Region, 2019 & 2026 (USD Billion)
    3. 6.3. North America
      1. 6.3.1. North America Smart Lighting Market, 2016 – 2026 (USD Billion)
      2. 6.3.2. North America Smart Lighting Market, by Installation Type, 2016 – 2026
      3. 6.3.3. North America Smart Lighting Market, by Offering, 2016 – 2026
      4. 6.3.4. North America Smart Lighting Market, by End-use Application, 2016 – 2026
      5. 6.3.5. North America Smart Lighting Market, by Communication Technology, 2016 – 2026
      6. 6.3.6. U.S.
      7. 6.3.7. Canada
    4. 6.4. Europe
      1. 6.4.1. Europe Smart Lighting Market, 2016 – 2026 (USD Billion)
      2. 6.4.2. Europe Smart Lighting Market, by Installation Type, 2016 – 2026
      3. 6.4.3. Europe Smart Lighting Market, by Offering, 2016 – 2026
      4. 6.4.4. Europe Smart Lighting Market, by End-use Application, 2016 – 2026
      5. 6.4.5. Europe Smart Lighting Market, by Communication Technology, 2016 – 2026
      6. 6.4.6. Germany
      7. 6.4.7. France
      8. 6.4.8. U.K.
      9. 6.4.9. Italy
      10. 6.4.10. Spain
      11. 6.4.11. Rest of Europe
    5. 6.5. Asia Pacific
      1. 6.5.1. Asia Pacific Smart Lighting Market, 2016 – 2026 (USD Billion)
      2. 6.5.2. Asia Pacific Smart Lighting Market, by Installation Type, 2016 – 2026
      3. 6.5.3. Asia Pacific Smart Lighting Market, by Offering, 2016 – 2026
      4. 6.5.4. Asia Pacific Smart Lighting Market, by End-use Application, 2016 – 2026
      5. 6.5.5. Asia Pacific Smart Lighting Market, by Communication Technology, 2016 – 2026
      6. 6.5.6. China
      7. 6.5.7. Japan
      8. 6.5.8. India
      9. 6.5.9. South Korea
      10. 6.5.10. South-East Asia
      11. 6.5.11. Rest of Asia Pacific
    6. 6.6. Latin America
      1. 6.6.1. Latin America Smart Lighting Market, 2016 – 2026 (USD Billion)
      2. 6.6.2. Latin America Smart Lighting Market, by Installation Type, 2016 – 2026
      3. 6.6.3. Latin America Smart Lighting Market, by Offering, 2016 – 2026
      4. 6.6.4. Latin America Smart Lighting Market, by End-use Application, 2016 – 2026
      5. 6.6.5. Latin America Smart Lighting Market, by Communication Technology, 2016 – 2026
      6. 6.6.6. Brazil
      7. 6.6.7. Mexico
      8. 6.6.8. Rest of Latin America
    7. 6.7. The Middle-East and Africa
      1. 6.7.1. The Middle-East and Africa Smart Lighting Market, 2016 – 2026 (USD Billion)
      2. 6.7.2. The Middle-East and Africa Smart Lighting Market, by Installation Type, 2016 – 2026
      3. 6.7.3. The Middle-East and Africa Smart Lighting Market, by Offering, 2016 – 2026
      4. 6.7.4. The Middle-East and Africa Smart Lighting Market, by End-use Application, 2016 – 2026
      5. 6.7.5. The Middle-East and Africa Smart Lighting Market, by Communication Technology, 2016 – 2026
      6. 6.7.6. GCC Countries
      7. 6.7.7. South Africa
      8. 6.7.8. Rest of Middle-East Africa
  7. Chapter 7 Smart Lighting Market – Competitive Landscape
    1. 7.1. Competitor Market Share – Revenue
    2. 7.2. Market Concentration Rate Analysis, Top 3 and Top 5 Players
    3. 7.3. Strategic Developments
      1. 7.3.1. Acquisitions and Mergers
      2. 7.3.2. New Products
      3. 7.3.3. Research & Development Activities
  8. Chapter 8 Company Profiles
    1. 8.1. Awox SA
      1. 8.1.1. Company Overview
      2. 8.1.2. Product/Service Portfolio
      3. 8.1.3. Awox SA Sales, Revenue, and Gross Margin
      4. 8.1.4. Awox SA Revenue and Growth Rate
      5. 8.1.5. Awox SA Market Share
      6. 8.1.6. Recent Initiatives, Funding/VC Activities, and Technological Innovations
    2. 8.2. Control4 Corp
      1. 8.2.1. Company Overview
      2. 8.2.2. Product/Service Portfolio
      3. 8.2.3. Control4 Corp Sales, Revenue, and Gross Margin
      4. 8.2.4. Control4 Corp Revenue and Growth Rate
      5. 8.2.5. Control4 Corp Market Share
      6. 8.2.6. Recent Initiatives, Funding/VC Activities, and Technological Innovations
    3. 8.3. Cooper Lighting Solutions
      1. 8.3.1. Company Overview
      2. 8.3.2. Product/Service Portfolio
      3. 8.3.3. Cooper Lighting Solutions Sales, Revenue, and Gross Margin
      4. 8.3.4. Cooper Lighting Solutions Revenue and Growth Rate
      5. 8.3.5. Cooper Lighting Solutions Market Share
      6. 8.3.6. Recent Initiatives, Funding/VC Activities, and Technological Innovations
    4. 8.4. Crestron Electronics Inc
      1. 8.4.1. Company Overview
      2. 8.4.2. Product/Service Portfolio
      3. 8.4.3. Crestron Electronics Inc Sales, Revenue, and Gross Margin
      4. 8.4.4. Crestron Electronics Inc Revenue and Growth Rate
      5. 8.4.5. Crestron Electronics Inc Market Share
      6. 8.4.6. Recent Initiatives, Funding/VC Activities, and Technological Innovations
    5. 8.5. Eve Systems GmbH
      1. 8.5.1. Company Overview
      2. 8.5.2. Product/Service Portfolio
      3. 8.5.3. Eve Systems GmbH Sales, Revenue, and Gross Margin
      4. 8.5.4. Eve Systems GmbH Revenue and Growth Rate
      5. 8.5.5. Eve Systems GmbH Market Share
      6. 8.5.6. Recent Initiatives, Funding/VC Activities, and Technological Innovations
    6. 8.6. General Electric Company
      1. 8.6.1. Company Overview
      2. 8.6.2. Product/Service Portfolio
      3. 8.6.3. General Electric Company Sales, Revenue, and Gross Margin
      4. 8.6.4. General Electric Company Revenue and Growth Rate
      5. 8.6.5. General Electric Company Market Share
      6. 8.6.6. Recent Initiatives, Funding/VC Activities, and Technological Innovations
    7. 8.7. Insteon (Smartlabs)
      1. 8.7.1. Company Overview
      2. 8.7.2. Product/Service Portfolio
      3. 8.7.3. Insteon (Smartlabs) Sales, Revenue, and Gross Margin
      4. 8.7.4. Insteon (Smartlabs) Revenue and Growth Rate
      5. 8.7.5. Insteon (Smartlabs) Market Share
      6. 8.7.6. Recent Initiatives, Funding/VC Activities, and Technological Innovations
    8. 8.8. KEA Systems BV
      1. 8.8.1. Company Overview
      2. 8.8.2. Product/Service Portfolio
      3. 8.8.3. KEA Systems BV Sales, Revenue, and Gross Margin
      4. 8.8.4. KEA Systems BV Revenue and Growth Rate
      5. 8.8.5. KEA Systems BV Market Share
      6. 8.8.6. Recent Initiatives, Funding/VC Activities, and Technological Innovations
    9. 8.9. LG Electronics
      1. 8.9.1. Company Overview
      2. 8.9.2. Product/Service Portfolio
      3. 8.9.3. LG Electronics Sales, Revenue, and Gross Margin
      4. 8.9.4. LG Electronics Revenue and Growth Rate
      5. 8.9.5. LG Electronics Market Share
      6. 8.9.6. Recent Initiatives, Funding/VC Activities, and Technological Innovations
    10. 8.10. Lutron Electronics
      1. 8.10.1. Company Overview
      2. 8.10.2. Product/Service Portfolio
      3. 8.10.3. Lutron Electronics Sales, Revenue, and Gross Margin
      4. 8.10.4. Lutron Electronics Revenue and Growth Rate
      5. 8.10.5. Lutron Electronics Market Share
      6. 8.10.6. Recent Initiatives, Funding/VC Activities, and Technological Innovations
    11. 8.11. Sengled USA Inc
      1. 8.11.1. Company Overview
      2. 8.11.2. Product/Service Portfolio
      3. 8.11.3. Sengled USA Inc Sales, Revenue, and Gross Margin
      4. 8.11.4. Sengled USA Inc Revenue and Growth Rate
      5. 8.11.5. Sengled USA Inc Market Share
      6. 8.11.6. Recent Initiatives, Funding/VC Activities, and Technological Innovations
    12. 8.12. Signify Holdings
      1. 8.12.1. Company Overview
      2. 8.12.2. Product/Service Portfolio
      3. 8.12.3. Signify Holdings Sales, Revenue, and Gross Margin
      4. 8.12.4. Signify Holdings Revenue and Growth Rate
      5. 8.12.5. Signify Holdings Market Share
      6. 8.12.6. Recent Initiatives, Funding/VC Activities, and Technological Innovations
    13. 8.13. Wiz Connected Lighting
      1. 8.13.1. Company Overview
      2. 8.13.2. Product/Service Portfolio
      3. 8.13.3. Wiz Connected Lighting Sales, Revenue, and Gross Margin
      4. 8.13.4. Wiz Connected Lighting Revenue and Growth Rate
      5. 8.13.5. Wiz Connected Lighting Market Share
      6. 8.13.6. Recent Initiatives, Funding/VC Activities, and Technological Innovations
    14. 8.14. Wyze Labs Inc.
      1. 8.14.1. Company Overview
      2. 8.14.2. Product/Service Portfolio
      3. 8.14.3. Wyze Labs Inc. Sales, Revenue, and Gross Margin
      4. 8.14.4. Wyze Labs Inc. Revenue and Growth Rate
      5. 8.14.5. Wyze Labs Inc. Market Share
      6. 8.14.6. Recent Initiatives, Funding/VC Activities, and Technological Innovations
  9. Chapter 9 Smart Lighting — Industry Analysis
    1. 9.1. Introduction and Taxonomy
    2. 9.2. Smart Lighting Market – Key Trends
      1. 9.2.1. Market Drivers
      2. 9.2.2. Market Restraints
      3. 9.2.3. Market Opportunities
    3. 9.3. Value Chain Analysis
    4. 9.4. Key Mandates and Regulations
    5. 9.5. Technology Roadmap and Timeline
    6. 9.6. Smart Lighting Market – Attractiveness Analysis
      1. 9.6.1. By Installation Type
      2. 9.6.2. By Offering
      3. 9.6.3. By End-use Application
      4. 9.6.4. By Communication Technology
      5. 9.6.5. By Region
  10. Chapter 10 Industrial Chain, Sourcing Strategy, and Downstream Buyers
    1. 10.1. Smart Lighting Industrial Chain Analysis
    2. 10.2. Downstream Buyers
    3. 10.3. Distributors/Traders List
  11. Chapter 11 Marketing Strategy Analysis
    1. 11.1. Marketing Channel
    2. 11.2. Direct Marketing
    3. 11.3. Indirect Marketing
    4. 11.4. Marketing Channel Development Trends
    5. 11.5. Economic/Political Environmental Change
  12. Chapter 12 Report Conclusion & Key Insights
    1. 12.1. Key Insights from Primary Interviews & Surveys Respondents
    2. 12.2. Key Takeaways from Analysts, Consultants, and Industry Leaders
  13. Chapter 13 Research Approach & Methodology
    1. 13.1. Report Description
    2. 13.2. Research Scope
    3. 13.3. Research Methodology
      1. 13.3.1. Secondary Research
      2. 13.3.2. Primary Research
      3. 13.3.3. Statistical Models
      4. 13.3.4. Research Limitations

      List of Figures

      Fig.1 Product Picture of Smart Lighting
      Fig.2 COVID-19 Impacts on Smart Lighting Market
      Fig.3 Business Strategies and Recommendations
      Fig.4 Global Smart Lighting Market, 2016 – 2026 (USD Billion)
      Fig.5 Global Smart Lighting Market Absolute Revenue Opportunity, 2016 – 2026 (USD Billion)
      Fig.6 Global Smart Lighting Market Incremental Revenue Opportunity, 2020 – 2026 (USD Billion)
      Fig.7 Global Smart Lighting Market Share, by Installation Type, 2019 & 2026 (USD Billion)
      Fig.8 Global New Installation Smart Lighting Market, 2016 – 2026 (USD Billion)
      Fig.9 Global Retrofit Smart Lighting Market, 2016 – 2026 (USD Billion)
      Fig.10 Global Smart Lighting Market Share, by Offering, 2019 & 2026 (USD Billion)
      Fig.11 Global Hardware Smart Lighting Market, 2016 – 2026 (USD Billion)
      Fig.12 Global Software Smart Lighting Market, 2016 – 2026 (USD Billion)
      Fig.13 Global Services Smart Lighting Market, 2016 – 2026 (USD Billion)
      Fig.14 Global Smart Lighting Market Share, by End-use Application, 2019 & 2026 (USD Billion)
      Fig.15 Global Indoor Smart Lighting Market, 2016 – 2026 (USD Billion)
      Fig.16 Global Outdoor Smart Lighting Market, 2016 – 2026 (USD Billion)
      Fig.17 Global Smart Lighting Market Share, by Communication Technology, 2019 & 2026 (USD Billion)
      Fig.18 Global Wired Smart Lighting Market, 2016 – 2026 (USD Billion)
      Fig.19 Global Wireless Smart Lighting Market, 2016 – 2026 (USD Billion)
      Fig.20 Global Smart Lighting Market Share, by Region, 2019 & 2026 (USD Billion)
      Fig.21 North America Smart Lighting Market, 2016 – 2026 (USD Billion)
      Fig.22 U.S. Smart Lighting Market, 2016 – 2026 (USD Billion)
      Fig.23 Canada Smart Lighting Market, 2016 – 2026 (USD Billion)
      Fig.24 Europe Smart Lighting Market, 2016 – 2026 (USD Billion)
      Fig.25 Germany Smart Lighting Market, 2016 – 2026 (USD Billion)
      Fig.26 France Smart Lighting Market, 2016 – 2026 (USD Billion)
      Fig.27 U.K. Smart Lighting Market, 2016 – 2026 (USD Billion)
      Fig.28 Italy Smart Lighting Market, 2016 – 2026 (USD Billion)
      Fig.29 Spain Smart Lighting Market, 2016 – 2026 (USD Billion)
      Fig.30 Rest of Europe Smart Lighting Market, 2016 – 2026 (USD Billion)
      Fig.31 Asia Pacific Smart Lighting Market, 2016 – 2026 (USD Billion)
      Fig.32 China Smart Lighting Market, 2016 – 2026 (USD Billion)
      Fig.33 Japan Smart Lighting Market, 2016 – 2026 (USD Billion)
      Fig.34 India Smart Lighting Market, 2016 – 2026 (USD Billion)
      Fig.35 South  Korea Smart Lighting Market, 2016 – 2026 (USD Billion)
      Fig.36 South-East Asia Smart Lighting Market, 2016 – 2026 (USD Billion)
      Fig.37 Rest of Asia Pacific Smart Lighting Market, 2016 – 2026 (USD Billion)
      Fig.38 Latin America Smart Lighting Market, 2016 – 2026 (USD Billion)
      Fig.39 Brazil Smart Lighting Market, 2016 – 2026 (USD Billion)
      Fig.40 Mexico Smart Lighting Market, 2016 – 2026 (USD Billion)
      Fig.41 Rest of Latin America Smart Lighting Market, 2016 – 2026 (USD Billion)
      Fig.42 The Middle-East and Africa Smart Lighting Market, 2016 – 2026 (USD Billion)
      Fig.43 GCC Countries Smart Lighting Market, 2016 – 2026 (USD Billion)
      Fig.44 South Africa Smart Lighting Market, 2016 – 2026 (USD Billion)
      Fig.45 Rest of Middle-East Africa Smart Lighting Market, 2016 – 2026 (USD Billion)
      Fig.46 Competitor Market Share – Revenue
      Fig.47 Awox SA Revenue and Growth Rate
      Fig.48 Awox SA Market Share
      Fig.49 Control4 Corp Revenue and Growth Rate
      Fig.50 Control4 Corp Market Share
      Fig.51 Cooper Lighting Solutions Revenue and Growth Rate
      Fig.52 Cooper Lighting Solutions Market Share
      Fig.53 Crestron Electronics Inc Revenue and Growth Rate
      Fig.54 Crestron Electronics Inc Market Share
      Fig.55 Eve Systems GmbH Revenue and Growth Rate
      Fig.56 Eve Systems GmbH Market Share
      Fig.57 General Electric Company Revenue and Growth Rate
      Fig.58 General Electric Company Market Share
      Fig.59 Insteon (Smartlabs) Revenue and Growth Rate
      Fig.60 Insteon (Smartlabs) Market Share
      Fig.61 KEA Systems BV Revenue and Growth Rate
      Fig.62 KEA Systems BV Market Share
      Fig.63 LG Electronics Revenue and Growth Rate
      Fig.64 LG Electronics Market Share
      Fig.65 Lutron Electronics Revenue and Growth Rate
      Fig.66 Lutron Electronics Market Share
      Fig.67 Sengled USA Inc Revenue and Growth Rate
      Fig.68 Sengled USA Inc Market Share
      Fig.69 Signify Holdings Revenue and Growth Rate
      Fig.70 Signify Holdings Market Share
      Fig.71 Wiz Connected Lighting Revenue and Growth Rate
      Fig.72 Wiz Connected Lighting Market Share
      Fig.73 Wyze Labs Inc. Revenue and Growth Rate
      Fig.74 Wyze Labs Inc. Market Share
      Fig.75 Market Dynamics
      Fig.76 Global Smart Lighting – Value Chain Analysis
      Fig.77 Key Mandates and Regulations
      Fig.78 Technology Roadmap and Timeline
      Fig.79 Market Attractiveness Analysis – By Installation Type
      Fig.80 Market Attractiveness Analysis – By Offering
      Fig.81 Market Attractiveness Analysis – By End-use Application
      Fig.82 Market Attractiveness Analysis – By Communication Technology
      Fig.83 Market Attractiveness Analysis – By Region
      Fig.84 Smart Lighting Industrial Chain Analysis
      Fig.85 Market Channels
      Fig.86 Marketing Channel Development Trend
      Fig.87 Growth in World Gross Product, 2008-2018
      

      List of Tables

      Table 1	Global Smart Lighting Market, 2019 & 2026 (USD Billion)
      Table 2	Global Smart Lighting Market, by Installation Type, 2016 – 2026 (USD Billion)
      Table 3	Global Smart Lighting Market, by Offering, 2016 – 2026 (USD Billion)
      Table 4	Global Smart Lighting Market, by End-use Application, 2016 – 2026 (USD Billion)
      Table 5	Global Smart Lighting Market, by Communication Technology, 2016 – 2026 (USD Billion)
      Table 6	Global Smart Lighting Market, by Region, 2016 – 2026 (USD Billion)
      Table 7	North America Smart Lighting Market, by Country, 2016 – 2026 (USD Billion)
      Table 8	North America Smart Lighting Market, by Installation Type, 2016 – 2026 (USD Billion)
      Table 9	North America Smart Lighting Market, by Offering, 2016 – 2026 (USD Billion)
      Table 10 North America Smart Lighting Market, by End-use Application, 2016 – 2026 (USD Billion)
      Table 11 North America Smart Lighting Market, by Communication Technology, 2016 – 2026 (USD Billion)
      Table 12 Europe Smart Lighting Market, by Country, 2016 – 2026 (USD Billion)
      Table 13 Europe Smart Lighting Market, by Installation Type, 2016 – 2026 (USD Billion)
      Table 14 Europe Smart Lighting Market, by Offering, 2016 – 2026 (USD Billion)
      Table 15 Europe Smart Lighting Market, by End-use Application, 2016 – 2026 (USD Billion)
      Table 16 Europe Smart Lighting Market, by Communication Technology, 2016 – 2026 (USD Billion)
      Table 17 Asia Pacific Smart Lighting Market, by Country, 2016 – 2026 (USD Billion)
      Table 18 Asia Pacific Smart Lighting Market, by Installation Type, 2016 – 2026 (USD Billion)
      Table 19 Asia Pacific Smart Lighting Market, by Offering, 2016 – 2026 (USD Billion)
      Table 20 Asia Pacific Smart Lighting Market, by End-use Application, 2016 – 2026 (USD Billion)
      Table 21 Asia Pacific Smart Lighting Market, by Communication Technology, 2016 – 2026 (USD Billion)
      Table 22 Latin America Smart Lighting Market, by Country, 2016 – 2026 (USD Billion)
      Table 23 Latin America Smart Lighting Market, by Installation Type, 2016 – 2026 (USD Billion)
      Table 24 Latin America Smart Lighting Market, by Offering, 2016 – 2026 (USD Billion)
      Table 25 Latin America Smart Lighting Market, by End-use Application, 2016 – 2026 (USD Billion)
      Table 26 Latin America Smart Lighting Market, by Communication Technology, 2016 – 2026 (USD Billion)
      Table 27 The Middle-East and Africa Smart Lighting Market, by Country, 2016 – 2026 (USD Billion)
      Table 28 The Middle-East and Africa Smart Lighting Market, by Installation Type, 2016 – 2026 (USD Billion)
      Table 29 The Middle-East and Africa Smart Lighting Market, by Offering, 2016 – 2026 (USD Billion)
      Table 30 The Middle-East and Africa Smart Lighting Market, by End-use Application, 2016 – 2026 (USD Billion)
      Table 31 The Middle-East and Africa Smart Lighting Market, by Communication Technology, 2016 – 2026 (USD Billion)
      Table 32 Global Smart Lighting Market - Company Revenue Analysis, 2016 – 2019 (USD Billion)
      Table 33 Global Smart Lighting Market - Company Revenue Share Analysis, 2016 – 2019 (%)
      Table 34 Acquisitions and Mergers
      Table 35 Market Drivers – Impact Analysis
      Table 36 Market Restraints
      Table 37 Market Opportunities
      Table 38 Major Buyers of Smart Lighting
      Table 39 Distributors/Traders of Smart Lighting by Region
      

Industry Major Market Players

  • Awox SA
  • Control4 Corp
  • Cooper Lighting Solutions
  • Crestron Electronics Inc
  • Eve Systems GmbH
  • General Electric Company
  • Insteon (Smartlabs)
  • KEA Systems BV
  • LG Electronics
  • Lutron Electronics
  • Sengled USA Inc
  • Signify Holdings
  • Wiz Connected Lighting
  • Wyze Labs Inc.