Search Market Research Report

Discover Our Latest Reports
Discover Our Featured Reports
Discover Top Selling Reports

Smart Kitchen Appliances Market Size, Share Global Analysis Report, 2021 – 2026

report img

Smart Kitchen Appliances Market By Product Type (Smart Ovens, Smart Dishwashers, Smart Refrigerators, Smart Cookware and Cooktops, Smart Scale and Thermometers, and Others), By Technology (Wi-Fi, Bluetooth, RFID, and Others), Sales Channel (Online, and Offline), By Distribution Channel (Multi-brand Stores, Exclusive Stores, Online, and Other Distribution Channels), By End User (Residential, and Commercials): Global & Regional Industry Perspective, Comprehensive Analysis, and Forecast 2021 – 2026

Industry Insights

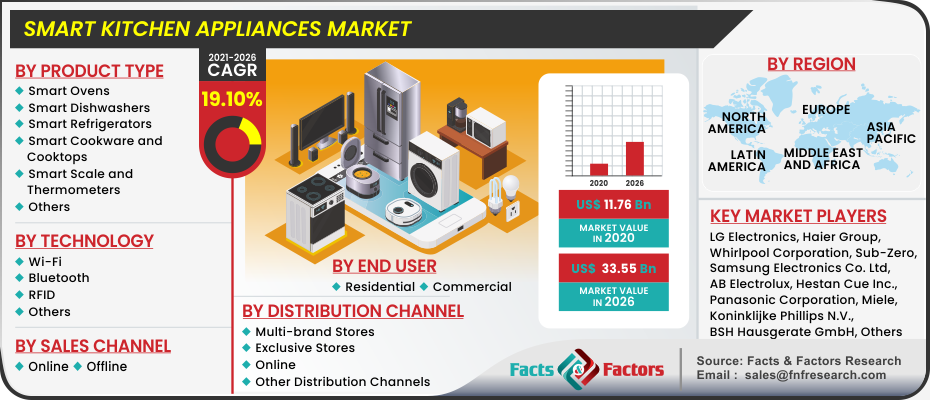
[228+ Pages Report] According to Facts and Factors, the global Smart Kitchen Appliances Market was worth USD 11.76 Billion in 2020 and is expected to reach USD 33.55 Billion by the end of 2026, with a CAGR of roughly 19.10% between 2021 and 2026.

logoMarket Overview      

The term "smart kitchen appliances" refers to appliances that are meant to save energy and time. Their main objective is to be environmentally responsible while being productive. They're constructed from a combination of cutting-edge technology, smart design, and environmentally responsible materials. Cooking is growing increasingly popular, and equipment is being utilized for a wide range of purposes. With the fast advancement of technology, the kitchen concept has experienced a substantial transition, with a heavy emphasis on increasing kitchen efficiency and reducing cleaning and cooking time.

logoIndustry Growth Factors

Customers on the worldwide market have begun to connect technical innovation with wealth, and they are spending a disproportionate amount of money on home decoration. As a result, the market for smart kitchen equipment has grown globally. Every modern appliance, from dishwashers to freezers, incorporates smart technology to provide tailored functionality for a variety of customer demands and preferences. The development of smart kitchens is aided by the trend toward smaller single-family homes and integrated kitchen designs. The smart kitchen appliances market is predicted to rise at a high rate because of characteristics such as linked security, intelligent sensors, time savings, and convenience. A rising consumer trend toward technology-driven goods is driving the need for energy-saving and electric kitchen equipment. Because of the wider penetration of technologically advanced items, the rise of smart homes in the United States is far higher than in the rest of the globe. The capability that automatically switches off the appliances as needed while informing the owner is one of the major factors driving the smart kitchen appliances market growth. In addition, the increasing use of IoT technology adds considerably to the growth of the smart kitchen appliance market. However, a lack of knowledge of the benefits of smart kitchen equipment, as well as high maintenance costs, are two major barriers to the industry's expansion.

Smart Kitchen Appliances Market

To know more about this report | Request Free Sample Copy

logoSegmentation Analysis

The global smart kitchen appliances market can be segregated based on product type, technology, end-use industry, and region. Based on product type, the global smart kitchen appliances industry is categorized into smart cookware and cooktops, smart dishwashers, smart refrigerators, smart ovens, smart scale and thermometers, and others. Based on technology, the global smart kitchen appliances industry is categorized into Bluetooth, wi-fi, RFID, and others. Based on sales channels, the global smart kitchen appliances industry is categorized into offline, and online. Based on distribution channels, the global smart kitchen appliances industry is categorized into exclusive stores, multi-brand stores, online, and other distribution channels. Based on end-user, the global smart kitchen appliances industry is categorized into commercial, and residential.

logo Regional Analysis

In 2020, North America is likely to be the leading regional smart kitchen appliances market. The United States was the largest market for smart kitchen appliances in North America, accounting for more than half of the market. The main drivers of regional market growth are rising disposable income, changing lifestyles, and expenditures in renovations and contemporary designs. During the projection period, Asia Pacific is predicted to be the fastest expanding market, with a substantial growth rate. The increasing usage of smart refrigerators and smart ovens in the area, notably in China, is a significant driver of market expansion. During the projection period, the region will provide market vendors with many prospects for growth. Smart kitchen appliance market expansion in this region will be fueled by advantageous infrastructure, acceptance of smart home technologies, technical developments, and expanded product offerings throughout the projected period.

logoReport Scope

Report Attribute

Details

Market Size in 2020

USD 11.76 Billion

Projected Market Size in 2026

USD 33.55 Billion

CAGR Growth Rate

19.10%

Base Year

2020

Forecast Years

2021-2026

Key Market Players

global LG Electronics, Whirlpool Corporation, Samsung Electronics Co. Ltd, AB Electrolux, Panasonic Corporation, Haier Group, Koninklijke Phillips N.V., BSH Hausgerate GmbH, Sub-Zero, Miele, Hestan Cue Inc., Breville Group Limited, De’Longhi Appliances S.r.L., Cie KG, Groupe SEB, amongst others.

Key Segment

By Product Type, By Technology, By Distribution Channel, By End User, and By Region

Major Regions Covered

North America, Europe, Asia Pacific, Latin America, and the Middle East & Africa

Purchase Options

Request customized purchase options to meet your research needs. Explore purchase options

logo Competitive Players

Some main participants of the global smart kitchen appliances market are

  • LG Electronics
  • Whirlpool Corporation
  • Samsung Electronics Co. Ltd
  • AB Electrolux
  • Panasonic Corporation
  • Haier Group
  • Koninklijke Phillips N.V.
  • BSH Hausgerate GmbH
  • Sub-Zero
  • Miele
  • Hestan Cue Inc.
  • Breville Group Limited
  • De’Longhi Appliances S.r.L.
  • Cie KG
  • Groupe SEB

logoSmart Kitchen Appliances Market: By Product Type

  • Smart Ovens
  • Smart Dishwashers
  • Smart Refrigerators
  • Smart Cookware and Cooktops
  • Smart Scale and Thermometers
  • Others

logoSmart Kitchen Appliances Market: By Technology

  • Wi-Fi
  • Bluetooth
  • RFID
  • Others

logoSmart Kitchen Appliances Market: By Sales Channel

  • Online
  • Offline

logoSmart Kitchen Appliances Market: By Distribution Channel

  • Multi-brand Stores
  • Exclusive Stores
  • Online
  • Other Distribution Channels

logoSmart Kitchen Appliances Market: By End User

  • Residential
  • Commercial

logoSmart Kitchen Appliances Market: Regional Segment Analysis

  • North America
    • U.S.
    • Canada
  • Europe
    • UK
    • France
    • Germany
    • Italy
    • Spain
    • Rest of Europe
  • Asia Pacific
    • China
    • Japan
    • India
    • South Korea
    • Southeast Asia
    • Rest of Asia Pacific
  • Latin America
    • Brazil
    • Mexico
    • Rest of Latin America
  • Middle East and Africa
    • GCC Countries
    • South Africa
    • Rest of MEA

Table of Content

  1. Chapter 1 Executive Summary
    1. 1.1. Introduction of Smart Kitchen Appliances
    2. 1.2. Global Smart Kitchen Appliances Market, 2020 & 2026 (USD Million)
    3. 1.3. Global Smart Kitchen Appliances Market, 2016 – 2026 (USD Million)
    4. 1.4. Global Smart Kitchen Appliances Market Absolute Revenue Opportunity, 2016 – 2026 (USD Million)
    5. 1.5. Global Smart Kitchen Appliances Market Incremental Revenue Opportunity, 2020 – 2026 (USD Million)
  2. Chapter 2 Smart Kitchen Appliances Market – Product Type Analysis
    1. 2.1. Global Smart Kitchen Appliances Market – Product Type Overview
    2. 2.2. Global Smart Kitchen Appliances Market Share, by Product Type, 2020 & 2026 (USD Million)
    3. 2.3. Smart Ovens
      1. 2.3.1. Global Smart Ovens Smart Kitchen Appliances Market, 2016 – 2026 (USD Million)
    4. 2.4. Smart Dishwashers
      1. 2.4.1. Global Smart Dishwashers Smart Kitchen Appliances Market, 2016 – 2026 (USD Million)
    5. 2.5. Smart Refrigerators
      1. 2.5.1. Global Smart Refrigerators Smart Kitchen Appliances Market, 2016 – 2026 (USD Million)
    6. 2.6. Smart Cookware and Cooktops
      1. 2.6.1. Global Smart Cookware and Cooktops Smart Kitchen Appliances Market, 2016 – 2026 (USD Million)
    7. 2.7. Smart Scale and Thermometers
      1. 2.7.1. Global Smart Scale and Thermometers Smart Kitchen Appliances Market, 2016 – 2026 (USD Million)
    8. 2.8. Others
      1. 2.8.1. Global Others Smart Kitchen Appliances Market, 2016 – 2026 (USD Million)
  3. Chapter 3 Smart Kitchen Appliances Market – Technology Analysis
    1. 3.1. Global Smart Kitchen Appliances Market – Technology Overview
    2. 3.2. Global Smart Kitchen Appliances Market Share, by Technology, 2020 & 2026 (USD Million)
    3. 3.3. Wi-Fi
      1. 3.3.1. Global Wi-Fi Smart Kitchen Appliances Market, 2016 – 2026 (USD Million)
    4. 3.4. Bluetooth
      1. 3.4.1. Global Bluetooth Smart Kitchen Appliances Market, 2016 – 2026 (USD Million)
    5. 3.5. RFID
      1. 3.5.1. Global RFID Smart Kitchen Appliances Market, 2016 – 2026 (USD Million)
    6. 3.6. Others
      1. 3.6.1. Global Others Smart Kitchen Appliances Market, 2016 – 2026 (USD Million)
  4. Chapter 4 Smart Kitchen Appliances Market – Sales Channel Analysis
    1. 4.1. Global Smart Kitchen Appliances Market – Sales Channel Overview
    2. 4.2. Global Smart Kitchen Appliances Market Share, by Sales Channel, 2020 & 2026 (USD Million)
    3. 4.3. Online
      1. 4.3.1. Global Online Smart Kitchen Appliances Market, 2016 – 2026 (USD Million)
    4. 4.4. Offline
      1. 4.4.1. Global Offline Smart Kitchen Appliances Market, 2016 – 2026 (USD Million)
  5. Chapter 5 Smart Kitchen Appliances Market – Distribution Channel Analysis
    1. 5.1. Global Smart Kitchen Appliances Market – Distribution Channel Overview
    2. 5.2. Global Smart Kitchen Appliances Market Share, by Distribution Channel, 2020 & 2026 (USD Million)
    3. 5.3. Multi-brand Stores
      1. 5.3.1. Global Multi-brand Stores Smart Kitchen Appliances Market, 2016 – 2026 (USD Million)
    4. 5.4. Exclusive Stores
      1. 5.4.1. Global Exclusive Stores Smart Kitchen Appliances Market, 2016 – 2026 (USD Million)
    5. 5.5. Online
      1. 5.5.1. Global Online Smart Kitchen Appliances Market, 2016 – 2026 (USD Million)
    6. 5.6. Other Distribution Channels
      1. 5.6.1. Global Other Distribution Channels Smart Kitchen Appliances Market, 2016 – 2026 (USD Million)
  6. Chapter 6 Smart Kitchen Appliances Market – End User Analysis
    1. 6.1. Global Smart Kitchen Appliances Market – End User Overview
    2. 6.2. Global Smart Kitchen Appliances Market Share, by End User, 2020 & 2026 (USD Million)
    3. 6.3. Residential
      1. 6.3.1. Global Residential Smart Kitchen Appliances Market, 2016 – 2026 (USD Million)
    4. 6.4. Commercial
      1. 6.4.1. Global Commercial Smart Kitchen Appliances Market, 2016 – 2026 (USD Million)
  7. Chapter 7 Smart Kitchen Appliances Market – Regional Analysis
    1. 7.1. Global Smart Kitchen Appliances Market Regional Overview
    2. 7.2. Global Smart Kitchen Appliances Market Share, by Region, 2020 & 2026 (USD Million)
    3. 7.3. North America
      1. 7.3.1. North America Smart Kitchen Appliances Market, 2016 – 2026 (USD Million)
        1. 7.3.1.1. North America Smart Kitchen Appliances Market, by Country, 2016 - 2026 (USD Million)
      2. 7.3.2. North America Smart Kitchen Appliances Market, by Product Type, 2016 – 2026
        1. 7.3.2.1. North America Smart Kitchen Appliances Market, by Product Type, 2016 – 2026 (USD Million)
      3. 7.3.3. North America Smart Kitchen Appliances Market, by Technology, 2016 – 2026
        1. 7.3.3.1. North America Smart Kitchen Appliances Market, by Technology, 2016 – 2026 (USD Million)
      4. 7.3.4. North America Smart Kitchen Appliances Market, by Sales Channel, 2016 – 2026
        1. 7.3.4.1. North America Smart Kitchen Appliances Market, by Sales Channel, 2016 – 2026 (USD Million)
      5. 7.3.5. North America Smart Kitchen Appliances Market, by Distribution Channel, 2016 – 2026
        1. 7.3.5.1. North America Smart Kitchen Appliances Market, by Distribution Channel, 2016 – 2026 (USD Million)
      6. 7.3.6. North America Smart Kitchen Appliances Market, by End User, 2016 – 2026
        1. 7.3.6.1. North America Smart Kitchen Appliances Market, by End User, 2016 – 2026 (USD Million)
      7. 7.3.7. U.S.
        1. 7.3.7.1. U.S. Smart Kitchen Appliances Market, 2016 – 2026 (USD Million)
      8. 7.3.8. Canada
        1. 7.3.8.1. Canada Smart Kitchen Appliances Market, 2016 – 2026 (USD Million)
    4. 7.4. Europe
      1. 7.4.1. Europe Smart Kitchen Appliances Market, 2016 – 2026 (USD Million)
        1. 7.4.1.1. Europe Smart Kitchen Appliances Market, by Country, 2016 - 2026 (USD Million)
      2. 7.4.2. Europe Smart Kitchen Appliances Market, by Product Type, 2016 – 2026
        1. 7.4.2.1. Europe Smart Kitchen Appliances Market, by Product Type, 2016 – 2026 (USD Million)
      3. 7.4.3. Europe Smart Kitchen Appliances Market, by Technology, 2016 – 2026
        1. 7.4.3.1. Europe Smart Kitchen Appliances Market, by Technology, 2016 – 2026 (USD Million)
      4. 7.4.4. Europe Smart Kitchen Appliances Market, by Sales Channel, 2016 – 2026
        1. 7.4.4.1. Europe Smart Kitchen Appliances Market, by Sales Channel, 2016 – 2026 (USD Million)
      5. 7.4.5. Europe Smart Kitchen Appliances Market, by Distribution Channel, 2016 – 2026
        1. 7.4.5.1. Europe Smart Kitchen Appliances Market, by Distribution Channel, 2016 – 2026 (USD Million)
      6. 7.4.6. Europe Smart Kitchen Appliances Market, by End User, 2016 – 2026
        1. 7.4.6.1. Europe Smart Kitchen Appliances Market, by End User, 2016 – 2026 (USD Million)
      7. 7.4.7. Germany
        1. 7.4.7.1. Germany Smart Kitchen Appliances Market, 2016 – 2026 (USD Million)
      8. 7.4.8. France
        1. 7.4.8.1. France Smart Kitchen Appliances Market, 2016 – 2026 (USD Million)
      9. 7.4.9. U.K.
        1. 7.4.9.1. U.K. Smart Kitchen Appliances Market, 2016 – 2026 (USD Million)
      10. 7.4.10. Italy
        1. 7.4.10.1. Italy Smart Kitchen Appliances Market, 2016 – 2026 (USD Million)
      11. 7.4.11. Spain
        1. 7.4.11.1. Spain Smart Kitchen Appliances Market, 2016 – 2026 (USD Million)
      12. 7.4.12. Rest of Europe
        1. 7.4.12.1. Rest of Europe Smart Kitchen Appliances Market, 2016 – 2026 (USD Million)
    5. 7.5. Asia Pacific
      1. 7.5.1. Asia Pacific Smart Kitchen Appliances Market, 2016 – 2026 (USD Million)
        1. 7.5.1.1. Asia Pacific Smart Kitchen Appliances Market, by Country, 2016 - 2026 (USD Million)
      2. 7.5.2. Asia Pacific Smart Kitchen Appliances Market, by Product Type, 2016 – 2026
        1. 7.5.2.1. Asia Pacific Smart Kitchen Appliances Market, by Product Type, 2016 – 2026 (USD Million)
      3. 7.5.3. Asia Pacific Smart Kitchen Appliances Market, by Technology, 2016 – 2026
        1. 7.5.3.1. Asia Pacific Smart Kitchen Appliances Market, by Technology, 2016 – 2026 (USD Million)
      4. 7.5.4. Asia Pacific Smart Kitchen Appliances Market, by Sales Channel, 2016 – 2026
        1. 7.5.4.1. Asia Pacific Smart Kitchen Appliances Market, by Sales Channel, 2016 – 2026 (USD Million)
      5. 7.5.5. Asia Pacific Smart Kitchen Appliances Market, by Distribution Channel, 2016 – 2026
        1. 7.5.5.1. Asia Pacific Smart Kitchen Appliances Market, by Distribution Channel, 2016 – 2026 (USD Million)
      6. 7.5.6. Asia Pacific Smart Kitchen Appliances Market, by End User, 2016 – 2026
        1. 7.5.6.1. Asia Pacific Smart Kitchen Appliances Market, by End User, 2016 – 2026 (USD Million)
      7. 7.5.7. China
        1. 7.5.7.1. China Smart Kitchen Appliances Market, 2016 – 2026 (USD Million)
      8. 7.5.8. Japan
        1. 7.5.8.1. Japan Smart Kitchen Appliances Market, 2016 – 2026 (USD Million)
      9. 7.5.9. India
        1. 7.5.9.1. India Smart Kitchen Appliances Market, 2016 – 2026 (USD Million)
      10. 7.5.10. South Korea
        1. 7.5.10.1. South Korea Smart Kitchen Appliances Market, 2016 – 2026 (USD Million)
      11. 7.5.11. South-East Asia
        1. 7.5.11.1. South-East Asia Smart Kitchen Appliances Market, 2016 – 2026 (USD Million)
      12. 7.5.12. Rest of Asia Pacific
        1. 7.5.12.1. Rest of Asia Pacific Smart Kitchen Appliances Market, 2016 – 2026 (USD Million)
    6. 7.6. Latin America
      1. 7.6.1. Latin America Smart Kitchen Appliances Market, 2016 – 2026 (USD Million)
        1. 7.6.1.1. Latin America Smart Kitchen Appliances Market, by Country, 2016 - 2026 (USD Million)
      2. 7.6.2. Latin America Smart Kitchen Appliances Market, by Product Type, 2016 – 2026
        1. 7.6.2.1. Latin America Smart Kitchen Appliances Market, by Product Type, 2016 – 2026 (USD Million)
      3. 7.6.3. Latin America Smart Kitchen Appliances Market, by Technology, 2016 – 2026
        1. 7.6.3.1. Latin America Smart Kitchen Appliances Market, by Technology, 2016 – 2026 (USD Million)
      4. 7.6.4. Latin America Smart Kitchen Appliances Market, by Sales Channel, 2016 – 2026
        1. 7.6.4.1. Latin America Smart Kitchen Appliances Market, by Sales Channel, 2016 – 2026 (USD Million)
      5. 7.6.5. Latin America Smart Kitchen Appliances Market, by Distribution Channel, 2016 – 2026
        1. 7.6.5.1. Latin America Smart Kitchen Appliances Market, by Distribution Channel, 2016 – 2026 (USD Million)
      6. 7.6.6. Latin America Smart Kitchen Appliances Market, by End User, 2016 – 2026
        1. 7.6.6.1. Latin America Smart Kitchen Appliances Market, by End User, 2016 – 2026 (USD Million)
      7. 7.6.7. Brazil
        1. 7.6.7.1. Brazil Smart Kitchen Appliances Market, 2016 – 2026 (USD Million)
      8. 7.6.8. Mexico
        1. 7.6.8.1. Mexico Smart Kitchen Appliances Market, 2016 – 2026 (USD Million)
      9. 7.6.9. Rest of Latin America
        1. 7.6.9.1. Rest of Latin America Smart Kitchen Appliances Market, 2016 – 2026 (USD Million)
    7. 7.7. The Middle-East and Africa
      1. 7.7.1. The Middle-East and Africa Smart Kitchen Appliances Market, 2016 – 2026 (USD Million)
        1. 7.7.1.1. The Middle-East and Africa Smart Kitchen Appliances Market, by Country, 2016 - 2026 (USD Million)
      2. 7.7.2. The Middle-East and Africa Smart Kitchen Appliances Market, by Product Type, 2016 – 2026
        1. 7.7.2.1. The Middle-East and Africa Smart Kitchen Appliances Market, by Product Type, 2016 – 2026 (USD Million)
      3. 7.7.3. The Middle-East and Africa Smart Kitchen Appliances Market, by Technology, 2016 – 2026
        1. 7.7.3.1. The Middle-East and Africa Smart Kitchen Appliances Market, by Technology, 2016 – 2026 (USD Million)
      4. 7.7.4. The Middle-East and Africa Smart Kitchen Appliances Market, by Sales Channel, 2016 – 2026
        1. 7.7.4.1. The Middle-East and Africa Smart Kitchen Appliances Market, by Sales Channel, 2016 – 2026 (USD Million)
      5. 7.7.5. The Middle-East and Africa Smart Kitchen Appliances Market, by Distribution Channel, 2016 – 2026
        1. 7.7.5.1. The Middle-East and Africa Smart Kitchen Appliances Market, by Distribution Channel, 2016 – 2026 (USD Million)
      6. 7.7.6. The Middle-East and Africa Smart Kitchen Appliances Market, by End User, 2016 – 2026
        1. 7.7.6.1. The Middle-East and Africa Smart Kitchen Appliances Market, by End User, 2016 – 2026 (USD Million)
      7. 7.7.7. GCC Countries
        1. 7.7.7.1. GCC Countries Smart Kitchen Appliances Market, 2016 – 2026 (USD Million)
      8. 7.7.8. South Africa
        1. 7.7.8.1. South Africa Smart Kitchen Appliances Market, 2016 – 2026 (USD Million)
      9. 7.7.9. Rest of Middle-East Africa
        1. 7.7.9.1. Rest of Middle-East Africa Smart Kitchen Appliances Market, 2016 – 2026 (USD Million)
  8. Chapter 8 Smart Kitchen Appliances Market – Competitive Landscape
    1. 8.1. Competitor Market Share – Revenue
    2. 8.2. Market Concentration Rate Analysis, Top 3 and Top 5 Players
    3. 8.3. Strategic Developments
      1. 8.3.1. Acquisitions and Mergers
      2. 8.3.2. New Products
      3. 8.3.3. Research & Development Activities
  9. Chapter 9 Company Profiles
    1. 9.1. Whirlpool Corporation
      1. 9.1.1. Company Overview
      2. 9.1.2. Product/Service Portfolio
      3. 9.1.3. Whirlpool Corporation Sales, Revenue, and Gross Margin
      4. 9.1.4. Whirlpool Corporation Revenue and Growth Rate
      5. 9.1.5. Whirlpool Corporation Market Share
      6. 9.1.6. Recent Initiatives, Funding/VC Activities, and Technological Innovations
    2. 9.2. LG Electronics
      1. 9.2.1. Company Overview
      2. 9.2.2. Product/Service Portfolio
      3. 9.2.3. LG Electronics Sales, Revenue, and Gross Margin
      4. 9.2.4. LG Electronics Revenue and Growth Rate
      5. 9.2.5. LG Electronics Market Share
      6. 9.2.6. Recent Initiatives, Funding/VC Activities, and Technological Innovations
    3. 9.3. AB Electrolux
      1. 9.3.1. Company Overview
      2. 9.3.2. Product/Service Portfolio
      3. 9.3.3. AB Electrolux Sales, Revenue, and Gross Margin
      4. 9.3.4. AB Electrolux Revenue and Growth Rate
      5. 9.3.5. AB Electrolux Market Share
      6. 9.3.6. Recent Initiatives, Funding/VC Activities, and Technological Innovations
    4. 9.4. Samsung Electronics Co. Ltd
      1. 9.4.1. Company Overview
      2. 9.4.2. Product/Service Portfolio
      3. 9.4.3. Samsung Electronics Co. Ltd Sales, Revenue, and Gross Margin
      4. 9.4.4. Samsung Electronics Co. Ltd Revenue and Growth Rate
      5. 9.4.5. Samsung Electronics Co. Ltd Market Share
      6. 9.4.6. Recent Initiatives, Funding/VC Activities, and Technological Innovations
    5. 9.5. Haier Group
      1. 9.5.1. Company Overview
      2. 9.5.2. Product/Service Portfolio
      3. 9.5.3. Haier Group Sales, Revenue, and Gross Margin
      4. 9.5.4. Haier Group Revenue and Growth Rate
      5. 9.5.5. Haier Group Market Share
      6. 9.5.6. Recent Initiatives, Funding/VC Activities, and Technological Innovations
    6. 9.6. Panasonic Corporation
      1. 9.6.1. Company Overview
      2. 9.6.2. Product/Service Portfolio
      3. 9.6.3. Panasonic Corporation Sales, Revenue, and Gross Margin
      4. 9.6.4. Panasonic Corporation Revenue and Growth Rate
      5. 9.6.5. Panasonic Corporation Market Share
      6. 9.6.6. Recent Initiatives, Funding/VC Activities, and Technological Innovations
    7. 9.7. BSH Hausgerate GmbH
      1. 9.7.1. Company Overview
      2. 9.7.2. Product/Service Portfolio
      3. 9.7.3. BSH Hausgerate GmbH Sales, Revenue, and Gross Margin
      4. 9.7.4. BSH Hausgerate GmbH Revenue and Growth Rate
      5. 9.7.5. BSH Hausgerate GmbH Market Share
      6. 9.7.6. Recent Initiatives, Funding/VC Activities, and Technological Innovations
    8. 9.8. Koninklijke Phillips N.V.
      1. 9.8.1. Company Overview
      2. 9.8.2. Product/Service Portfolio
      3. 9.8.3. Koninklijke Phillips N.V. Sales, Revenue, and Gross Margin
      4. 9.8.4. Koninklijke Phillips N.V. Revenue and Growth Rate
      5. 9.8.5. Koninklijke Phillips N.V. Market Share
      6. 9.8.6. Recent Initiatives, Funding/VC Activities, and Technological Innovations
    9. 9.9. Miele
      1. 9.9.1. Company Overview
      2. 9.9.2. Product/Service Portfolio
      3. 9.9.3. Miele Sales, Revenue, and Gross Margin
      4. 9.9.4. Miele Revenue and Growth Rate
      5. 9.9.5. Miele Market Share
      6. 9.9.6. Recent Initiatives, Funding/VC Activities, and Technological Innovations
    10. 9.10. Sub-Zero
      1. 9.10.1. Company Overview
      2. 9.10.2. Product/Service Portfolio
      3. 9.10.3. Sub-Zero Sales, Revenue, and Gross Margin
      4. 9.10.4. Sub-Zero Revenue and Growth Rate
      5. 9.10.5. Sub-Zero Market Share
      6. 9.10.6. Recent Initiatives, Funding/VC Activities, and Technological Innovations
    11. 9.11. Breville Group Limited
      1. 9.11.1. Company Overview
      2. 9.11.2. Product/Service Portfolio
      3. 9.11.3. Breville Group Limited Sales, Revenue, and Gross Margin
      4. 9.11.4. Breville Group Limited Revenue and Growth Rate
      5. 9.11.5. Breville Group Limited Market Share
      6. 9.11.6. Recent Initiatives, Funding/VC Activities, and Technological Innovations
    12. 9.12. Hestan Cue Inc.
      1. 9.12.1. Company Overview
      2. 9.12.2. Product/Service Portfolio
      3. 9.12.3. Hestan Cue Inc. Sales, Revenue, and Gross Margin
      4. 9.12.4. Hestan Cue Inc. Revenue and Growth Rate
      5. 9.12.5. Hestan Cue Inc. Market Share
      6. 9.12.6. Recent Initiatives, Funding/VC Activities, and Technological Innovations
    13. 9.13. Cie KG
      1. 9.13.1. Company Overview
      2. 9.13.2. Product/Service Portfolio
      3. 9.13.3. Cie KG Sales, Revenue, and Gross Margin
      4. 9.13.4. Cie KG Revenue and Growth Rate
      5. 9.13.5. Cie KG Market Share
      6. 9.13.6. Recent Initiatives, Funding/VC Activities, and Technological Innovations
    14. 9.14. De’Longhi Appliances S.r.L.
      1. 9.14.1. Company Overview
      2. 9.14.2. Product/Service Portfolio
      3. 9.14.3. De’Longhi Appliances S.r.L. Sales, Revenue, and Gross Margin
      4. 9.14.4. De’Longhi Appliances S.r.L. Revenue and Growth Rate
      5. 9.14.5. De’Longhi Appliances S.r.L. Market Share
      6. 9.14.6. Recent Initiatives, Funding/VC Activities, and Technological Innovations
    15. 9.15. Groupe SEB
      1. 9.15.1. Company Overview
      2. 9.15.2. Product/Service Portfolio
      3. 9.15.3. Groupe SEB Sales, Revenue, and Gross Margin
      4. 9.15.4. Groupe SEB Revenue and Growth Rate
      5. 9.15.5. Groupe SEB Market Share
      6. 9.15.6. Recent Initiatives, Funding/VC Activities, and Technological Innovations
  10. Chapter 10 Smart Kitchen Appliances — Industry Analysis
    1. 10.1. Introduction and Taxonomy
    2. 10.2. Smart Kitchen Appliances Market – Key Trends
      1. 10.2.1. Market Drivers
      2. 10.2.2. Market Restraints
      3. 10.2.3. Market Opportunities
    3. 10.3. Value Chain Analysis
    4. 10.4. Key Mandates and Regulations
    5. 10.5. Technology Roadmap and Timeline
    6. 10.6. Smart Kitchen Appliances Market – Attractiveness Analysis
      1. 10.6.1. By Product Type
      2. 10.6.2. By Technology
      3. 10.6.3. By Sales Channel
      4. 10.6.4. By Distribution Channel
      5. 10.6.5. By End User
      6. 10.6.6. By Region
  11. Chapter 11 Industrial Chain, Sourcing Strategy, and Downstream Buyers
    1. 11.1. Smart Kitchen Appliances Industrial Chain Analysis
    2. 11.2. Downstream Buyers
    3. 11.3. Distributors/Traders List
  12. Chapter 12 Marketing Strategy Analysis
    1. 12.1. Marketing Channel
    2. 12.2. Direct Marketing
    3. 12.3. Indirect Marketing
    4. 12.4. Marketing Channel Development Trends
    5. 12.5. Economic/Political Environmental Change
  13. Chapter 13 Report Conclusion & Key Insights
    1. 13.1. Key Insights from Primary Interviews & Surveys Respondents
    2. 13.2. Key Takeaways from Analysts, Consultants, and Industry Leaders
  14. Chapter 14 Research Approach & Methodology
    1. 14.1. Report Description
    2. 14.2. Research Scope
    3. 14.3. Research Methodology
      1. 14.3.1. Secondary Research
      2. 14.3.2. Primary Research
      3. 14.3.3. Statistical Models
        1. 14.3.3.1. Company Share Analysis Model
        2. 14.3.3.2. Revenue Based Modeling
      4. 14.3.4. Research Limitations

      List of Figures

      Fig.1	Product Picture of Smart Kitchen Appliances
      Fig.2	Global Smart Kitchen Appliances Market, 2016 – 2026 (USD Million)
      Fig.3	Global Smart Kitchen Appliances Market Absolute Revenue Opportunity, 2016 – 2026 (USD Million)
      Fig.4	Global Smart Kitchen Appliances Market Incremental Revenue Opportunity, 2020 – 2026 (USD Million)
      Fig.5	Global Smart Kitchen Appliances Market Share, by Product Type, 2020 & 2026 (USD Million)
      Fig.6	Global Smart Ovens Smart Kitchen Appliances Market, 2016 – 2026 (USD Million)
      Fig.7	Global Smart Dishwashers Smart Kitchen Appliances Market, 2016 – 2026 (USD Million)
      Fig.8	Global Smart Refrigerators Smart Kitchen Appliances Market, 2016 – 2026 (USD Million)
      Fig.9	Global Smart Cookware and Cooktops Smart Kitchen Appliances Market, 2016 – 2026 (USD Million)
      Fig.10	Global Smart Scale and Thermometers Smart Kitchen Appliances Market, 2016 – 2026 (USD Million)
      Fig.11	Global Others Smart Kitchen Appliances Market, 2016 – 2026 (USD Million)
      Fig.12	Global Smart Kitchen Appliances Market Share, by Technology, 2020 & 2026 (USD Million)
      Fig.13	Global Wi-Fi Smart Kitchen Appliances Market, 2016 – 2026 (USD Million)
      Fig.14	Global Bluetooth Smart Kitchen Appliances Market, 2016 – 2026 (USD Million)
      Fig.15	Global RFID Smart Kitchen Appliances Market, 2016 – 2026 (USD Million)
      Fig.16	Global Others Smart Kitchen Appliances Market, 2016 – 2026 (USD Million)
      Fig.17	Global Smart Kitchen Appliances Market Share, by Sales Channel, 2020 & 2026 (USD Million)
      Fig.18	Global Online Smart Kitchen Appliances Market, 2016 – 2026 (USD Million)
      Fig.19	Global Offline Smart Kitchen Appliances Market, 2016 – 2026 (USD Million)
      Fig.20	Global Smart Kitchen Appliances Market Share, by Distribution Channel, 2020 & 2026 (USD Million)
      Fig.21	Global Multi-brand Stores   Smart Kitchen Appliances Market, 2016 – 2026 (USD Million)
      Fig.22	Global Exclusive Stores Smart Kitchen Appliances Market, 2016 – 2026 (USD Million)
      Fig.23	Global Online Smart Kitchen Appliances Market, 2016 – 2026 (USD Million)
      Fig.24	Global Other Distribution Channels Smart Kitchen Appliances Market, 2016 – 2026 (USD Million)
      Fig.25	Global Smart Kitchen Appliances Market Share, by End User, 2020 & 2026 (USD Million)
      Fig.26	Global Residential Smart Kitchen Appliances Market, 2016 – 2026 (USD Million)
      Fig.27	Global Commercial Smart Kitchen Appliances Market, 2016 – 2026 (USD Million)
      Fig.28	Global Smart Kitchen Appliances Market Share, by Region, 2020 & 2026 (USD Million)
      Fig.29	North America Smart Kitchen Appliances Market, 2016 – 2026 (USD Million)
      Fig.30	U.S. Smart Kitchen Appliances Market, 2016 – 2026 (USD Million)
      Fig.31	Canada Smart Kitchen Appliances Market, 2016 – 2026 (USD Million)
      Fig.32	Europe Smart Kitchen Appliances Market, 2016 – 2026 (USD Million)
      Fig.33	Germany Smart Kitchen Appliances Market, 2016 – 2026 (USD Million)
      Fig.34	France Smart Kitchen Appliances Market, 2016 – 2026 (USD Million)
      Fig.35	U.K. Smart Kitchen Appliances Market, 2016 – 2026 (USD Million)
      Fig.36	Italy Smart Kitchen Appliances Market, 2016 – 2026 (USD Million)
      Fig.37	Spain Smart Kitchen Appliances Market, 2016 – 2026 (USD Million)
      Fig.38	Rest of Europe Smart Kitchen Appliances Market, 2016 – 2026 (USD Million)
      Fig.39	Asia Pacific Smart Kitchen Appliances Market, 2016 – 2026 (USD Million)
      Fig.40	China Smart Kitchen Appliances Market, 2016 – 2026 (USD Million)
      Fig.41	Japan Smart Kitchen Appliances Market, 2016 – 2026 (USD Million)
      Fig.42	India Smart Kitchen Appliances Market, 2016 – 2026 (USD Million)
      Fig.43	South  Korea Smart Kitchen Appliances Market, 2016 – 2026 (USD Million)
      Fig.44	South-East Asia Smart Kitchen Appliances Market, 2016 – 2026 (USD Million)
      Fig.45	Rest of Asia Pacific Smart Kitchen Appliances Market, 2016 – 2026 (USD Million)
      Fig.46	Latin America Smart Kitchen Appliances Market, 2016 – 2026 (USD Million)
      Fig.47	Brazil Smart Kitchen Appliances Market, 2016 – 2026 (USD Million)
      Fig.48	Mexico Smart Kitchen Appliances Market, 2016 – 2026 (USD Million)
      Fig.49	Rest of Latin America Smart Kitchen Appliances Market, 2016 – 2026 (USD Million)
      Fig.50	The Middle-East and Africa Smart Kitchen Appliances Market, 2016 – 2026 (USD Million)
      Fig.51	GCC Countries Smart Kitchen Appliances Market, 2016 – 2026 (USD Million)
      Fig.52	South Africa Smart Kitchen Appliances Market, 2016 – 2026 (USD Million)
      Fig.53	Rest of Middle-East Africa Smart Kitchen Appliances Market, 2016 – 2026 (USD Million)
      Fig.54	Competitor Market Share – Revenue
      Fig.55	Whirlpool Corporation Revenue and Growth Rate
      Fig.56	Whirlpool Corporation Market Share
      Fig.57	LG Electronics Revenue and Growth Rate
      Fig.58	LG Electronics Market Share
      Fig.59	AB Electrolux Revenue and Growth Rate
      Fig.60	AB Electrolux Market Share
      Fig.61	Samsung Electronics Co. Ltd Revenue and Growth Rate
      Fig.62	Samsung Electronics Co. Ltd Market Share
      Fig.63	Haier Group Revenue and Growth Rate
      Fig.64	Haier Group Market Share
      Fig.65	Panasonic Corporation Revenue and Growth Rate
      Fig.66	Panasonic Corporation Market Share
      Fig.67	BSH Hausgerate GmbH Revenue and Growth Rate
      Fig.68	BSH Hausgerate GmbH Market Share
      Fig.69	Koninklijke Phillips N.V. Revenue and Growth Rate
      Fig.70	Koninklijke Phillips N.V. Market Share
      Fig.71	Miele Revenue and Growth Rate
      Fig.72	Miele Market Share
      Fig.73	Sub-Zero Revenue and Growth Rate
      Fig.74	Sub-Zero Market Share
      Fig.75	Breville Group Limited Revenue and Growth Rate
      Fig.76	Breville Group Limited Market Share
      Fig.77	Hestan Cue Inc. Revenue and Growth Rate
      Fig.78	Hestan Cue Inc. Market Share
      Fig.79	Cie KG Revenue and Growth Rate
      Fig.80	Cie KG Market Share
      Fig.81	De’Longhi Appliances S.r.L. Revenue and Growth Rate
      Fig.82	De’Longhi Appliances S.r.L. Market Share
      Fig.83	Groupe SEB Revenue and Growth Rate
      Fig.84	Groupe SEB Market Share
      Fig.85	Market Dynamics
      Fig.86	Global Smart Kitchen Appliances – Value Chain Analysis
      Fig.87	Key Mandates and Regulations
      Fig.88	Technology Roadmap and Timeline
      Fig.89	Market Attractiveness Analysis – By Product Type
      Fig.90	Market Attractiveness Analysis – By Technology
      Fig.91	Market Attractiveness Analysis – By Sales Channel
      Fig.92	Market Attractiveness Analysis – By Distribution Channel
      Fig.93	Market Attractiveness Analysis – By End User
      Fig.94	Market Attractiveness Analysis – By Region
      Fig.95	Smart Kitchen Appliances Industrial Chain Analysis
      Fig.96	Market Channels
      Fig.97	Marketing Channel Development Trend
      Fig.98	Growth in World Gross Product, 2008-2018
      

      List of Tables

      Table 1	Global Smart Kitchen Appliances Market, 2020 & 2026 (USD Million)
      Table 2	Global Smart Kitchen Appliances Market, by Product Type, 2016 – 2026 (USD Million)
      Table 3	Global Smart Kitchen Appliances Market, by Technology, 2016 – 2026 (USD Million)
      Table 4	Global Smart Kitchen Appliances Market, by Sales Channel, 2016 – 2026 (USD Million)
      Table 5	Global Smart Kitchen Appliances Market, by Distribution Channel, 2016 – 2026 (USD Million)
      Table 6	Global Smart Kitchen Appliances Market, by End User, 2016 – 2026 (USD Million)
      Table 7	Global Smart Kitchen Appliances Market, by Region, 2016 – 2026 (USD Million)
      Table 8	North America Smart Kitchen Appliances Market, by Country, 2016 – 2026 (USD Million)
      Table 9	North America Smart Kitchen Appliances Market, by Product Type, 2016 – 2026 (USD Million)
      Table 10 North America Smart Kitchen Appliances Market, by Technology, 2016 – 2026 (USD Million)
      Table 11 North America Smart Kitchen Appliances Market, by Sales Channel, 2016 – 2026 (USD Million)
      Table 12 North America Smart Kitchen Appliances Market, by Distribution Channel, 2016 – 2026 (USD Million)
      Table 13 North America Smart Kitchen Appliances Market, by End User, 2016 – 2026 (USD Million)
      Table 14 Europe Smart Kitchen Appliances Market, by Country, 2016 – 2026 (USD Million)
      Table 15 Europe Smart Kitchen Appliances Market, by Product Type, 2016 – 2026 (USD Million)
      Table 16 Europe Smart Kitchen Appliances Market, by Technology, 2016 – 2026 (USD Million)
      Table 17 Europe Smart Kitchen Appliances Market, by Sales Channel, 2016 – 2026 (USD Million)
      Table 18 Europe Smart Kitchen Appliances Market, by Distribution Channel, 2016 – 2026 (USD Million)
      Table 19 Europe Smart Kitchen Appliances Market, by End User, 2016 – 2026 (USD Million)
      Table 20 Asia Pacific Smart Kitchen Appliances Market, by Country, 2016 – 2026 (USD Million)
      Table 21 Asia Pacific Smart Kitchen Appliances Market, by Product Type, 2016 – 2026 (USD Million)
      Table 22 Asia Pacific Smart Kitchen Appliances Market, by Technology, 2016 – 2026 (USD Million)
      Table 23 Asia Pacific Smart Kitchen Appliances Market, by Sales Channel, 2016 – 2026 (USD Million)
      Table 24 Asia Pacific Smart Kitchen Appliances Market, by Distribution Channel, 2016 – 2026 (USD Million)
      Table 25 Asia Pacific Smart Kitchen Appliances Market, by End User, 2016 – 2026 (USD Million)
      Table 26 Latin America Smart Kitchen Appliances Market, by Country, 2016 – 2026 (USD Million)
      Table 27 Latin America Smart Kitchen Appliances Market, by Product Type, 2016 – 2026 (USD Million)
      Table 28 Latin America Smart Kitchen Appliances Market, by Technology, 2016 – 2026 (USD Million)
      Table 29 Latin America Smart Kitchen Appliances Market, by Sales Channel, 2016 – 2026 (USD Million)
      Table 30 Latin America Smart Kitchen Appliances Market, by Distribution Channel, 2016 – 2026 (USD Million)
      Table 31 Latin America Smart Kitchen Appliances Market, by End User, 2016 – 2026 (USD Million)
      Table 32 The Middle-East and Africa Smart Kitchen Appliances Market, by Country, 2016 – 2026 (USD Million)
      Table 33 The Middle-East and Africa Smart Kitchen Appliances Market, by Product Type, 2016 – 2026 (USD Million)
      Table 34 The Middle-East and Africa Smart Kitchen Appliances Market, by Technology, 2016 – 2026 (USD Million)
      Table 35 The Middle-East and Africa Smart Kitchen Appliances Market, by Sales Channel, 2016 – 2026 (USD Million)
      Table 36 The Middle-East and Africa Smart Kitchen Appliances Market, by Distribution Channel, 2016 – 2026 (USD Million)
      Table 37 The Middle-East and Africa Smart Kitchen Appliances Market, by End User, 2016 – 2026 (USD Million)
      Table 38 Global Smart Kitchen Appliances Market - Company Revenue Analysis, 2016 – 2020 (USD Million)
      Table 39 Global Smart Kitchen Appliances Market - Company Revenue Share Analysis, 2016 – 2020 (%)
      Table 40 Acquisitions and Mergers
      Table 41 Market Drivers – Impact Analysis
      Table 42 Market Restraints
      Table 43 Market Opportunities
      Table 44 Major Buyers of Smart Kitchen Appliances
      Table 45 Distributors/Traders of Smart Kitchen Appliances by Region
      

Industry Major Market Players

  • LG Electronics
  • Whirlpool Corporation
  • Samsung Electronics Co. Ltd
  • AB Electrolux
  • Panasonic Corporation
  • Haier Group
  • Koninklijke Phillips N.V.
  • BSH Hausgerate GmbH
  • Sub-Zero
  • Miele
  • Hestan Cue Inc.
  • Breville Group Limited
  • De’Longhi Appliances S.r.L.
  • Cie KG
  • Groupe SEB