Search Market Research Report

Discover Our Latest Reports
Discover Our Featured Reports
Discover Top Selling Reports

Shared Mobility Market Size, Share Global Analysis Report, 2020-2026

report img

Shared Mobility Market by Service (Ride Hailing, Bike Sharing, Ride Sharing, Car Sharing, and Others), By Vehicle (Cars, Two-Wheelers, and Others), and By Business Model (P2P, B2B, and B2C) - Global Industry Perspective, Comprehensive Analysis and Forecast 2020-2026

Industry Insights

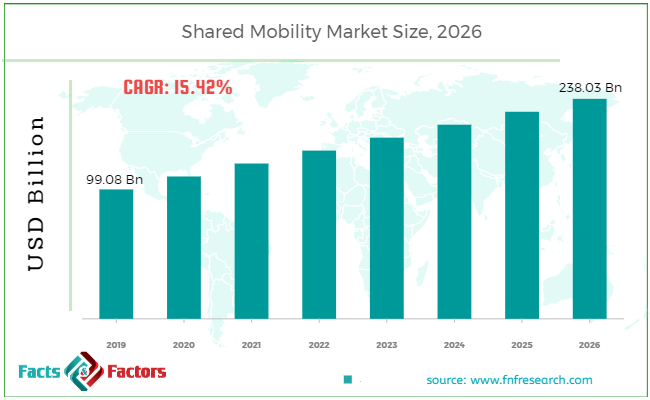
[175+ Pages Report] According to the report published by Facts Factors, the global shared mobility market size was worth around USD 99.08 billion in 2019 and is predicted to grow to around USD 238.03 billion by 2026 with a compound annual growth rate (CAGR) of roughly 15.42% between 2020 and 2026. The report analyzes the global shared mobility market drivers, restraints/challenges, and the effect they have on the demands during the projection period. In addition, the report explores emerging opportunities in the shared mobility market.

Shared Mobility Market Size

To know more about this report | Request Free Sample Copy

This specialized and expertise oriented industry research report scrutinizes the technical and commercial business outlook of the shared mobility industry. The report analyzes and declares the historical and current trends analysis of the shared mobility industry and subsequently recommends the projected trends anticipated to be observed in the Shared Mobility market during the upcoming years.

The shared mobility market report analyzes and notifies the industry statistics at the global as well as regional and country levels in order to acquire a thorough perspective of the entire Shared Mobility market. The historical and past insights are provided for FY 2016 to FY 2019 whereas projected trends are delivered for FY 2020 to FY 2026. The quantitative and numerical data is represented in terms of value (USD Million) from FY 2016 – 2026.


logoKey Insights from Primary Research

  • As per our primary analysis, the global shared mobility market is expected to reach around USD 238.03 billion 2026
  • Introduction of shared mobility services through electric vehicles is one of the key growth opportunities for market participant operative in global shared mobility market
  • Ride hailing service segment is continue to maintain its dominance throughout analysis period and expected to acquire 15.42% of share in 2026 as well.
  • According to our respondent, North America held the largest region for the global Shared Mobility market and it accounted for the highest market share of total revenue generated in 2019. The major factors driving the market are the presence of prominent market players like IBM, Accuity, Broadridge, Deloitte, Thomson Reuters, and Trulioo etc. in this region. The U.S. is the leading market in the North American region and holds the significant market share in the global market. Increasing adoption of the Shared Mobility solutions in the North American region to reduce compliance cost by the financial industries using advanced technology such as blockchain, Artificial Intelligence (AI), big data, Machine Learning (ML), and cloud computing is helping in the growth of global Shared Mobility market.

logoKey Recommendations from Analysts

  • As per our analysts, Shared Mobility market revenue was around USD 99.08 billion in 2019.
  • North America and Europe are other majority shareholders in the shared mobility market after Asia Pacific. The regions have accounted significant automobile manufacturers contribution towards shared transportation services. For instance, in July 17, 2018, BMW has launched “ReachNow arm” that offers car sharing and ride hailing services across USA. Furthermore, the adoption of advanced technologies in the cars and other vehicles is expected to prominently accelerate the North America market. For example, Zipcar has used Zipcard technology for automatically unlocking the door and accessing the vehicle.
  • Asia Pacific held the largest market share in terms of revenue for the year 2019. The growth is mainly driven by the large number of population along with significant presence of developing nations in the region. China, and India accounts high growth potential for the shared mobility services owing to the developing transportation infrastructure and growing number vehicle ownerships.
  • Uber Technologies Inc., Cabify, ANI Technologies Pvt. Ltd, The Hertz Corporation and Avis Budget Group Inc., are the amongst the key players to watch in global shared mobility marketplace.

The quantitative data is further underlined and reinforced by comprehensive qualitative data which comprises various across-the-board market dynamics. The rationales which directly or indirectly impact the Shared Mobility industry are exemplified through parameters such as growth drivers, restraints, challenges, and opportunities among other impacting factors.

Throughout our research report, we have encompassed all the proven models and tools of industry analysis and extensively illustrated all the key business strategies and business models adopted in the Shared Mobility industry. The report provides an all-inclusive and detailed competitive landscape prevalent in the shared mobility market.

The report utilizes established industry analysis tools and models such as Porter’s Five Forces framework to analyze and recognize critical business strategies adopted by various stakeholders involved in the entire value chain of the Shared Mobility industry. The Shared Mobility market report additionally employs SWOT analysis and PESTLE analysis models for further in-depth analysis.

The report study further includes an in-depth analysis of industry players' market shares and provides an overview of leading players' market position in the shared mobility sector. Key strategic developments in the Shared Mobility market competitive landscape such as acquisitions & mergers, inaugurations of different products and services, partnerships & joint ventures, MoU agreements, VC & funding activities, R&D activities, and geographic expansion among other noteworthy activities by key players of the Shared Mobility market are appropriately highlighted in the report.

By geography, the global shared mobility market is segmented into North America, Europe, Asia Pacific, Latin America, and Middle East & Africa. North America held majority of the revenue share in the global Shared Mobility market for the year 2019 coupled with the highest growth rate in the forecast period.

Growing adoption of electric vehicles in shared transportation coupled with limited parking space are the primary factors driving the shared mobility market. Furthermore, the government initiatives regarding increased greenhouse gas emission is expected to drive the shared mobility market in the analyzed period. For instance, in December 2017, Singapore government has launched electric car sharing project to encourage citizens to use shared mobility service and prevent the growth in car population. Additionally, in September 2016, European government has initiated to provide incentives to the promoters and users for the adoption of the low emission shared mobility services. However, reluctance in sharing the ride with stranger is hindering the market growth.

The Shared Mobility market research report delivers an acute valuation and taxonomy of the Shared Mobility industry by practically splitting the market on the basis of different segments and regions. Through the analysis of the historical and projected trends, all the segments and sub-segments were evaluated through the bottom-up approach, and different market sizes have been projected for FY 2020 to FY 2026.

logoReport Scope

Report Attribute

Details

Market Size in 2019

USD 99.08 Billion

Projected Market Size in 2026

USD 238.03 Billion

CAGR Growth Rate

15.42% CAGR

Base Year

2019

Forecast Years

2020-2026

Key Market Players

Uber Technologies Inc., Cabify, ANI Technologies Pvt. Ltd. (OLA), Gett, Lyft Inc., Europcar, Grab, Careem, Taxify OÜ, BlaBlaCar, Wingz Inc, Curb Mobility, Beijing Xiaoju Technology Co Ltd. (Didi Chuxing), The Hertz Corporation, Avis Budget Group Inc., and Enterprise Holdings Inc., and Others

Key Segment

By Service , Vehicle, Business, and Region

Major Regions Covered

North America, Europe, Asia Pacific, Latin America, and the Middle East & Africa

Purchase Options

Request customized purchase options to meet your research needs.Explore purchase options

The regional segmentation of the Shared Mobility industry includes the complete classification of all the major continents including North America, Latin America, Europe, Asia Pacific, and Middle East & Africa. Further, country-wise data for the Shared Mobility industry is provided for the leading economies of the world.

The shared mobility market is segmented on the basis of service, vehicle, and business model. The service segment of the shared mobility market is bifurcated into ride hailing, bike sharing, ride sharing, car sharing, and others. Based on business model, the shared mobility market is divided into P2P, B2B, and B2C. Car, Two-Wheeler and Others are the vehicle segment studied in the report.

logoSome of the prominent market players in the shared mobility market include

  • Uber Technologies Inc.
  • Cabify
  • ANI Technologies Pvt. Ltd. (OLA)
  • Gett Lyft Inc.
  • Europcar
  • Grab
  • Careem
  • Taxify OÜ
  • BlaBlaCar
  • Wingz Inc
  • Curb Mobility
  • Beijing Xiaoju Technology Co Ltd. (Didi Chuxing)
  • The Hertz Corporation
  • Avis Budget Group Inc

The report segments of the global shared mobility market as follows:

logoBy Service Segment Analysis

  • Ride Hailing
  • Bike Sharing
  • Ride Sharing
  • Car Sharing
  • Others

logoBy Vehicle Segment Analysis

  • Car
  • Two-Wheeler
  • Others

logoBy Business Model Segment Analysis

  • P2P
  • B2B
  • B2C

logoBy Regional Segment Analysis

  • North America
    • U.S.
    • Canada
  • Europe
    • UK
    • France
    • Germany
    • Italy
    • France
    • Rest of Europe
  • Asia Pacific
    • China
    • Japan
    • India
    • South Korea
    • Southeast Asia
    • Rest of Asia Pacific
  • Latin America
    • Brazil
    • Mexico
    • Rest of Latin America
  • Middle East & Africa
    • GCC Countries
    • South Africa
    • Rest of MEA

Table of Content

  1. CHAPTER 1. Executive Summary
  2. CHAPTER 2. Shared Mobility market – Service Analysis
    1. 2.1. Global Shared Mobility Market – Service Overview
    2. 2.2. Global Shared Mobility Market Share, by Service, 2019 & 2026 (USD Billion)
    3. 2.3. Ride Hailing
      1. 2.3.1. Global Ride Hailing Shared Mobility Market, 2016-2026 (USD Billion)
    4. 2.4. Bike Sharing
      1. 2.4.1. Global Bike Sharing Shared Mobility Market, 2016-2026 (USD Billion)
    5. 2.5. Ride Sharing
      1. 2.5.1. Global Ride Sharing Shared Mobility Market, 2016-2026 (USD Billion)
    6. 2.6. Car Sharing
      1. 2.6.1. Global Car Sharing Shared Mobility Market, 2016-2026 (USD Billion)
    7. 2.7. Others
      1. 2.7.1. Global Others Shared Mobility Market, 2016-2026 (USD Billion)
  3. CHAPTER 3. Shared Mobility market – Vehicle Analysis
    1. 3.1. Global Shared Mobility Market – Vehicle Overview
    2. 3.2. Global Shared Mobility Market Share, by Vehicle, 2019 & 2026 (USD Billion)
    3. 3.3. Car
      1. 3.3.1. Global Car Shared Mobility Market, 2016-2026 (USD Billion)
    4. 3.4. Two-Wheeler
      1. 3.4.1. Global Two-Wheeler Shared Mobility Market, 2016-2026 (USD Billion)
    5. 3.5. Others
      1. 3.5.1. Global Others Shared Mobility Market, 2016-2026 (USD Billion)
  4. CHAPTER 4. Shared Mobility market – Business Model Analysis
    1. 4.1. Global Shared Mobility Market – Business Model Overview
    2. 4.2. Global Shared Mobility Market Share, by Business Model, 2019 & 2026 (USD Billion)
    3. 4.3. P2P
      1. 4.3.1. Global P2P Shared Mobility Market, 2016-2026 (USD Billion)
    4. 4.4. B2B
      1. 4.4.1. Global B2B Shared Mobility Market, 2016-2026 (USD Billion)
    5. 4.5. B2C
      1. 4.5.1. Global B2C Shared Mobility Market, 2016-2026 (USD Billion)
  5. CHAPTER 5. Shared Mobility market – Regional Analysis
    1. 5.1. Global Shared Mobility Market Regional Overview
    2. 5.2. Global Shared Mobility Market Share, by Region, 2019 & 2026 (Value)
    3. 5.3. North America
      1. 5.3.1. North America Shared Mobility Market size and forecast, 2016-2026
      2. 5.3.2. North America Shared Mobility Market, by Country, 2019 & 2026 (USD Billion)
      3. 5.3.3. North America Shared Mobility Market, by Service, 2016-2026
        1. 5.3.3.1. North America Shared Mobility Market, by Service, 2016-2026 (USD Billion)
      4. 5.3.4. North America Shared Mobility Market, by Vehicle, 2016-2026
        1. 5.3.4.1. North America Shared Mobility Market, by Vehicle, 2016-2026 (USD Billion)
      5. 5.3.5. North America Shared Mobility Market, by Business Model, 2016-2026
        1. 5.3.5.1. North America Shared Mobility Market, by Business Model, 2016-2026 (USD Billion)
      6. 5.3.6. U.S.
        1. 5.3.6.1. U.S. Market size and forecast, 2016-2026 (USD Billion)
      7. 5.3.7. Canada
        1. 5.3.7.1. Canada Market size and forecast, 2016-2026 (USD Billion)
    4. 5.4. Europe
      1. 5.4.1. Europe Shared Mobility Market size and forecast, 2016-2026
      2. 5.4.2. Europe Shared Mobility Market, by Country, 2019 & 2026 (USD Billion)
      3. 5.4.3. Europe Shared Mobility Market, by Service, 2016-2026
        1. 5.4.3.1. Europe Shared Mobility Market, by Service, 2016-2026 (USD Billion)
      4. 5.4.4. Europe Shared Mobility Market, by Vehicle, 2016-2026
        1. 5.4.4.1. Europe Shared Mobility Market, by Vehicle, 2016-2026 (USD Billion)
      5. 5.4.5. Europe Shared Mobility Market, by Business Model, 2016-2026
        1. 5.4.5.1. Europe Shared Mobility Market, by Business Model, 2016-2026 (USD Billion)
      6. 5.4.6. Germany
        1. 5.4.6.1. Germany Market size and forecast, 2016-2026 (USD Billion)
      7. 5.4.7. France
        1. 5.4.7.1. France Market size and forecast, 2016-2026 (USD Billion)
      8. 5.4.8. U.K.
        1. 5.4.8.1. U.K. Market size and forecast, 2016-2026 (USD Billion)
      9. 5.4.9. Italy
        1. 5.4.9.1. Italy Market size and forecast, 2016-2026 (USD Billion)
      10. 5.4.10. Spain
        1. 5.4.10.1. Spain Market size and forecast, 2016-2026 (USD Billion)
      11. 5.4.11. Rest of Europe
        1. 5.4.11.1. Rest of Europe Market size and forecast, 2016-2026 (USD Billion)
    5. 5.5. Asia Pacific
      1. 5.5.1. Asia Pacific Shared Mobility Market size and forecast, 2016-2026
      2. 5.5.2. Asia Pacific Shared Mobility Market, by Country, 2019 & 2026 (USD Billion)
      3. 5.5.3. Asia Pacific Shared Mobility Market, by Service, 2016-2026
        1. 5.5.3.1. Asia Pacific Shared Mobility Market, by Service, 2016-2026 (USD Billion)
      4. 5.5.4. Asia Pacific Shared Mobility Market, by Vehicle, 2016-2026
        1. 5.5.4.1. Asia Pacific Shared Mobility Market, by Vehicle, 2016-2026 (USD Billion)
      5. 5.5.5. Asia Pacific Shared Mobility Market, by Business Model, 2016-2026
        1. 5.5.5.1. Asia Pacific Shared Mobility Market, by Business Model, 2016-2026 (USD Billion)
      6. 5.5.6. China
        1. 5.5.6.1. China Market size and forecast, 2016-2026 (USD Billion)
      7. 5.5.7. Japan
        1. 5.5.7.1. Japan Market size and forecast, 2016-2026 (USD Billion)
      8. 5.5.8. India
        1. 5.5.8.1. India Market size and forecast, 2016-2026 (USD Billion)
      9. 5.5.9. South Korea
        1. 5.5.9.1. South Korea Market size and forecast, 2016-2026 (USD Billion)
      10. 5.5.10. South-East Asia
        1. 5.5.10.1. South-East Asia Market size and forecast, 2016-2026 (USD Billion)
      11. 5.5.11. Rest of Asia Pacific
        1. 5.5.11.1. Rest of Asia Pacific Market size and forecast, 2016-2026 (USD Billion)
    6. 5.6. Latin America
      1. 5.6.1. Latin America Shared Mobility Market size and forecast, 2016-2026
      2. 5.6.2. Latin America Shared Mobility Market, by Country, 2019 & 2026 (USD Billion)
      3. 5.6.3. Latin America Shared Mobility Market, by Service, 2016-2026
        1. 5.6.3.1. Latin America Shared Mobility Market, by Service, 2016-2026 (USD Billion)
      4. 5.6.4. Latin America Shared Mobility Market, by Vehicle, 2016-2026
        1. 5.6.4.1. Latin America Shared Mobility Market, by Vehicle, 2016-2026 (USD Billion)
      5. 5.6.5. Latin America Shared Mobility Market, by Business Model, 2016-2026
        1. 5.6.5.1. Latin America Shared Mobility Market, by Business Model, 2016-2026 (USD Billion)
      6. 5.6.6. Brazil
        1. 5.6.6.1. Brazil Market size and forecast, 2016-2026 (USD Billion)
      7. 5.6.7. Mexico
        1. 5.6.7.1. Mexico Market size and forecast, 2016-2026 (USD Billion)
      8. 5.6.8. Rest of Latin America
        1. 5.6.8.1. Rest of Latin America Market size and forecast, 2016-2026 (USD Billion)
    7. 5.7. The Middle-East and Africa
      1. 5.7.1. The Middle-East and Africa Shared Mobility Market size and forecast, 2016-2026
      2. 5.7.2. The Middle-East and Africa Shared Mobility Market, by Country, 2019 & 2026 (USD Billion)
      3. 5.7.3. The Middle-East and Africa Shared Mobility Market, by Service, 2016-2026
        1. 5.7.3.1. The Middle-East and Africa Shared Mobility Market, by Service, 2016-2026 (USD Billion)
      4. 5.7.4. The Middle-East and Africa Shared Mobility Market, by Vehicle, 2016-2026
        1. 5.7.4.1. The Middle-East and Africa Shared Mobility Market, by Vehicle, 2016-2026 (USD Billion)
      5. 5.7.5. The Middle-East and Africa Shared Mobility Market, by Business Model, 2016-2026
        1. 5.7.5.1. The Middle-East and Africa Shared Mobility Market, by Business Model, 2016-2026 (USD Billion)
      6. 5.7.6. GCC Countries
        1. 5.7.6.1. GCC Countries Market size and forecast, 2016-2026 (USD Billion)
      7. 5.7.7. South Africa
        1. 5.7.7.1. South Africa Market size and forecast, 2016-2026 (USD Billion)
      8. 5.7.8. Rest of Middle-East Africa
        1. 5.7.8.1. Rest of Middle-East Africa Market size and forecast, 2016-2026 (USD Billion)
  6. CHAPTER 6. Shared Mobility market – Competitive Landscape
    1. 6.1. Competitor Market Share – Revenue
    2. 6.2. Market Concentration Rate Analysis, Top 3 and Top 5 Players
    3. 6.3. Strategic Development
      1. 6.3.1. Acquisitions and Mergers
      2. 6.3.2. New Products
      3. 6.3.3. Research & Development Activities
  7. CHAPTER 7. Company Profiles
    1. 7.1. Uber Technologies Inc.
      1. 7.1.1. Company Overview
      2. 7.1.2. Uber Technologies Inc. Revenue and Gross Margin
      3. 7.1.3. Product portfolio
      4. 7.1.4. Recent initiatives
    2. 7.2. Cabify
      1. 7.2.1. Company Overview
      2. 7.2.2. Cabify Revenue and Gross Margin
      3. 7.2.3. Product portfolio
      4. 7.2.4. Recent initiatives
    3. 7.3. ANI Technologies Pvt. Ltd. (OLA),
      1. 7.3.1. Company Overview
      2. 7.3.2. ANI Technologies Pvt. Ltd. (OLA), Revenue and Gross Margin
      3. 7.3.3. Product portfolio
      4. 7.3.4. Recent initiatives
    4. 7.4. Gett, Lyft Inc.
      1. 7.4.1. Company Overview
      2. 7.4.2. Gett, Lyft Inc. Revenue and Gross Margin
      3. 7.4.3. Product portfolio
      4. 7.4.4. Recent initiatives
    5. 7.5. Europcar
      1. 7.5.1. Company Overview
      2. 7.5.2. Europcar Revenue and Gross Margin
      3. 7.5.3. Product portfolio
      4. 7.5.4. Recent initiatives
    6. 7.6. Grab
      1. 7.6.1. Company Overview
      2. 7.6.2. Grab Revenue and Gross Margin
      3. 7.6.3. Product portfolio
      4. 7.6.4. Recent initiatives
    7. 7.7. Careem
      1. 7.7.1. Company Overview
      2. 7.7.2. Careem Revenue and Gross Margin
      3. 7.7.3. Product portfolio
      4. 7.7.4. Recent initiatives
    8. 7.8. Enterprise Holdings Inc
      1. 7.8.1. Company Overview
      2. 7.8.2. Enterprise Holdings Inc Revenue and Gross Margin
      3. 7.8.3. Product portfolio
      4. 7.8.4. Recent initiatives
    9. 7.9. Taxify OÜ
      1. 7.9.1. Company Overview
      2. 7.9.2. Taxify OÜ Revenue and Gross Margin
      3. 7.9.3. Product portfolio
      4. 7.9.4. Recent initiatives
    10. 7.10. BlaBlaCar
      1. 7.10.1. Company Overview
      2. 7.10.2. BlaBlaCar Revenue and Gross Margin
      3. 7.10.3. Product portfolio
      4. 7.10.4. Recent initiatives
    11. 7.11. Wingz Inc
      1. 7.11.1. Company Overview
      2. 7.11.2. Wingz Inc Revenue and Gross Margin
      3. 7.11.3. Product portfolio
      4. 7.11.4. Recent initiatives
    12. 7.12. Curb Mobility
      1. 7.12.1. Company Overview
      2. 7.12.2. Curb Mobility Revenue and Gross Margin
      3. 7.12.3. Product portfolio
      4. 7.12.4. Recent initiatives
    13. 7.13. Beijing Xiaoju Technology Co Ltd.
      1. 7.13.1. Company Overview
      2. 7.13.2. Beijing Xiaoju Technology Co Ltd. Revenue and Gross Margin
      3. 7.13.3. Product portfolio
      4. 7.13.4. Recent initiatives
    14. 7.14. The Hertz Corporation, Avis Budget Group Inc.
      1. 7.14.1. Company Overview
      2. 7.14.2. The Hertz Corporation, Avis Budget Group Inc. Revenue and Gross Margin
      3. 7.14.3. Product portfolio
      4. 7.14.4. Recent initiatives
    15. 7.15. Enterprise Holdings Inc.
      1. 7.15.1. Company Overview
      2. 7.15.2. Enterprise Holdings Inc. Revenue and Gross Margin
      3. 7.15.3. Product portfolio
      4. 7.15.4. Recent initiatives
  8. CHAPTER 8. Shared Mobility — Industry Analysis
    1. 8.1. Shared Mobility Market – Key Trends
      1. 8.1.1. Market Drivers
      2. 8.1.2. Market Restraints
      3. 8.1.3. Market Opportunities
    2. 8.2. Value Chain Analysis
    3. 8.3. Technology Roadmap and Timeline
    4. 8.4. Shared Mobility Market – Attractiveness Analysis
      1. 8.4.1. By Service
      2. 8.4.2. By Vehicle
      3. 8.4.3. By Business Model
      4. 8.4.4. By Region
  9. CHAPTER 9. Marketing Strategy Analysis, Distributors
    1. 9.1. Marketing Channel
    2. 9.2. Direct Marketing
    3. 9.3. Indirect Marketing
    4. 9.4. Marketing Channel Development Trend
    5. 9.5. Economic/Political Environmental Change
  10. CHAPTER 10. Report Conclusion
  11. CHAPTER 11. Research Approach & Methodology
    1. 11.1. Report Description
    2. 11.2. Research Scope
    3. 11.3. Research Methodology
      1. 11.3.1. Secondary Research
      2. 11.3.2. Primary Research
      3. 11.3.3. Models
        1. 11.3.3.1. Company Share Analysis Model
        2. 11.3.3.2. Revenue Based Modeling
        3. 11.3.3.3. Research Limitations

        List of Figures

        FIG. 1 Global Shared Mobility Market, 2016-2026 (USD Billion)
        FIG. 2 Global Shared Mobility Market Share, by Service, 2019 & 2026 (USD Billion)
        FIG. 3 Global Ride Hailing Shared Mobility Market, 2016-2026 (USD Billion)
        FIG. 4 Global Bike Sharing Shared Mobility Market, 2016-2026 (USD Billion)
        FIG. 5 Global Ride Sharing Shared Mobility Market, 2016-2026 (USD Billion)
        FIG. 6 Global Car Sharing Shared Mobility Market, 2016-2026 (USD Billion)
        FIG. 7 Global Others Shared Mobility Market, 2016-2026 (USD Billion)
        FIG. 8 Global Shared Mobility Market Share, by Vehicle, 2019 & 2026 (USD Billion)
        FIG. 9 Global Car Shared Mobility Market, 2016-2026 (USD Billion)
        FIG. 10 Global Two-Wheeler Shared Mobility Market, 2016-2026 (USD Billion)
        FIG. 11 Global Others Shared Mobility Market, 2016-2026 (USD Billion)
        FIG. 12 Global Shared Mobility Market Share, by Business Model, 2019 & 2026 (USD Billion)
        FIG. 13 Global P2P Shared Mobility Market, 2016-2026 (USD Billion)
        FIG. 14 Global B2B Shared Mobility Market, 2016-2026 (USD Billion)
        FIG. 15 Global B2C Shared Mobility Market, 2016-2026 (USD Billion)
        FIG. 16 Global Shared Mobility Market Share, by Region, 2019 & 2026
        FIG. 17 North America Shared Mobility Market, 2016-2026
        FIG. 18 U.S. Shared Mobility Market, 2016-2026
        FIG. 19 Canada Shared Mobility Market, 2016-2026
        FIG. 20 Europe Shared Mobility Market, 2016-2026
        FIG. 21 Germany Shared Mobility Market, 2016-2026
        FIG. 22 France Shared Mobility Market, 2016-2026
        FIG. 23 U.K. Shared Mobility Market, 2016-2026
        FIG. 24 Italy Shared Mobility Market, 2016-2026
        FIG. 25 Spain Shared Mobility Market, 2016-2026
        FIG. 26 Rest of Europe Shared Mobility Market, 2016-2026
        FIG. 27 Asia Pacific Shared Mobility Market, 2016-2026
        FIG. 28 China Shared Mobility Market, 2016-2026
        FIG. 29 Japan Shared Mobility Market, 2016-2026
        FIG. 30 India Shared Mobility Market, 2016-2026
        FIG. 31 South  Korea Shared Mobility Market, 2016-2026
        FIG. 32 South-East Asia Shared Mobility Market, 2016-2026
        FIG. 33 Rest of Asia Pacific Shared Mobility Market, 2016-2026
        FIG. 34 Latin America Shared Mobility Market, 2016-2026
        FIG. 35 Brazil Shared Mobility Market, 2016-2026
        FIG. 36 Mexico Shared Mobility Market, 2016-2026
        FIG. 37 Rest of Latin America Shared Mobility Market, 2016-2026
        FIG. 38 The Middle-East and Africa Shared Mobility Market, 2016-2026
        FIG. 39 GCC Countries Shared Mobility Market, 2016-2026
        FIG. 40 South Africa Shared Mobility Market, 2016-2026
        FIG. 41 Rest of Middle-East Africa Shared Mobility Market, 2016-2026
        FIG. 42 Competitor Market Share – Revenue
        FIG. 43 Uber Technologies Inc. Revenue and Growth Rate
        FIG. 44 Uber Technologies Inc. Market Share
        FIG. 45 Cabify Revenue and Growth Rate
        FIG. 46 Cabify Market Share
        FIG. 47 ANI Technologies Pvt. Ltd. (OLA), Revenue and Growth Rate
        FIG. 48 ANI Technologies Pvt. Ltd. (OLA), Market Share
        FIG. 49 Gett, Lyft Inc. Revenue and Growth Rate
        FIG. 50 Gett, Lyft Inc. Market Share
        FIG. 51 Europcar Revenue and Growth Rate
        FIG. 52 Europcar Market Share
        FIG. 53 Grab Revenue and Growth Rate
        FIG. 54 Grab Market Share
        FIG. 55 Careem Revenue and Growth Rate
        FIG. 56 Careem Market Share
        FIG. 57 Enterprise Holdings Inc Revenue and Growth Rate
        FIG. 58 Enterprise Holdings Inc Market Share
        FIG. 59 Taxify OÜ Revenue and Growth Rate
        FIG. 60 Taxify OÜ Market Share
        FIG. 61 BlaBlaCar Revenue and Growth Rate
        FIG. 62 BlaBlaCar Market Share
        FIG. 63 Wingz Inc Revenue and Growth Rate
        FIG. 64 Wingz Inc Market Share
        FIG. 65 Curb Mobility Revenue and Growth Rate
        FIG. 66 Curb Mobility Market Share
        FIG. 67 Beijing Xiaoju Technology Co Ltd. Revenue and Growth Rate
        FIG. 68 Beijing Xiaoju Technology Co Ltd. Market Share
        FIG. 69 The Hertz Corporation, Avis Budget Group Inc. Revenue and Growth Rate
        FIG. 70 The Hertz Corporation, Avis Budget Group Inc. Market Share
        FIG. 71 Enterprise Holdings Inc. Revenue and Growth Rate
        FIG. 72 Enterprise Holdings Inc. Market Share
        FIG. 73 Market Dynamics
        FIG. 74 Global Shared Mobility – Value Chain Analysis
        FIG. 75 Technology Roadmap and Timeline
        FIG. 76 Market Attractiveness Analysis – By Service
        FIG. 77 Market Attractiveness Analysis – By Vehicle
        FIG. 78 Market Attractiveness Analysis – By Business Model
        FIG. 79 Market Attractiveness Analysis – By Region
        FIG. 80 Market Channel
        FIG. 81 Marketing Channel Development Trend
        FIG. 82 Growth in World Gross Product, 2008-2018

        List of Tables

        TABLE 1 Global Shared Mobility Market, 2019 & 2026 (USD Billion)
        TABLE 2 Global Shared Mobility market, by Service, 2016-2026 (USD Billion)
        TABLE 3 Global Shared Mobility market, by Vehicle, 2016-2026 (USD Billion)
        TABLE 4 Global Shared Mobility market, by Business Model, 2016-2026 (USD Billion)
        TABLE 5 Global Shared Mobility market, by Region, 2016-2026 (USD Billion)
        TABLE 6 North America Shared Mobility Market, by Service, 2016-2026 (USD Billion)
        TABLE 7 North America Shared Mobility Market, by Vehicle, 2016-2026 (USD Billion)
        TABLE 8 North America Shared Mobility Market, by Business Model, 2016-2026 (USD Billion)
        TABLE 9 Europe Shared Mobility Market, by Service, 2016-2026 (USD Billion)
        TABLE 10 Europe Shared Mobility Market, by Vehicle, 2016-2026 (USD Billion)
        TABLE 11 Europe Shared Mobility Market, by Business Model, 2016-2026 (USD Billion)
        TABLE 12 Asia Pacific Shared Mobility Market, by Service, 2016-2026 (USD Billion)
        TABLE 13 Asia Pacific Shared Mobility Market, by Vehicle, 2016-2026 (USD Billion)
        TABLE 14 Asia Pacific Shared Mobility Market, by Business Model, 2016-2026 (USD Billion)
        TABLE 15 Latin America Shared Mobility Market, by Service, 2016-2026 (USD Billion)
        TABLE 16 Latin America Shared Mobility Market, by Vehicle, 2016-2026 (USD Billion)
        TABLE 17 Latin America Shared Mobility Market, by Business Model, 2016-2026 (USD Billion)
        TABLE 18 The Middle-East and Africa Shared Mobility Market, by Service, 2016-2026 (USD Billion)
        TABLE 19 The Middle-East and Africa Shared Mobility Market, by Vehicle, 2016-2026 (USD Billion)
        TABLE 20 The Middle-East and Africa Shared Mobility Market, by Business Model, 2016-2026 (USD Billion)
        TABLE 21 Global Shared Mobility Market - Company Revenue Analysis 2016-2019 (USD Billion)
        TABLE 22 Global Shared Mobility Market - Company Revenue Share Analysis 2016-2019(%)
        TABLE 23 Acquisitions and Mergers
        TABLE 24 New Product/Service Launch
        TABLE 25 Research & Development Activities
        TABLE 26 Market Drivers
        TABLE 27 Market Restraints
        TABLE 28 Market Opportunities

Industry Major Market Players

  • Uber Technologies Inc.
  • Cabify
  • ANI Technologies Pvt. Ltd. (OLA)
  • Gett Lyft Inc.
  • Europcar
  • Grab
  • Careem
  • Taxify OÜ
  • BlaBlaCar
  • Wingz Inc
  • Curb Mobility
  • Beijing Xiaoju Technology Co Ltd. (Didi Chuxing)
  • The Hertz Corporation
  • Avis Budget Group Inc