Search Market Research Report

Discover Our Latest Reports
Discover Our Featured Reports
Discover Top Selling Reports

Sales Force Automation (SFA) Market Size, Share Global Analysis Report, 2021 - 2026

report img

Sales Force Automation (SFA) Market By Deployment Mode (Cloud Based& On-Premises), By Enterprise Size (Large Enterprises & SMEs), By Application (Lead Management, Sales Forecasting, Order & Invoices Management, Opportunity Management, & Others), By Industry Verticals (BSFI, Retail, Healthcare, IT & Telecom, Manufacturing, & Others), And By Regions - Global & Regional Industry Perspective, Comprehensive Analysis, and Forecast 2021 - 2026

Industry Insights

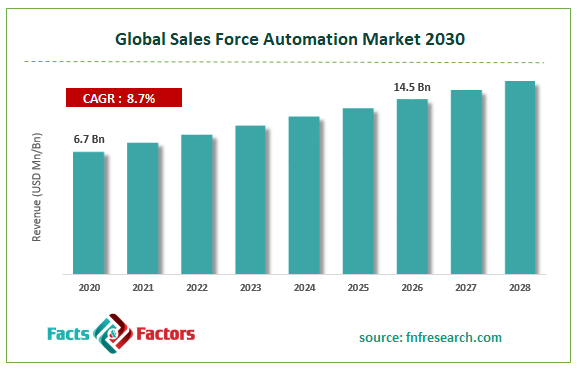
[180+ Pages Report] Facts & Factors recently published  “Global Sales Force Automation (SFA) Market” report encompasses the spectacle of the analytics of the market. In this study, the global sales force automation (SFA) market will be valued to be USD 14.5 Billion in the year 2026 from an initial value of USD 6.7 Billion in the year 2020 at a CAGR value of 8.7%.

Global Sales Force Automation Market Size

To know more about this report | Request Free Sample Copy

logoMarket Overview

Salesforce automation tools is the inclusion of automation for the sole benefit of increasing efficiency during all parts of the sales process. SFA tools pivot their focus on repetitive and administrative tasks which are often deemed as important; however, are highly time-consuming. These software tools usually automate tasks that are often interpolated from the input parameters. Integrated tasks such as reporting and analytics tools are incorporated within these tools for added functionalities.

logoIndustry Growth Factors

The global sales force automation (SFA) market is expected to witness a higher growth stage during the forecast period due to attributing factors owing to rising adoption of cloud-based SFA tools coupled with increased demand for sales forecasting tools from sectors pertaining to banking, retail, and IT & communication to name a few. Additionally, the integration of features such as artificial intelligence and machine learning coupled with the deployment of cloud technology is expected to increase the footprint of the global sales force automation (SFA) market during the forecast period. Moreover, increasing functionality of the SFA tools in terms of automating, expanding, and supercharging measures coupled with predictive lead scoring solutions are expected to boost the growth of the global sales force automation (SFA) market during the forecast period.

The global sales force automation (SFA) market is expected to be driven by factors attributing to lead management over sales, forecasting and opportunity management, contact management, relation management, and analytics-based solutions to name a few. Factors pertaining to the rising demand for streamlining the sales processes and effective utilization of workspace measures are expected to boost the global sales force automation (SFA) market during the forecast period. However, the higher cost of implementation and a requirement of higher-skilled workforce are expected to hamper the growth of the global sales force automation (SFA) market during the forecast period.

logoSegmentation Analysis

The global sales force automation (SFA) market is segmented into deployment mode, enterprise size, application, industry vertical, and region.

On the basis of deployment mode, the global sales force automation (SFA) market is divided into cloud-based and on-premises. The cloud-based segment is expected to witness the largest market share during the advent of the forecast owing to the rising utility of the cloud-based platform coupled with the integration of lead generation, marketing, sales, customer services, and business analytics, among others.

On the basis of enterprise size, the global sales force automation (SFA) market is categorized into large enterprises and SMEs.The segment pertaining to large enterprises is expected to witness the largest market share during the advent of the forecast owing to increasing budget in terms of automating and streamlining processes to meet the rising number of larger enterprises on a global purview.

On the basis of application, the global sales force automation (SFA) market is segmented into lead management, sales forecasting, order and invoices management, opportunity management, and others. From these, the lead management segment is expected to occupy the largest market share during the advent of the forecast owing to the primary functionality of the latter segment in terms of creating, assigning, ordering, and invoice management formats coupled with optimizing campaigns across all marketing opportunities to name a few.

Based on industry verticals, the global sales force automation (SFA) market can be fragmented across BSFI, retail, healthcare, IT & telecom, manufacturing, and others. The segment pertaining to BSFI is expected to witness the largest market share during the advent of the forecast owing to combinative opportunities for the latter segment in terms of opportunity management, lead management, and customer relationship management coupled with rising functionality of customizable interface solutions to name a few.

logo Report Scope

Report Attribute

Details

Market Size in 2020

USD 6.7 Billion

Projected Market Size in 2026

USD 14.5 Billion

CAGR Growth Rate

8.7% CAGR

Base Year

2020

Forecast Years

2021-2026

Key Market Players

Salesforce.com, Inc., Microsoft Corporation, SAP SE, Oracle Corporation, Bpm’online, Apteam Inc., Zoho Corporation, INFOR, Inc., CRMNEXT, SugarCRM, Pegasystems, and Infusionsoft, among others

Key Segments

Deployment Mode, Enterprise Size, Application, Industry Verticals, and Region

Major Regions Covered

North America, Europe, Asia Pacific, Latin America, and Middle East & Africa

Purchase Options

Request customized purchase options to meet your research needs. Explore purchase options

logo Regional Analysis

North America is expected to witness the largest market share during the advent of the forecast owing to rising investment measures from large organizations coupled with the integration of AI-based measures across the key market participants in the region to name a few. Additionally, the rising availability of cloud-based software coupled with the rising number of reliable vendors in the region is expected to increase the footprint of the sales force automation (SFA) market during the forecast period. Asia-Pacific is expected to witness the fastest growing CAGR during the advent of the forecast owing to the rising retail, banking, and financial services in the region coupled with AI-based sales forces automation measures to name a few.

logo Competitive Players

The key market participants for the global sales force automation (SFA) market are:

  • Salesforce.com Inc.
  • Microsoft Corporation
  • SAP SE
  • Oracle Corporation
  • Bpm’online
  • Apteam Inc.
  • Zoho Corporation
  • INFOR Inc.
  • CRMNEXT
  • SugarCRM
  • Pegasystems
  • Infusionsoft

logo By Deployment Mode Segment Analysis

  • Cloud Based
  • On-Premises

logo By Enterprise Size Segment Analysis

  • Large Enterprises
  • SMEs

logo By Application Segment Analysis

  • Lead Management
  • Sales Forecasting
  • Order & Invoices Management
  • Opportunity Management
  • Others

logo By Industry Verticals Segment Analysis

  • BSFI
  • Retail
  • Healthcare
  • IT & Telecom
  • Manufacturing
  • Others

Table of Content

  1. Chapter 1 Executive Summary
    1. 1.1. Introduction of Sales Force Automation (SFA)
    2. 1.2. Global Sales Force Automation (SFA) Market, 2019 & 2026 (USD Billion)
    3. 1.3. Global Sales Force Automation (SFA) Market, 2016 – 2026 (USD Billion)
    4. 1.4. Global Sales Force Automation (SFA) Market Absolute Revenue Opportunity, 2016 – 2026 (USD Billion)
    5. 1.5. Global Sales Force Automation (SFA) Market Incremental Revenue Opportunity, 2020 – 2026 (USD Billion)
  2. Chapter 2 Sales Force Automation (SFA) Market – Deployment Mode Analysis
    1. 2.1. Global Sales Force Automation (SFA) Market – Deployment Mode Overview
    2. 2.2. Global Sales Force Automation (SFA) Market Share, by Deployment Mode, 2019 & 2026 (USD Billion)
    3. 2.3. Cloud Based
      1. 2.3.1. Global Cloud Based Sales Force Automation (SFA) Market, 2016 – 2026 (USD Billion)
    4. 2.4. On-Premises
      1. 2.4.1. Global On-Premises Sales Force Automation (SFA) Market, 2016 – 2026 (USD Billion)
  3. Chapter 3 Sales Force Automation (SFA) Market – Enterprise Size Analysis
    1. 3.1. Global Sales Force Automation (SFA) Market – Enterprise Size Overview
    2. 3.2. Global Sales Force Automation (SFA) Market Share, by Enterprise Size, 2019 & 2026 (USD Billion)
    3. 3.3. Large Enterprises
      1. 3.3.1. Global Large Enterprises Sales Force Automation (SFA) Market, 2016 – 2026 (USD Billion)
    4. 3.4. SMEs
      1. 3.4.1. Global SMEs Sales Force Automation (SFA) Market, 2016 – 2026 (USD Billion)
  4. Chapter 4 Sales Force Automation (SFA) Market – Application Analysis
    1. 4.1. Global Sales Force Automation (SFA) Market – Application Overview
    2. 4.2. Global Sales Force Automation (SFA) Market Share, by Application, 2019 & 2026 (USD Billion)
    3. 4.3. Lead Management
      1. 4.3.1. Global Lead Management Sales Force Automation (SFA) Market, 2016 – 2026 (USD Billion)
    4. 4.4. Sales Forecasting
      1. 4.4.1. Global Sales Forecasting Sales Force Automation (SFA) Market, 2016 – 2026 (USD Billion)
    5. 4.5. Order & Invoices Management
      1. 4.5.1. Global Order & Invoices Management Sales Force Automation (SFA) Market, 2016 – 2026 (USD Billion)
    6. 4.6. Opportunity Management
      1. 4.6.1. Global Opportunity Management Sales Force Automation (SFA) Market, 2016 – 2026 (USD Billion)
    7. 4.7. Others
      1. 4.7.1. Global Others Sales Force Automation (SFA) Market, 2016 – 2026 (USD Billion)
  5. Chapter 5 Sales Force Automation (SFA) Market – Industry Verticals Analysis
    1. 5.1. Global Sales Force Automation (SFA) Market – Industry Verticals Overview
    2. 5.2. Global Sales Force Automation (SFA) Market Share, by Industry Verticals, 2019 & 2026 (USD Billion)
    3. 5.3. BSFI
      1. 5.3.1. Global BSFI Sales Force Automation (SFA) Market, 2016 – 2026 (USD Billion)
    4. 5.4. Retail
      1. 5.4.1. Global Retail Sales Force Automation (SFA) Market, 2016 – 2026 (USD Billion)
    5. 5.5. Healthcare
      1. 5.5.1. Global Healthcare Sales Force Automation (SFA) Market, 2016 – 2026 (USD Billion)
    6. 5.6. IT & Telecom
      1. 5.6.1. Global IT & Telecom Sales Force Automation (SFA) Market, 2016 – 2026 (USD Billion)
    7. 5.7. Manufacturing
      1. 5.7.1. Global Manufacturing Sales Force Automation (SFA) Market, 2016 – 2026 (USD Billion)
    8. 5.8. Others
      1. 5.8.1. Global Others Sales Force Automation (SFA) Market, 2016 – 2026 (USD Billion)
  6. Chapter 6 Sales Force Automation (SFA) Market – Regional Analysis
    1. 6.1. Global Sales Force Automation (SFA) Market Regional Overview
    2. 6.2. Global Sales Force Automation (SFA) Market Share, by Region, 2019 & 2026 (USD Billion)
    3. 6.3. North America
      1. 6.3.1. North America Sales Force Automation (SFA) Market, 2016 – 2026 (USD Billion)
        1. 6.3.1.1. North America Sales Force Automation (SFA) Market, by Country, 2016 - 2026 (USD Billion)
      2. 6.3.2. North America Sales Force Automation (SFA) Market, by Deployment Mode, 2016 – 2026
        1. 6.3.2.1. North America Sales Force Automation (SFA) Market, by Deployment Mode, 2016 – 2026 (USD Billion)
      3. 6.3.3. North America Sales Force Automation (SFA) Market, by Enterprise Size, 2016 – 2026
        1. 6.3.3.1. North America Sales Force Automation (SFA) Market, by Enterprise Size, 2016 – 2026 (USD Billion)
      4. 6.3.4. North America Sales Force Automation (SFA) Market, by Application, 2016 – 2026
        1. 6.3.4.1. North America Sales Force Automation (SFA) Market, by Application, 2016 – 2026 (USD Billion)
      5. 6.3.5. North America Sales Force Automation (SFA) Market, by Industry Verticals, 2016 – 2026
        1. 6.3.5.1. North America Sales Force Automation (SFA) Market, by Industry Verticals, 2016 – 2026 (USD Billion)
      6. 6.3.6. U.S.
        1. 6.3.6.1. U.S. Sales Force Automation (SFA) Market, 2016 – 2026 (USD Billion)
      7. 6.3.7. Canada
        1. 6.3.7.1. Canada Sales Force Automation (SFA) Market, 2016 – 2026 (USD Billion)
    4. 6.4. Europe
      1. 6.4.1. Europe Sales Force Automation (SFA) Market, 2016 – 2026 (USD Billion)
        1. 6.4.1.1. Europe Sales Force Automation (SFA) Market, by Country, 2016 - 2026 (USD Billion)
      2. 6.4.2. Europe Sales Force Automation (SFA) Market, by Deployment Mode, 2016 – 2026
        1. 6.4.2.1. Europe Sales Force Automation (SFA) Market, by Deployment Mode, 2016 – 2026 (USD Billion)
      3. 6.4.3. Europe Sales Force Automation (SFA) Market, by Enterprise Size, 2016 – 2026
        1. 6.4.3.1. Europe Sales Force Automation (SFA) Market, by Enterprise Size, 2016 – 2026 (USD Billion)
      4. 6.4.4. Europe Sales Force Automation (SFA) Market, by Application, 2016 – 2026
        1. 6.4.4.1. Europe Sales Force Automation (SFA) Market, by Application, 2016 – 2026 (USD Billion)
      5. 6.4.5. Europe Sales Force Automation (SFA) Market, by Industry Verticals, 2016 – 2026
        1. 6.4.5.1. Europe Sales Force Automation (SFA) Market, by Industry Verticals, 2016 – 2026 (USD Billion)
      6. 6.4.6. Germany
        1. 6.4.6.1. Germany Sales Force Automation (SFA) Market, 2016 – 2026 (USD Billion)
      7. 6.4.7. France
        1. 6.4.7.1. France Sales Force Automation (SFA) Market, 2016 – 2026 (USD Billion)
      8. 6.4.8. U.K.
        1. 6.4.8.1. U.K. Sales Force Automation (SFA) Market, 2016 – 2026 (USD Billion)
      9. 6.4.9. Italy
        1. 6.4.9.1. Italy Sales Force Automation (SFA) Market, 2016 – 2026 (USD Billion)
      10. 6.4.10. Spain
        1. 6.4.10.1. Spain Sales Force Automation (SFA) Market, 2016 – 2026 (USD Billion)
      11. 6.4.11. Rest of Europe
        1. 6.4.11.1. Rest of Europe Sales Force Automation (SFA) Market, 2016 – 2026 (USD Billion)
    5. 6.5. Asia Pacific
      1. 6.5.1. Asia Pacific Sales Force Automation (SFA) Market, 2016 – 2026 (USD Billion)
        1. 6.5.1.1. Asia Pacific Sales Force Automation (SFA) Market, by Country, 2016 - 2026 (USD Billion)
      2. 6.5.2. Asia Pacific Sales Force Automation (SFA) Market, by Deployment Mode, 2016 – 2026
        1. 6.5.2.1. Asia Pacific Sales Force Automation (SFA) Market, by Deployment Mode, 2016 – 2026 (USD Billion)
      3. 6.5.3. Asia Pacific Sales Force Automation (SFA) Market, by Enterprise Size, 2016 – 2026
        1. 6.5.3.1. Asia Pacific Sales Force Automation (SFA) Market, by Enterprise Size, 2016 – 2026 (USD Billion)
      4. 6.5.4. Asia Pacific Sales Force Automation (SFA) Market, by Application, 2016 – 2026
        1. 6.5.4.1. Asia Pacific Sales Force Automation (SFA) Market, by Application, 2016 – 2026 (USD Billion)
      5. 6.5.5. Asia Pacific Sales Force Automation (SFA) Market, by Industry Verticals, 2016 – 2026
        1. 6.5.5.1. Asia Pacific Sales Force Automation (SFA) Market, by Industry Verticals, 2016 – 2026 (USD Billion)
      6. 6.5.6. China
        1. 6.5.6.1. China Sales Force Automation (SFA) Market, 2016 – 2026 (USD Billion)
      7. 6.5.7. Japan
        1. 6.5.7.1. Japan Sales Force Automation (SFA) Market, 2016 – 2026 (USD Billion)
      8. 6.5.8. India
        1. 6.5.8.1. India Sales Force Automation (SFA) Market, 2016 – 2026 (USD Billion)
      9. 6.5.9. South Korea
        1. 6.5.9.1. South Korea Sales Force Automation (SFA) Market, 2016 – 2026 (USD Billion)
      10. 6.5.10. South-East Asia
        1. 6.5.10.1. South-East Asia Sales Force Automation (SFA) Market, 2016 – 2026 (USD Billion)
      11. 6.5.11. Rest of Asia Pacific
        1. 6.5.11.1. Rest of Asia Pacific Sales Force Automation (SFA) Market, 2016 – 2026 (USD Billion)
    6. 6.6. Latin America
      1. 6.6.1. Latin America Sales Force Automation (SFA) Market, 2016 – 2026 (USD Billion)
        1. 6.6.1.1. Latin America Sales Force Automation (SFA) Market, by Country, 2016 - 2026 (USD Billion)
      2. 6.6.2. Latin America Sales Force Automation (SFA) Market, by Deployment Mode, 2016 – 2026
        1. 6.6.2.1. Latin America Sales Force Automation (SFA) Market, by Deployment Mode, 2016 – 2026 (USD Billion)
      3. 6.6.3. Latin America Sales Force Automation (SFA) Market, by Enterprise Size, 2016 – 2026
        1. 6.6.3.1. Latin America Sales Force Automation (SFA) Market, by Enterprise Size, 2016 – 2026 (USD Billion)
      4. 6.6.4. Latin America Sales Force Automation (SFA) Market, by Application, 2016 – 2026
        1. 6.6.4.1. Latin America Sales Force Automation (SFA) Market, by Application, 2016 – 2026 (USD Billion)
      5. 6.6.5. Latin America Sales Force Automation (SFA) Market, by Industry Verticals, 2016 – 2026
        1. 6.6.5.1. Latin America Sales Force Automation (SFA) Market, by Industry Verticals, 2016 – 2026 (USD Billion)
      6. 6.6.6. Brazil
        1. 6.6.6.1. Brazil Sales Force Automation (SFA) Market, 2016 – 2026 (USD Billion)
      7. 6.6.7. Mexico
        1. 6.6.7.1. Mexico Sales Force Automation (SFA) Market, 2016 – 2026 (USD Billion)
      8. 6.6.8. Rest of Latin America
        1. 6.6.8.1. Rest of Latin America Sales Force Automation (SFA) Market, 2016 – 2026 (USD Billion)
    7. 6.7. The Middle-East and Africa
      1. 6.7.1. The Middle-East and Africa Sales Force Automation (SFA) Market, 2016 – 2026 (USD Billion)
        1. 6.7.1.1. The Middle-East and Africa Sales Force Automation (SFA) Market, by Country, 2016 - 2026 (USD Billion)
      2. 6.7.2. The Middle-East and Africa Sales Force Automation (SFA) Market, by Deployment Mode, 2016 – 2026
        1. 6.7.2.1. The Middle-East and Africa Sales Force Automation (SFA) Market, by Deployment Mode, 2016 – 2026 (USD Billion)
      3. 6.7.3. The Middle-East and Africa Sales Force Automation (SFA) Market, by Enterprise Size, 2016 – 2026
        1. 6.7.3.1. The Middle-East and Africa Sales Force Automation (SFA) Market, by Enterprise Size, 2016 – 2026 (USD Billion)
      4. 6.7.4. The Middle-East and Africa Sales Force Automation (SFA) Market, by Application, 2016 – 2026
        1. 6.7.4.1. The Middle-East and Africa Sales Force Automation (SFA) Market, by Application, 2016 – 2026 (USD Billion)
      5. 6.7.5. The Middle-East and Africa Sales Force Automation (SFA) Market, by Industry Verticals, 2016 – 2026
        1. 6.7.5.1. The Middle-East and Africa Sales Force Automation (SFA) Market, by Industry Verticals, 2016 – 2026 (USD Billion)
      6. 6.7.6. GCC Countries
        1. 6.7.6.1. GCC Countries Sales Force Automation (SFA) Market, 2016 – 2026 (USD Billion)
      7. 6.7.7. South Africa
        1. 6.7.7.1. South Africa Sales Force Automation (SFA) Market, 2016 – 2026 (USD Billion)
      8. 6.7.8. Rest of Middle-East Africa
        1. 6.7.8.1. Rest of Middle-East Africa Sales Force Automation (SFA) Market, 2016 – 2026 (USD Billion)
  7. Chapter 7 Sales Force Automation (SFA) Market – Competitive Landscape
    1. 7.1. Competitor Market Share – Revenue
    2. 7.2. Market Concentration Rate Analysis, Top 3 and Top 5 Players
    3. 7.3. Strategic Developments
      1. 7.3.1. Acquisitions and Mergers
      2. 7.3.2. New Products
      3. 7.3.3. Research & Development Activities
  8. Chapter 8 Company Profiles
    1. 8.1. Salesforce.com Inc
      1. 8.1.1. Company Overview
      2. 8.1.2. Product/Service Portfolio
        1. 8.1.3. Salesforce.com Inc Sales, Revenue, and Gross Margin
        2. 8.1.4. Salesforce.com Inc Revenue and Growth Rate
        3. 8.1.5. Salesforce.com Inc Market Share
      3. 8.1.6. Recent Initiatives, Funding/VC Activities, and Technological Innovations
    2. 8.2. Microsoft Corporation
      1. 8.2.1. Company Overview
      2. 8.2.2. Product/Service Portfolio
      3. 8.2.3. Microsoft Corporation Sales, Revenue, and Gross Margin
      4. 8.2.4. Microsoft Corporation Revenue and Growth Rate
      5. 8.2.5. Microsoft Corporation Market Share
      6. 8.2.6. Recent Initiatives, Funding/VC Activities, and Technological Innovations
    3. 8.3. SAP SE
      1. 8.3.1. Company Overview
      2. 8.3.2. Product/Service Portfolio
      3. 8.3.3. SAP SE Sales, Revenue, and Gross Margin
      4. 8.3.4. SAP SE Revenue and Growth Rate
      5. 8.3.5. SAP SE Market Share
      6. 8.3.6. Recent Initiatives, Funding/VC Activities, and Technological Innovations
    4. 8.4. Oracle Corporation
      1. 8.4.1. Company Overview
      2. 8.4.2. Product/Service Portfolio
      3. 8.4.3. Oracle Corporation Sales, Revenue, and Gross Margin
      4. 8.4.4. Oracle Corporation Revenue and Growth Rate
      5. 8.4.5. Oracle Corporation Market Share
      6. 8.4.6. Recent Initiatives, Funding/VC Activities, and Technological Innovations
    5. 8.5. Bpm’online
      1. 8.5.1. Company Overview
      2. 8.5.2. Product/Service Portfolio
      3. 8.5.3. Bpm’online Sales, Revenue, and Gross Margin
      4. 8.5.4. Bpm’online Revenue and Growth Rate
      5. 8.5.5. Bpm’online Market Share
      6. 8.5.6. Recent Initiatives, Funding/VC Activities, and Technological Innovations
    6. 8.6. Apteam Inc
      1. 8.6.1. Company Overview
      2. 8.6.2. Product/Service Portfolio
      3. 8.6.3. Apteam Inc Sales, Revenue, and Gross Margin
      4. 8.6.4. Apteam Inc Revenue and Growth Rate
      5. 8.6.5. Apteam Inc Market Share
      6. 8.6.6. Recent Initiatives, Funding/VC Activities, and Technological Innovations
    7. 8.7. Zoho Corporation
      1. 8.7.1. Company Overview
      2. 8.7.2. Product/Service Portfolio
      3. 8.7.3. Zoho Corporation Sales, Revenue, and Gross Margin
      4. 8.7.4. Zoho Corporation Revenue and Growth Rate
      5. 8.7.5. Zoho Corporation Market Share
      6. 8.7.6. Recent Initiatives, Funding/VC Activities, and Technological Innovations
    8. 8.8. INFOR Inc
      1. 8.8.1. Company Overview
      2. 8.8.2. Product/Service Portfolio
      3. 8.8.3. INFOR Inc Sales, Revenue, and Gross Margin
      4. 8.8.4. INFOR Inc Revenue and Growth Rate
      5. 8.8.5. INFOR Inc Market Share
      6. 8.8.6. Recent Initiatives, Funding/VC Activities, and Technological Innovations
    9. 8.9. CRMNEXT
      1. 8.9.1. Company Overview
      2. 8.9.2. Product/Service Portfolio
      3. 8.9.3. CRMNEXT Sales, Revenue, and Gross Margin
      4. 8.9.4. CRMNEXT Revenue and Growth Rate
      5. 8.9.5. CRMNEXT Market Share
      6. 8.9.6. Recent Initiatives, Funding/VC Activities, and Technological Innovations
    10. 8.10. SugarCRM
      1. 8.10.1. Company Overview
      2. 8.10.2. Product/Service Portfolio
      3. 8.10.3. SugarCRM Sales, Revenue, and Gross Margin
      4. 8.10.4. SugarCRM Revenue and Growth Rate
      5. 8.10.5. SugarCRM Market Share
      6. 8.10.6. Recent Initiatives, Funding/VC Activities, and Technological Innovations
    11. 8.11. Pegasystems
      1. 8.11.1. Company Overview
      2. 8.11.2. Product/Service Portfolio
      3. 8.11.3. Pegasystems Sales, Revenue, and Gross Margin
      4. 8.11.4. Pegasystems Revenue and Growth Rate
      5. 8.11.5. Pegasystems Market Share
      6. 8.11.6. Recent Initiatives, Funding/VC Activities, and Technological Innovations
    12. 8.12. Infusionsoft
      1. 8.12.1. Company Overview
      2. 8.12.2. Product/Service Portfolio
      3. 8.12.3. Infusionsoft Sales, Revenue, and Gross Margin
      4. 8.12.4. Infusionsoft Revenue and Growth Rate
      5. 8.12.5. Infusionsoft Market Share
      6. 8.12.6. Recent Initiatives, Funding/VC Activities, and Technological Innovations
  9. Chapter 9 Sales Force Automation (SFA) — Industry Analysis
    1. 9.1. Introduction and Taxonomy
    2. 9.2. Sales Force Automation (SFA) Market – Key Trends
      1. 9.2.1. Market Drivers
      2. 9.2.2. Market Restraints
      3. 9.2.3. Market Opportunities
    3. 9.3. Value Chain Analysis
    4. 9.4. Key Mandates and Regulations
    5. 9.5. Technology Roadmap and Timeline
    6. 9.6. Sales Force Automation (SFA) Market – Attractiveness Analysis
      1. 9.6.1. By Deployment Mode
      2. 9.6.2. By Enterprise Size
      3. 9.6.3. By Application
      4. 9.6.4. By Industry Verticals
      5. 9.6.5. By Region
  10. Chapter 10 Industrial Chain, Sourcing Strategy, and Downstream Buyers
    1. 10.1. Sales Force Automation (SFA) Industrial Chain Analysis
    2. 10.2. Downstream Buyers
    3. 10.3. Distributors/Traders List
  11. Chapter 11 Marketing Strategy Analysis
    1. 11.1. Marketing Channel
    2. 11.2. Direct Marketing
    3. 11.3. Indirect Marketing
    4. 11.4. Marketing Channel Development Trends
    5. 11.5. Economic/Political Environmental Change
  12. Chapter 12 Report Conclusion & Key Insights
    1. 12.1. Key Insights from Primary Interviews & Surveys Respondents
    2. 12.2. Key Takeaways from Analysts, Consultants, and Industry Leaders
  13. Chapter 13 Research Approach & Methodology
    1. 13.1. Report Description
    2. 13.2. Research Scope
    3. 13.3. Research Methodology
      1. 13.3.1. Secondary Research
      2. 13.3.2. Primary Research
      3. 13.3.3. Statistical Models
        1. 13.3.3.1. Company Share Analysis Model
        2. 13.3.3.2. Revenue Based Modeling
      4. 13.3.4. Research Limitations

      List of Figures

      Fig.1	Product Picture of Sales Force Automation (SFA)
      Fig.2	Global Sales Force Automation (SFA) Market, 2016 – 2026 (USD Billion)
      Fig.3	Global Sales Force Automation (SFA) Market Absolute Revenue Opportunity, 2016 – 2026 (USD Billion)
      Fig.4	Global Sales Force Automation (SFA) Market Incremental Revenue Opportunity, 2020 – 2026 (USD Billion)
      Fig.5	Global Sales Force Automation (SFA) Market Share, by Deployment Mode, 2019 & 2026 (USD Billion)
      Fig.6	Global Cloud Based  Sales Force Automation (SFA) Market, 2016 – 2026 (USD Billion)
      Fig.7	Global On-Premises Sales Force Automation (SFA) Market, 2016 – 2026 (USD Billion)
      Fig.8	Global Sales Force Automation (SFA) Market Share, by Enterprise Size, 2019 & 2026 (USD Billion)
      Fig.9	Global Large Enterprises  Sales Force Automation (SFA) Market, 2016 – 2026 (USD Billion)
      Fig.10	Global SMEs Sales Force Automation (SFA) Market, 2016 – 2026 (USD Billion)
      Fig.11	Global Sales Force Automation (SFA) Market Share, by Application, 2019 & 2026 (USD Billion)
      Fig.12	Global Lead Management Sales Force Automation (SFA) Market, 2016 – 2026 (USD Billion)
      Fig.13	Global Sales Forecasting  Sales Force Automation (SFA) Market, 2016 – 2026 (USD Billion)
      Fig.14	Global Order & Invoices Management Sales Force Automation (SFA) Market, 2016 – 2026 (USD Billion)
      Fig.15	Global Opportunity Management  Sales Force Automation (SFA) Market, 2016 – 2026 (USD Billion)
      Fig.16	Global Others Sales Force Automation (SFA) Market, 2016 – 2026 (USD Billion)
      Fig.17	Global Sales Force Automation (SFA) Market Share, by Industry Verticals, 2019 & 2026 (USD Billion)
      Fig.18	Global BSFI  Sales Force Automation (SFA) Market, 2016 – 2026 (USD Billion)
      Fig.19	Global Retail  Sales Force Automation (SFA) Market, 2016 – 2026 (USD Billion)
      Fig.20	Global Healthcare Sales Force Automation (SFA) Market, 2016 – 2026 (USD Billion)
      Fig.21	Global IT & Telecom Sales Force Automation (SFA) Market, 2016 – 2026 (USD Billion)
      Fig.22	Global Manufacturing  Sales Force Automation (SFA) Market, 2016 – 2026 (USD Billion)
      Fig.23	Global Others Sales Force Automation (SFA) Market, 2016 – 2026 (USD Billion)
      Fig.24	Global Sales Force Automation (SFA) Market Share, by Region, 2019 & 2026 (USD Billion)
      Fig.25	North America Sales Force Automation (SFA) Market, 2016 – 2026 (USD Billion)
      Fig.26	U.S. Sales Force Automation (SFA) Market, 2016 – 2026 (USD Billion)
      Fig.27	Canada Sales Force Automation (SFA) Market, 2016 – 2026 (USD Billion)
      Fig.28	Europe Sales Force Automation (SFA) Market, 2016 – 2026 (USD Billion)
      Fig.29	Germany Sales Force Automation (SFA) Market, 2016 – 2026 (USD Billion)
      Fig.30	France Sales Force Automation (SFA) Market, 2016 – 2026 (USD Billion)
      Fig.31	U.K. Sales Force Automation (SFA) Market, 2016 – 2026 (USD Billion)
      Fig.32	Italy Sales Force Automation (SFA) Market, 2016 – 2026 (USD Billion)
      Fig.33	Spain Sales Force Automation (SFA) Market, 2016 – 2026 (USD Billion)
      Fig.34	Rest of Europe Sales Force Automation (SFA) Market, 2016 – 2026 (USD Billion)
      Fig.35	Asia Pacific Sales Force Automation (SFA) Market, 2016 – 2026 (USD Billion)
      Fig.36	China Sales Force Automation (SFA) Market, 2016 – 2026 (USD Billion)
      Fig.37	Japan Sales Force Automation (SFA) Market, 2016 – 2026 (USD Billion)
      Fig.38	India Sales Force Automation (SFA) Market, 2016 – 2026 (USD Billion)
      Fig.39	South  Korea Sales Force Automation (SFA) Market, 2016 – 2026 (USD Billion)
      Fig.40	South-East Asia Sales Force Automation (SFA) Market, 2016 – 2026 (USD Billion)
      Fig.41	Rest of Asia Pacific Sales Force Automation (SFA) Market, 2016 – 2026 (USD Billion)
      Fig.42	Latin America Sales Force Automation (SFA) Market, 2016 – 2026 (USD Billion)
      Fig.43	Brazil Sales Force Automation (SFA) Market, 2016 – 2026 (USD Billion)
      Fig.44	Mexico Sales Force Automation (SFA) Market, 2016 – 2026 (USD Billion)
      Fig.45	Rest of Latin America Sales Force Automation (SFA) Market, 2016 – 2026 (USD Billion)
      Fig.46	The Middle-East and Africa Sales Force Automation (SFA) Market, 2016 – 2026 (USD Billion)
      Fig.47	GCC Countries Sales Force Automation (SFA) Market, 2016 – 2026 (USD Billion)
      Fig.48	South Africa Sales Force Automation (SFA) Market, 2016 – 2026 (USD Billion)
      Fig.49	Rest of Middle-East Africa Sales Force Automation (SFA) Market, 2016 – 2026 (USD Billion)
      Fig.50	Competitor Market Share – Revenue
      Fig.51	Salesforce.com Inc Revenue and Growth Rate
      Fig.52	Salesforce.com Inc Market Share
      Fig.53	Microsoft Corporation Revenue and Growth Rate
      Fig.54	Microsoft Corporation Market Share
      Fig.55	SAP SE Revenue and Growth Rate
      Fig.56	SAP SE Market Share
      Fig.57	Oracle Corporation Revenue and Growth Rate
      Fig.58	Oracle Corporation Market Share
      Fig.59	Bpm’online Revenue and Growth Rate
      Fig.60	Bpm’online Market Share
      Fig.61	Apteam Inc Revenue and Growth Rate
      Fig.62	Apteam Inc Market Share
      Fig.63	Zoho Corporation Revenue and Growth Rate
      Fig.64	Zoho Corporation Market Share
      Fig.65	INFOR Inc Revenue and Growth Rate
      Fig.66	INFOR Inc Market Share
      Fig.67	CRMNEXT Revenue and Growth Rate
      Fig.68	CRMNEXT Market Share
      Fig.69	SugarCRM Revenue and Growth Rate
      Fig.70	SugarCRM Market Share
      Fig.71	Pegasystems Revenue and Growth Rate
      Fig.72	Pegasystems Market Share
      Fig.73	Infusionsoft Revenue and Growth Rate
      Fig.74	Infusionsoft Market Share
      Fig.75	Market Dynamics
      Fig.76	Global Sales Force Automation (SFA) – Value Chain Analysis
      Fig.77	Key Mandates and Regulations
      Fig.78	Technology Roadmap and Timeline
      Fig.79	Market Attractiveness Analysis – By Deployment Mode
      Fig.80	Market Attractiveness Analysis – By Enterprise Size
      Fig.81	Market Attractiveness Analysis – By Application
      Fig.82	Market Attractiveness Analysis – By Industry Verticals
      Fig.83	Market Attractiveness Analysis – By Region
      Fig.84	Sales Force Automation (SFA) Industrial Chain Analysis
      Fig.85	Market Channels
      Fig.86	Marketing Channel Development Trend
      Fig.87	Growth in World Gross Product, 2008-2018
      

      List of Tables

      Table 1	Global Sales Force Automation (SFA) Market, 2019 & 2026 (USD Billion)
      Table 2	Global Sales Force Automation (SFA) Market, by Deployment Mode, 2016 – 2026 (USD Billion)
      Table 3	Global Sales Force Automation (SFA) Market, by Enterprise Size, 2016 – 2026 (USD Billion)
      Table 4	Global Sales Force Automation (SFA) Market, by Application, 2016 – 2026 (USD Billion)
      Table 5	Global Sales Force Automation (SFA) Market, by Industry Verticals, 2016 – 2026 (USD Billion)
      Table 6	Global Sales Force Automation (SFA) Market, by Region, 2016 – 2026 (USD Billion)
      Table 7	North America Sales Force Automation (SFA) Market, by Country, 2016 – 2026 (USD Billion)
      Table 8	North America Sales Force Automation (SFA) Market, by Deployment Mode, 2016 – 2026 (USD Billion)
      Table 9	North America Sales Force Automation (SFA) Market, by Enterprise Size, 2016 – 2026 (USD Billion)
      Table 10 North America Sales Force Automation (SFA) Market, by Application, 2016 – 2026 (USD Billion)
      Table 11 North America Sales Force Automation (SFA) Market, by Industry Verticals, 2016 – 2026 (USD Billion)
      Table 12 Europe Sales Force Automation (SFA) Market, by Country, 2016 – 2026 (USD Billion)
      Table 13 Europe Sales Force Automation (SFA) Market, by Deployment Mode, 2016 – 2026 (USD Billion)
      Table 14 Europe Sales Force Automation (SFA) Market, by Enterprise Size, 2016 – 2026 (USD Billion)
      Table 15 Europe Sales Force Automation (SFA) Market, by Application, 2016 – 2026 (USD Billion)
      Table 16 Europe Sales Force Automation (SFA) Market, by Industry Verticals, 2016 – 2026 (USD Billion)
      Table 17 Asia Pacific Sales Force Automation (SFA) Market, by Country, 2016 – 2026 (USD Billion)
      Table 18 Asia Pacific Sales Force Automation (SFA) Market, by Deployment Mode, 2016 – 2026 (USD Billion)
      Table 19 Asia Pacific Sales Force Automation (SFA) Market, by Enterprise Size, 2016 – 2026 (USD Billion)
      Table 20 Asia Pacific Sales Force Automation (SFA) Market, by Application, 2016 – 2026 (USD Billion)
      Table 21 Asia Pacific Sales Force Automation (SFA) Market, by Industry Verticals, 2016 – 2026 (USD Billion)
      Table 22 Latin America Sales Force Automation (SFA) Market, by Country, 2016 – 2026 (USD Billion)
      Table 23 Latin America Sales Force Automation (SFA) Market, by Deployment Mode, 2016 – 2026 (USD Billion)
      Table 24 Latin America Sales Force Automation (SFA) Market, by Enterprise Size, 2016 – 2026 (USD Billion)
      Table 25 Latin America Sales Force Automation (SFA) Market, by Application, 2016 – 2026 (USD Billion)
      Table 26 Latin America Sales Force Automation (SFA) Market, by Industry Verticals, 2016 – 2026 (USD Billion)
      Table 27 The Middle-East and Africa Sales Force Automation (SFA) Market, by Country, 2016 – 2026 (USD Billion)
      Table 28 The Middle-East and Africa Sales Force Automation (SFA) Market, by Deployment Mode, 2016 – 2026 (USD Billion)
      Table 29 The Middle-East and Africa Sales Force Automation (SFA) Market, by Enterprise Size, 2016 – 2026 (USD Billion)
      Table 30 The Middle-East and Africa Sales Force Automation (SFA) Market, by Application, 2016 – 2026 (USD Billion)
      Table 31 The Middle-East and Africa Sales Force Automation (SFA) Market, by Industry Verticals, 2016 – 2026 (USD Billion)
      Table 32 Global Sales Force Automation (SFA) Market - Company Revenue Analysis, 2016 – 2019 (USD Billion)
      Table 33 Global Sales Force Automation (SFA) Market - Company Revenue Share Analysis, 2016 – 2019 (%)
      Table 34 Acquisitions and Mergers
      Table 35 Market Drivers – Impact Analysis
      Table 36 Market Restraints
      Table 37 Market Opportunities
      Table 38 Major Buyers of Sales Force Automation (SFA)
      Table 39 Distributors/Traders of Sales Force Automation (SFA) by Region
      

Industry Major Market Players

  • Salesforce.com Inc.
  • Microsoft Corporation
  • SAP SE
  • Oracle Corporation
  • Bpm’online
  • Apteam Inc.
  • Zoho Corporation
  • INFOR Inc.
  • CRMNEXT
  • SugarCRM
  • Pegasystems
  • Infusionsoft