Search Market Research Report

Discover Our Latest Reports
Discover Our Featured Reports
Discover Top Selling Reports

Rich Communication Services Market Size, Share Global Analysis Report, 2020–2026

report img

Rich Communication Services Market By Services (Content Sharing, IP Video Call Chat, VOIP, and File Transfer), By Deployment Type (On-premise, Cloud), by End User (Enterprise and Consumer): Global Industry Outlook, Market Size, Business Intelligence, Consumer Preferences, Statistical Surveys, Comprehensive Analysis, Historical Developments, Current Trends, and Forecast 2020–2026

Industry Insights

The rich communication services market report analyzes and notifies the industry statistics at the global as well as regional and country levels in order to acquire a thorough perspective of the entire rich communication services market. The historical and past insights are provided for FY 2016 to FY 2019 whereas projected trends are delivered for FY 2020 to FY 2026. The quantitative and numerical data is represented in terms of both volume (Units) and value (USD Million) from FY 2016 – 2026.

This technical and expertise-oriented industry research report scrutinizes the technical and commercial business outlook of the rich communication services industry. The report analyzes and declares the historical and current trends analysis of the rich communication services industry and subsequently recommends the projected trends anticipated to be observed in the rich communication services market during the upcoming years.

Rich Communication Services Market Size

To know more about this report | Request Free Sample Copy


logoKey Insights from Primary Research

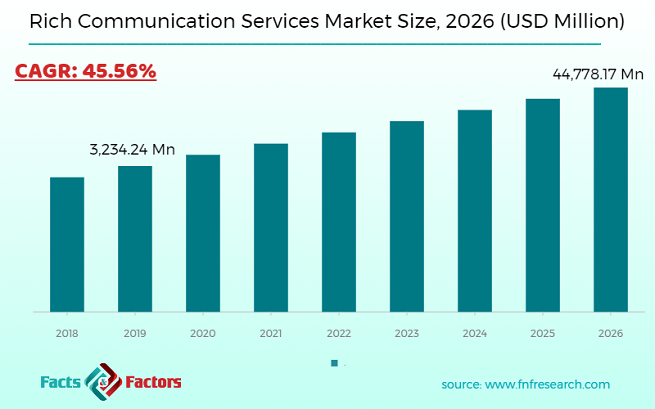
  • As per our primary analysis, the global rich communication services market is  expected to reach around USD 45, 500 million by 2026
  • The emergence of Artificial Intelligence and the Internet of Things is expected to shape the global rich communication service market in the coming years.
  • Expanding business through a partnership will be the key to sustain I the competition in the global rich communication services market
  • According to our respondent, Latin America is expected to have a potential market for rich communication services in the forecast period. Latin America’s top four largest operators as Customers of America Movil, Telephonic, Oi, and AT&T Mexico have launched Rich Communication services for their customers which covered about 60% of the region’s mobile subscribers. This is one of the key factors which are expected to drive the market in the Latin American region in the forecast period.

logoKey Recommendations from Analysts

  • As per our analysts, the rich communication services market revenue was around USD 3234 million in 2019.
  • Asia Pacific dominated the rich communication service market and is expected to continue its dominance during the forecast period. The region contributed nearly half of the total market share in 2019. The growth in this region is mainly driven by the higher adoption of RCS services and the presence of major as well as startup vendors in countries such as Japan, China, and India. Further, the high penetration of smartphones coupled with a large number of active social media users in this region is expected to drive the market for rich communication services significantly. Furthermore, the support from Google for the introduction of rich communication services for mobile network operators to provide rich media services directly to subscribers through native applications is expected to play a major role in the growth of the market in the coming years.
  • Based on content sharing and chat service segment is expected to grow at the highest CAGR from 2020 to 2026, owing to the rapidly rising growing proliferation of digital content through A2P messaging
  • AT&T, Google, Vodafone Group Plc. Huawei Device Co., Ltd. and Orange S.A. is among the major market participant in the global rich communication services marketplace.

The quantitative data is further underlined and reinforced by comprehensive qualitative data which comprises various across-the-board market dynamics. The rationales which directly or indirectly impact the rich communication services industry are exemplified through parameters such as growth drivers, restraints, challenges, and opportunities among other impacting factors.

Throughout our research report, we have encompassed all the proven models and tools of industry analysis and extensively illustrated all the key business strategies and business models adopted in the rich communication services industry. The report provides an all-inclusive and detailed competitive landscape prevalent in the rich communication services market.

The report utilizes established industry analysis tools and models such as Porter’s Five Forces framework to analyze and recognize critical business strategies adopted by various stakeholders involved in the entire value chain of the rich communication services industry. The rich communication services market report additionally employs SWOT analysis and PESTLE analysis models for further in-depth analysis.

The report study further includes an in-depth analysis of industry players' market shares and provides an overview of leading players' market position in the rich communication services sector. Key strategic developments in the rich communication services market competitive landscape such as acquisitions & mergers, inaugurations of different products and services, partnerships & joint ventures, MoU agreements, VC & funding activities, R&D activities, and geographic expansion among other noteworthy activities by key players of the rich communication services market are appropriately highlighted in the report.

The rapid increase in high-speed broadband services, the increasing trend of social media, and the focus on customer retention are some of the key factors responsible for the growth of the global rich communication service market. Further, a partnership between the carriers, global interoperability, and investments in Long Term Evaluation (LTE) and IP Multimedia Subsystem (IMS) are some other factors driving the global rich communication service market. The mobile network operator is investing and adopting rich communication services to generate revenue through the creation of apps and B2B services via accommodated solutions and from pay as you grow costs solutions. However, rising competition between (OTT) players that offer internet-based services are expected to hinder the growth of the global rich communication services market. Hence, cloud-based deployment services will provide a better opportunity for enterprise users and consumers.

The rich communication services market research report delivers an acute valuation and taxonomy of the rich communication services industry by practically splitting the market on the basis of different types, applications, and regions. Through the analysis of the historical and projected trends, all the segments and sub-segments were evaluated through the bottom-up approach, and different market sizes have been projected for FY 2020 to FY 2026. The regional segmentation of the rich communication services industry includes the complete classification of all the major continents including North America, Latin America, Europe, Asia Pacific, and the Middle East & Africa. Further, country-wise data for the rich communication services industry is provided for the leading economies of the world.

The global rich communication services market is segmented into services, deployment, end-user, and regions. Based on services, the global rich communication service market is bifurcated into content sharing, IP video call chat, VoIP, and file transfer. On-premise and cloud is the deployment segment of the global rich communication service market. Furthermore, on the basis of end-user, the market for rich communication services is divided into enterprise and consumer.

logoReport Scope

Report Attribute

Details

Market Size in 2019

USD 3234.24 Million

Projected Market Size in 2026

USD 44778.17 Million

CAGR Growth Rate

45.56% CAGR

Base Year

2019

Forecast Years

2020-2026

Key Market Players

Alcatel-Lucent S.A.., Interop Technologies, Ericsson, Nokia Networks, Genband Inc., Mavenir Systems, Vodafone Group Plc. Huawei Device Co., Ltd., Orange S.A., Xura Inc., SAP America Inc., SK Telecom, SAP Comverse, and Acision among others.

Key Segment

By Services, By Deployment, By End User, By Region

Major Regions Covered

North America, Europe, Asia Pacific, Latin America, and the Middle East & Africa

Purchase Options

Request customized purchase options to meet your research needs. Explore purchase options

The taxonomy of the rich communication services industry by its scope and segmentation is as follows:

logoThe key players contributing to the global rich communication services market are

  •  Alcatel-Lucent S.A..
  •  Interop Technologies
  •  Ericsson
  •  Nokia Networks
  •  Genband Inc.
  •  Mavenir Systems
  •  Vodafone group Plc. Huawei Device Co. Ltd.
  •  Orange S.A.
  •  Xura Inc.
  •  SAP America Inc.
  •  SK Telecom
  •  SAP Comverse
  •  Acision

logo Service Segment Analysis

  • Chat
  • Content Sharing
  • VoIP
  • IP Video Call
  • File Transfer

logo Deployment Segment Analysis

  • Cloud
  • On-premises

logo End-User Segment Analysis

  • Enterprise User
  • Consumer

logo Regional Segment Analysis

  • North America
    • The U.S.
    • Canada
  • Europe
    • Germany
    • The UK
    • France
    • Spain
    • Italy
    • Rest of Europe
  • Asia Pacific
    • China
    • Japan
    • India
    • South Korea
    • Southeast Asia
    • Rest of Asia Pacific
  • Latin America
    • Brazil
    • Mexico
    • Rest of Latin America
  • Middle East & Africa
    • GCC
    • South Africa
    • Rest of the Middle East & Africa

Table of Content

  1. CHAPTER 1. Executive Summary
  2. CHAPTER 2. Rich Communication Services market – Service Analysis
    1. 2.1. Global Rich Communication Services Market – Service Overview
    2. 2.2. Global Rich Communication Services Market Share, by Service, 2018 & 2025 (USD Million)
    3. 2.3. Chat
      1. 2.3.1. Global Chat Rich Communication Services Market, 2016-2026 (USD Million)
    4. 2.4. Content Sharing
      1. 2.4.1. Global Content Sharing Rich Communication Services Market, 2016-2026 (USD Million)
    5. 2.5. VoIP
      1. 2.5.1. Global VoIP Rich Communication Services Market, 2016-2026 (USD Million)
    6. 2.6. IP Video Call
      1. 2.6.1. Global IP Video Call Rich Communication Services Market, 2016-2026 (USD Million)
    7. 2.7. File Transfer
      1. 2.7.1. Global File Transfer Rich Communication Services Market, 2016-2026 (USD Million)
  3. CHAPTER 3. Rich Communication Services market – Deployment Analysis
    1. 3.1. Global Rich Communication Services Market – Deployment Overview
    2. 3.2. Global Rich Communication Services Market Share, by Deployment, 2018 & 2025 (USD Million)
    3. 3.3. Cloud
      1. 3.3.1. Global Cloud Rich Communication Services Market, 2016-2026 (USD Million)
    4. 3.4. On-premises
      1. 3.4.1. Global On-premises Rich Communication Services Market, 2016-2026 (USD Million)
  4. CHAPTER 4. Rich Communication Services market – End User Analysis
    1. 4.1. Global Rich Communication Services Market – End User Overview
    2. 4.2. Global Rich Communication Services Market Share, by End User, 2018 & 2025 (USD Million)
    3. 4.3. Enterprise
      1. 4.3.1. Global Enterprise Rich Communication Services Market, 2016-2026 (USD Million)
    4. 4.4. Consumer
      1. 4.4.1. Global Consumer Rich Communication Services Market, 2016-2026 (USD Million)
  5. CHAPTER 5. Rich Communication Services market – Regional Analysis
    1. 5.1. Global Rich Communication Services Market Regional Overview
    2. 5.2. Global Rich Communication Services Market Share, by Region, 2018 & 2025 (Value)
    3. 5.3. North America
      1. 5.3.1. North America Rich Communication Services Market size and forecast, 2016-2026
      2. 5.3.2. North America Rich Communication Services Market, by Country, 2018 & 2025 (USD Million)
      3. 5.3.3. North America Rich Communication Services Market, by Service, 2016-2026
        1. 5.3.3.1. North America Rich Communication Services Market, by Service, 2016-2026 (USD Million)
      4. 5.3.4. North America Rich Communication Services Market, by Deployment, 2016-2026
        1. 5.3.4.1. North America Rich Communication Services Market, by Deployment, 2016-2026 (USD Million)
      5. 5.3.5. North America Rich Communication Services Market, by End User, 2016-2026
        1. 5.3.5.1. North America Rich Communication Services Market, by End User, 2016-2026 (USD Million)
      6. 5.3.6. U.S.
        1. 5.3.6.1. U.S. Market size and forecast, 2016-2026 (USD Million)
      7. 5.3.7. Canada
        1. 5.3.7.1. Canada Market size and forecast, 2016-2026 (USD Million)
    4. 5.4. Europe
      1. 5.4.1. Europe Rich Communication Services Market size and forecast, 2016-2026
      2. 5.4.2. Europe Rich Communication Services Market, by Country, 2018 & 2025 (USD Million)
      3. 5.4.3. Europe Rich Communication Services Market, by Service, 2016-2026
        1. 5.4.3.1. Europe Rich Communication Services Market, by Service, 2016-2026 (USD Million)
      4. 5.4.4. Europe Rich Communication Services Market, by Deployment, 2016-2026
        1. 5.4.4.1. Europe Rich Communication Services Market, by Deployment, 2016-2026 (USD Million)
      5. 5.4.5. Europe Rich Communication Services Market, by End User, 2016-2026
        1. 5.4.5.1. Europe Rich Communication Services Market, by End User, 2016-2026 (USD Million)
      6. 5.4.6. Germany
        1. 5.4.6.1. Germany Market size and forecast, 2016-2026 (USD Million)
      7. 5.4.7. France
        1. 5.4.7.1. France Market size and forecast, 2016-2026 (USD Million)
      8. 5.4.8. U.K.
        1. 5.4.8.1. U.K. Market size and forecast, 2016-2026 (USD Million)
      9. 5.4.9. Italy
        1. 5.4.9.1. Italy Market size and forecast, 2016-2026 (USD Million)
      10. 5.4.10. Spain
        1. 5.4.10.1. Spain Market size and forecast, 2016-2026 (USD Million)
      11. 5.4.11. Rest of Europe
        1. 5.4.11.1. Rest of Europe Market size and forecast, 2016-2026 (USD Million)
    5. 5.5. Asia Pacific
      1. 5.5.1. Asia Pacific Rich Communication Services Market size and forecast, 2016-2026
      2. 5.5.2. Asia Pacific Rich Communication Services Market, by Country, 2018 & 2025 (USD Million)
      3. 5.5.3. Asia Pacific Rich Communication Services Market, by Service, 2016-2026
        1. 5.5.3.1. Asia Pacific Rich Communication Services Market, by Service, 2016-2026 (USD Million)
      4. 5.5.4. Asia Pacific Rich Communication Services Market, by Deployment, 2016-2026
        1. 5.5.4.1. Asia Pacific Rich Communication Services Market, by Deployment, 2016-2026 (USD Million)
      5. 5.5.5. Asia Pacific Rich Communication Services Market, by End User, 2016-2026
        1. 5.5.5.1. Asia Pacific Rich Communication Services Market, by End User, 2016-2026 (USD Million)
      6. 5.5.6. China
        1. 5.5.6.1. China Market size and forecast, 2016-2026 (USD Million)
      7. 5.5.7. Japan
        1. 5.5.7.1. Japan Market size and forecast, 2016-2026 (USD Million)
      8. 5.5.8. India
        1. 5.5.8.1. India Market size and forecast, 2016-2026 (USD Million)
      9. 5.5.9. South Korea
        1. 5.5.9.1. South Korea Market size and forecast, 2016-2026 (USD Million)
      10. 5.5.10. South-East Asia
        1. 5.5.10.1. South-East Asia Market size and forecast, 2016-2026 (USD Million)
      11. 5.5.11. Rest of Asia Pacific
        1. 5.5.11.1. Rest of Asia Pacific Market size and forecast, 2016-2026 (USD Million)
    6. 5.6. Latin America
      1. 5.6.1. Latin America Rich Communication Services Market size and forecast, 2016-2026
      2. 5.6.2. Latin America Rich Communication Services Market, by Country, 2018 & 2025 (USD Million)
      3. 5.6.3. Latin America Rich Communication Services Market, by Service, 2016-2026
        1. 5.6.3.1. Latin America Rich Communication Services Market, by Service, 2016-2026 (USD Million)
      4. 5.6.4. Latin America Rich Communication Services Market, by Deployment, 2016-2026
        1. 5.6.4.1. Latin America Rich Communication Services Market, by Deployment, 2016-2026 (USD Million)
      5. 5.6.5. Latin America Rich Communication Services Market, by End User, 2016-2026
        1. 5.6.5.1. Latin America Rich Communication Services Market, by End User, 2016-2026 (USD Million)
      6. 5.6.6. Brazil
        1. 5.6.6.1. Brazil Market size and forecast, 2016-2026 (USD Million)
      7. 5.6.7. Mexico
        1. 5.6.7.1. Mexico Market size and forecast, 2016-2026 (USD Million)
      8. 5.6.8. Rest of Latin America
        1. 5.6.8.1. Rest of Latin America Market size and forecast, 2016-2026 (USD Million)
    7. 5.7. The Middle-East and Africa
      1. 5.7.1. The Middle-East and Africa Rich Communication Services Market size and forecast, 2016-2026
      2. 5.7.2. The Middle-East and Africa Rich Communication Services Market, by Country, 2018 & 2025 (USD Million)
      3. 5.7.3. The Middle-East and Africa Rich Communication Services Market, by Service, 2016-2026
        1. 5.7.3.1. The Middle-East and Africa Rich Communication Services Market, by Service, 2016-2026 (USD Million)
      4. 5.7.4. The Middle-East and Africa Rich Communication Services Market, by Deployment, 2016-2026
        1. 5.7.4.1. The Middle-East and Africa Rich Communication Services Market, by Deployment, 2016-2026 (USD Million)
      5. 5.7.5. The Middle-East and Africa Rich Communication Services Market, by End User, 2016-2026
        1. 5.7.5.1. The Middle-East and Africa Rich Communication Services Market, by End User, 2016-2026 (USD Million)
      6. 5.7.6. GCC Countries
        1. 5.7.6.1. GCC Countries Market size and forecast, 2016-2026 (USD Million)
      7. 5.7.7. South Africa
        1. 5.7.7.1. South Africa Market size and forecast, 2016-2026 (USD Million)
      8. 5.7.8. Rest of Middle-East Africa
        1. 5.7.8.1. Rest of Middle-East Africa Market size and forecast, 2016-2026 (USD Million)
  6. CHAPTER 6. Rich Communication Services market – Competitive Landscape
    1. 6.1. Competitor Market Share – Revenue
    2. 6.2. Market Concentration Rate Analysis, Top 3 and Top 5 Players
    3. 6.3. Strategic Development
      1. 6.3.1. Acquisitions and Mergers
      2. 6.3.2. New Products
      3. 6.3.3. Research & Development Activities
  7. CHAPTER 7. Company Profiles
    1. 7.1. Alcatel-Lucent S.A.
      1. 7.1.1. Company Overview
      2. 7.1.2. Alcatel-Lucent S.A. Revenue and Gross Margin
      3. 7.1.3. Product portfolio
      4. 7.1.4. Recent initiatives
    2. 7.2. Interop Technologies
      1. 7.2.1. Company Overview
      2. 7.2.2. Interop Technologies Revenue and Gross Margin
      3. 7.2.3. Product portfolio
      4. 7.2.4. Recent initiatives
    3. 7.3. Ericsson
      1. 7.3.1. Company Overview
      2. 7.3.2. Ericsson Revenue and Gross Margin
      3. 7.3.3. Product portfolio
      4. 7.3.4. Recent initiatives
    4. 7.4. Nokia Networks
      1. 7.4.1. Company Overview
      2. 7.4.2. Nokia Networks Revenue and Gross Margin
      3. 7.4.3. Product portfolio
      4. 7.4.4. Recent initiatives
    5. 7.5. Genband Inc.
      1. 7.5.1. Company Overview
      2. 7.5.2. Genband Inc. Revenue and Gross Margin
      3. 7.5.3. Product portfolio
      4. 7.5.4. Recent initiatives
    6. 7.6. Mavenir Systems
      1. 7.6.1. Company Overview
      2. 7.6.2. Mavenir Systems Revenue and Gross Margin
      3. 7.6.3. Product portfolio
      4. 7.6.4. Recent initiatives
    7. 7.7. Vodafone group Plc.
      1. 7.7.1. Company Overview
      2. 7.7.2. Vodafone group Plc. Revenue and Gross Margin
      3. 7.7.3. Product portfolio
      4. 7.7.4. Recent initiatives
    8. 7.8. Huawei Device Co., Ltd.
      1. 7.8.1. Company Overview
      2. 7.8.2. Huawei Device Co., Ltd. Revenue and Gross Margin
      3. 7.8.3. Product portfolio
      4. 7.8.4. Recent initiatives
    9. 7.9. Orange S.A.
      1. 7.9.1. Company Overview
      2. 7.9.2. Orange S.A. Revenue and Gross Margin
      3. 7.9.3. Product portfolio
      4. 7.9.4. Recent initiatives
    10. 7.10. Xura Inc.
      1. 7.10.1. Company Overview
      2. 7.10.2. Xura Inc. Revenue and Gross Margin
      3. 7.10.3. Product portfolio
      4. 7.10.4. Recent initiatives
    11. 7.11. SAP America Inc.
      1. 7.11.1. Company Overview
      2. 7.11.2. SAP America Inc. Revenue and Gross Margin
      3. 7.11.3. Product portfolio
      4. 7.11.4. Recent initiatives
    12. 7.12. SK Telecom
      1. 7.12.1. Company Overview
      2. 7.12.2. SK Telecom Revenue and Gross Margin
      3. 7.12.3. Product portfolio
      4. 7.12.4. Recent initiatives
    13. 7.13. SAP Comverse
      1. 7.13.1. Company Overview
      2. 7.13.2. SAP Comverse Revenue and Gross Margin
      3. 7.13.3. Product portfolio
      4. 7.13.4. Recent initiatives
    14. 7.14. Acision
      1. 7.14.1. Company Overview
      2. 7.14.2. Acision Revenue and Gross Margin
      3. 7.14.3. Product portfolio
      4. 7.14.4. Recent initiatives
  8. CHAPTER 8. Rich Communication Services — Industry Analysis
    1. 8.1. Rich Communication Services Market – Key Trends
      1. 8.1.1. Market Drivers
      2. 8.1.2. Market Restraints
      3. 8.1.3. Market Opportunities
    2. 8.2. Value Chain Analysis
    3. 8.3. Technology Roadmap and Timeline
    4. 8.4. Rich Communication Services Market – Attractiveness Analysis
      1. 8.4.1. By Service
      2. 8.4.2. By Deployment
      3. 8.4.3. By End User
      4. 8.4.4. By Region
  9. CHAPTER 9. Marketing Strategy Analysis, Distributors
    1. 9.1. Marketing Channel
    2. 9.2. Direct Marketing
    3. 9.3. Indirect Marketing
    4. 9.4. Marketing Channel Development Trend
    5. 9.5. Economic/Political Environmental Change
  10. CHAPTER 10. Report Conclusion
  11. CHAPTER 11. Research Approach & Methodology
    1. 11.1. Report Description
    2. 11.2. Research Scope
    3. 11.3. Research Methodology
      1. 11.3.1. Secondary Research
      2. 11.3.2. Primary Research
      3. 11.3.3. Models
        1. 11.3.3.1. Company Share Analysis Model
        2. 11.3.3.2. Revenue Based Modeling
        3. 11.3.3.3. Research Limitations

        List of Figures

        FIG. 1 Global Rich Communication Services Market, 2016-2026 (USD Million)
        FIG. 2 Global Rich Communication Services Market Share, by Service, 2018 & 2025 (USD Million)
        FIG. 3 Global Chat Rich Communication Services Market, 2016-2026 (USD Million)
        FIG. 4 Global Content Sharing Rich Communication Services Market, 2016-2026 (USD Million)
        FIG. 5 Global VoIP Rich Communication Services Market, 2016-2026 (USD Million)
        FIG. 6 Global IP Video Call Rich Communication Services Market, 2016-2026 (USD Million)
        FIG. 7 Global File Transfer Rich Communication Services Market, 2016-2026 (USD Million)
        FIG. 8 Global Rich Communication Services Market Share, by Deployment, 2018 & 2025 (USD Million)
        FIG. 9 Global Cloud Rich Communication Services Market, 2016-2026 (USD Million)
        FIG. 10 Global On-premises Rich Communication Services Market, 2016-2026 (USD Million)
        FIG. 11 Global Rich Communication Services Market Share, by End User, 2018 & 2025 (USD Million)
        FIG. 12 Global Enterprise Rich Communication Services Market, 2016-2026 (USD Million)
        FIG. 13 Global Consumer Rich Communication Services Market, 2016-2026 (USD Million)
        FIG. 14 Global Rich Communication Services Market Share, by Region, 2018 & 2025
        FIG. 15 North America Rich Communication Services Market, 2016-2026
        FIG. 16 U.S. Rich Communication Services Market, 2016-2026
        FIG. 17 Canada Rich Communication Services Market, 2016-2026
        FIG. 18 Europe Rich Communication Services Market, 2016-2026
        FIG. 19 Germany Rich Communication Services Market, 2016-2026
        FIG. 20 France Rich Communication Services Market, 2016-2026
        FIG. 21 U.K. Rich Communication Services Market, 2016-2026
        FIG. 22 Italy Rich Communication Services Market, 2016-2026
        FIG. 23 Spain Rich Communication Services Market, 2016-2026
        FIG. 24 Rest of Europe Rich Communication Services Market, 2016-2026
        FIG. 25 Asia Pacific Rich Communication Services Market, 2016-2026
        FIG. 26 China Rich Communication Services Market, 2016-2026
        FIG. 27 Japan Rich Communication Services Market, 2016-2026
        FIG. 28 India Rich Communication Services Market, 2016-2026
        FIG. 29 South  Korea Rich Communication Services Market, 2016-2026
        FIG. 30 South-East Asia Rich Communication Services Market, 2016-2026
        FIG. 31 Rest of Asia Pacific Rich Communication Services Market, 2016-2026
        FIG. 32 Latin America Rich Communication Services Market, 2016-2026
        FIG. 33 Brazil Rich Communication Services Market, 2016-2026
        FIG. 34 Mexico Rich Communication Services Market, 2016-2026
        FIG. 35 Rest of Latin America Rich Communication Services Market, 2016-2026
        FIG. 36 The Middle-East and Africa Rich Communication Services Market, 2016-2026
        FIG. 37 GCC Countries Rich Communication Services Market, 2016-2026
        FIG. 38 South Africa Rich Communication Services Market, 2016-2026
        FIG. 39 Rest of Middle-East Africa Rich Communication Services Market, 2016-2026
        FIG. 40 Competitor Market Share – Revenue
        FIG. 41 Alcatel-Lucent S.A. Revenue and Growth Rate
        FIG. 42 Alcatel-Lucent S.A. Market Share
        FIG. 43 Interop Technologies Revenue and Growth Rate
        FIG. 44 Interop Technologies Market Share
        FIG. 45 Ericsson Revenue and Growth Rate
        FIG. 46 Ericsson Market Share
        FIG. 47 Nokia Networks Revenue and Growth Rate
        FIG. 48 Nokia Networks Market Share
        FIG. 49 Genband Inc. Revenue and Growth Rate
        FIG. 50 Genband Inc. Market Share
        FIG. 51 Mavenir Systems Revenue and Growth Rate
        FIG. 52 Mavenir Systems Market Share
        FIG. 53 Vodafone group Plc. Revenue and Growth Rate
        FIG. 54 Vodafone group Plc. Market Share
        FIG. 55 Huawei Device Co., Ltd. Revenue and Growth Rate
        FIG. 56 Huawei Device Co., Ltd. Market Share
        FIG. 57 Orange S.A. Revenue and Growth Rate
        FIG. 58 Orange S.A. Market Share
        FIG. 59 Xura Inc. Revenue and Growth Rate
        FIG. 60 Xura Inc. Market Share
        FIG. 61 SAP America Inc. Revenue and Growth Rate
        FIG. 62 SAP America Inc. Market Share
        FIG. 63 SK Telecom Revenue and Growth Rate
        FIG. 64 SK Telecom Market Share
        FIG. 65 SAP Comverse Revenue and Growth Rate
        FIG. 66 SAP Comverse Market Share
        FIG. 67 Acision Revenue and Growth Rate
        FIG. 68 Acision Market Share
        FIG. 69 Market Dynamics
        FIG. 70 Global Rich Communication Services – Value Chain Analysis
        FIG. 71 Technology Roadmap and Timeline
        FIG. 72 Market Attractiveness Analysis – By Service
        FIG. 73 Market Attractiveness Analysis – By Deployment
        FIG. 74 Market Attractiveness Analysis – By End User
        FIG. 75 Market Attractiveness Analysis – By Region
        FIG. 76 Market Channel
        FIG. 77 Marketing Channel Development Trend
        FIG. 78 Growth in World Gross Product, 2008-2018

        List of Tables

        TABLE 1 Global Rich Communication Services Market, 2018 & 2025 (USD Million)
        TABLE 2 Global Rich Communication Services market, by Service, 2016-2026 (USD Million)
        TABLE 3 Global Rich Communication Services market, by Deployment, 2016-2026 (USD Million)
        TABLE 4 Global Rich Communication Services market, by End User, 2016-2026 (USD Million)
        TABLE 5 Global Rich Communication Services market, by Region, 2016-2026 (USD Million)
        TABLE 6 North America Rich Communication Services Market, by Service, 2016-2026 (USD Million)
        TABLE 7 North America Rich Communication Services Market, by Deployment, 2016-2026 (USD Million)
        TABLE 8 North America Rich Communication Services Market, by End User, 2016-2026 (USD Million)
        TABLE 9 Europe Rich Communication Services Market, by Service, 2016-2026 (USD Million)
        TABLE 10 Europe Rich Communication Services Market, by Deployment, 2016-2026 (USD Million)
        TABLE 11 Europe Rich Communication Services Market, by End User, 2016-2026 (USD Million)
        TABLE 12 Asia Pacific Rich Communication Services Market, by Service, 2016-2026 (USD Million)
        TABLE 13 Asia Pacific Rich Communication Services Market, by Deployment, 2016-2026 (USD Million)
        TABLE 14 Asia Pacific Rich Communication Services Market, by End User, 2016-2026 (USD Million)
        TABLE 15 Latin America Rich Communication Services Market, by Service, 2016-2026 (USD Million)
        TABLE 16 Latin America Rich Communication Services Market, by Deployment, 2016-2026 (USD Million)
        TABLE 17 Latin America Rich Communication Services Market, by End User, 2016-2026 (USD Million)
        TABLE 18 The Middle-East and Africa Rich Communication Services Market, by Service, 2016-2026 (USD Million)
        TABLE 19 The Middle-East and Africa Rich Communication Services Market, by Deployment, 2016-2026 (USD Million)
        TABLE 20 The Middle-East and Africa Rich Communication Services Market, by End User, 2016-2026 (USD Million)
        TABLE 21 Global Rich Communication Services Market - Company Revenue Analysis 2016-2019 (USD Million)
        TABLE 22 Global Rich Communication Services Market - Company Revenue Share Analysis 2016-2019(%)
        TABLE 23 Acquisitions and Mergers
        TABLE 24 New Product/Service Launch
        TABLE 25 Research & Development Activities
        TABLE 26 Market Drivers
        TABLE 27 Market Restraints
        TABLE 28 Market Opportunities

Industry Major Market Players

  •  Alcatel-Lucent S.A..
  •  Interop Technologies
  •  Ericsson
  •  Nokia Networks
  •  Genband Inc.
  •  Mavenir Systems
  •  Vodafone group Plc. Huawei Device Co. Ltd.
  •  Orange S.A.
  •  Xura Inc.
  •  SAP America Inc.
  •  SK Telecom
  •  SAP Comverse
  •  Acision