![]()
Search Market Research Report
Renewable Energy Market Size, Share Global Analysis Report, 2024 – 2032

Renewable Energy Market Size, Share, Growth Analysis Report By Energy Source (Solar Energy, Wind Energy, Hydroelectric Power, Biomass Energy, and Geothermal Energy), By End-User (Residential, Commercial, Industrial, and Utility), And By Region - Global and Regional Industry Insights, Overview, Comprehensive Analysis, Trends, Statistical Research, Market Intelligence, Historical Data and Forecast 2024 – 2032
Industry Insights
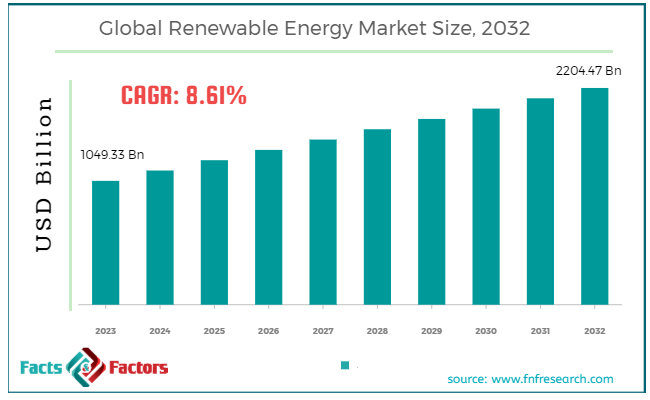
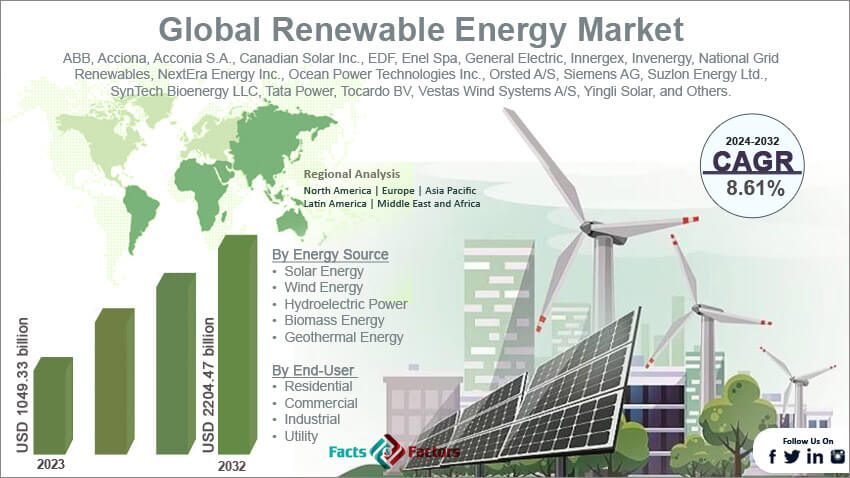
[224+ Pages Report] According to Facts & Factors, the global renewable energy market size in terms of revenue was valued at around USD 1049.33 billion in 2023 and is expected to reach a value of USD 2204.47 billion by 2032, growing at a CAGR of roughly 8.61% from 2024 to 2032. The global renewable energy market is projected to grow at a significant growth rate due to several driving factors.
 Market Overview
Renewable energy refers to energy derived from natural sources that replenish themselves over short periods of time and do not diminish. These sources include sunlight, wind, rain, tides, and geothermal heat. The main characteristics of renewable energy are that they are abundant and can be utilized without depleting them. The use of renewable energy technologies allows for the generation of electricity, provision of hot water or heat, and even cooling, all without contributing to climate change.
Renewable energy is seen as a crucial part of reducing greenhouse gas emissions and combatting global warming. Key types of renewable energy include solar energy, wind energy, hydroelectric power, and biomass.
Key Highlights
- The renewable energy market has registered a CAGR of 8.61% during the forecast period.
- In terms of revenue, the global renewable energy market was estimated at roughly USD 1049.33 billion in 2023 and is predicted to attain a value of USD 2204.47 billion by 2032.
- The growth of the renewable energy market is being propelled by several key factors such as environmental concerns, government policies and incentives, energy security and independence and technological advancements.
- On the basis of Energy Sources, the solar energy segment is currently the leader, boasting the highest market share of around 30.92% in 2023.
- Based on the End-User, the residential segment is growing at a high rate and is projected to dominate the global market with a CAGR of over 8.6%.
- By region, the Asia Pacific region currently holds the dominant position in the renewable energy market, boasting a market share exceeding 36.9% as of 2023.
Growth Drivers:
- Environmental Concerns: Growing awareness of climate change and the need for sustainable energy sources is a major driver for renewable energy adoption.
- Government Policies & Incentives: Many governments are offering subsidies, tax breaks, and feed-in tariffs to encourage investment in renewable energy projects.
- Technological Advancements: Continuous advancements in solar, wind, and other renewable technologies are making them more efficient, cost-effective, and reliable.
- Falling Costs: The cost of solar panels, wind turbines, and other renewable energy technologies has been steadily declining, making them more competitive with traditional fossil fuels.
Restraints:
- High Upfront Costs: Despite falling costs, setting up renewable energy infrastructure can still require significant upfront investments compared to traditional power plants.
- Energy Storage Limitations: Efficient and cost-effective energy storage solutions are crucial for some renewable energy sources like solar and wind to provide consistent power.
- Grid Integration Challenges: Integrating large-scale renewable energy generation into existing electricity grids can be complex and require grid modernization efforts.
- Intermittency of Some Sources: Solar and wind power generation can be variable depending on weather conditions, requiring backup power sources.
Opportunities:
- Decentralized Generation: Development of smaller-scale, distributed renewable energy solutions like rooftop solar panels creates new opportunities for consumers and businesses.
- Technological Innovation: Advancements in areas like energy storage, smart grids, and next-generation renewable technologies can further enhance market growth.
- Developing Economies: Rapidly developing countries present significant market opportunities for renewable energy adoption.
Challenges:
- Policy Uncertainty: Changes in government policies or a lack of long-term renewable energy commitments can create uncertainty for investors.
- Public Perception: Misconceptions about the viability or aesthetics of renewable energy projects can sometimes hinder public acceptance.
- Social Impacts: Careful planning is needed to address potential social impacts of renewable energy projects, such as land use changes or impacts on wildlife.
Renewable Energy Market: Segmentation Analysis
The global renewable energy market is segmented based on energy sources and end-users.
By Energy Source Segmentation Analysis
Based on Energy Source, the global renewable energy market is bifurcated into solar energy, wind energy, hydroelectric power, biomass energy, and geothermal energy. Solar energy utilizes photovoltaic cells to convert sunlight into electricity. Solar power is one of the most popular forms of renewable energy due to its scalability from small residential systems to large solar farms. The solar energy segment is currently the leader boasting the highest market share (around 30.92% in 2023) and a remarkable CAGR exceeding 13.7%. It is expected to have a high CAGR due to decreasing panel costs and improving efficiencies which make it accessible and economically viable for a broader market.
Wind energy captures kinetic energy from the wind and converts it into electricity using wind turbines. Wind power is a well-established technology with a substantial market share and a CAGR exceeding 8.4%. This segment includes both onshore and offshore wind farms. Wind energy, especially offshore, is projected to grow significantly, driven by large investments and advancements in turbine technology.
Hydroelectric power generates power by using water flow to drive turbines. It is one of the oldest and most reliable sources of renewable energy. This mature technology holds a significant market share (around 16.9% in 2023) with a steady CAGR of approximately 6.8%. While mature and slower-growing, hydroelectric power continues to expand, especially in developing countries with untapped river resources.
Biomass energy converts organic materials such as plant waste and manure into energy. Includes biofuels like ethanol and biodiesel that are used particularly in the transportation sector. Biomass energy is growing steadily as technologies improve and waste-reduction policies favor its use. Geothermal energy produces electricity and heat by harnessing thermal energy stored beneath the earth’s surface. Geothermal has a moderate growth rate, limited by geographical conditions but encouraged by its reliability and potential for base-load power generation.
By End-User Segmentation Analysis
Based on End-User, the global renewable energy market is categorized into residential, commercial, industrial, and utility. The residential segment includes small-scale installations of solar panels, solar water heaters, and biomass systems for individual homes. This segment is currently leading the market, with a projected CAGR of over 8.6%. The residential sector shows significant growth potential as renewable technology becomes more consumer-friendly. The commercial segment involves renewable installations in commercial buildings, ranging from solar rooftops to commercial biomass heating solutions. This sector is rapidly expanding, driven by corporate sustainability goals and cost savings on energy.
The industrial segment utilizes large-scale systems to provide the energy necessary for manufacturing processes, including large wind turbines and hydroelectric power. Growth in the industrial sector is robust, supported by the need to reduce operational costs and comply with government regulations. The utility segment Refers to large-scale generation projects like utility-scale wind farms and solar parks that contribute directly to the electrical grid. This is the largest and most dominant sector due to the massive scale and substantial investments in grid-scale renewable projects.
Recent Developments:
- In April 2023, ArcelorMittal Brazil, a subsidiary of ArcelorMittal, formed a joint venture with Brazilian renewable energy firm Casa dos Ventos to develop the Babilonia wind power project in Bahia, northeastern Brazil. This project is expected to generate 554 megawatts (MW) of power and involves an investment of approximately USD 800 million. ArcelorMittal will hold a 55% stake in the venture, with Casa dos Ventos owning the remaining 45%.
- In January 2023, Cepsa unveiled plans to build three solar power projects in Castilla-La Mancha, Spain, with a total capacity of 400 megawatts (MW). The projects, which represent an investment of €280 million, will be located in Campo de Criptana and Arenales de San Gregorio.
- In January 2023, it was announced that CSI Energy Storage, which is part of CSI Solar Co., Ltd., a majority-owned subsidiary of Canadian Solar Inc., will supply Pulse Clean Energy with up to 550 MWh of its SolBank energy storage products. These storage solutions are slated for deployment across various projects in the UK.
- In May 2022, NJR Clean Energy Ventures (CEV) began constructing an 8.9-megawatt (MW) floating solar facility in Millburn, New Jersey, set to be the largest of its kind in the United States. The installation will feature about 16,510 solar panels on a reservoir at the New Jersey American Water Canoe Brook Water Treatment Plant. It is anticipated that the clean energy produced will cover roughly 95% of the plant's annual electricity needs.
Report Scope
Report Attribute |
Details |
Market Size in 2023 |
USD 1049.33 Billion |
Projected Market Size in 2032 |
USD 2204.47 Billion |
CAGR Growth Rate |
8.61% CAGR |
Base Year |
2023 |
Forecast Years |
2024-2032 |
Key Market Players |
ABB, Acciona, Acconia S.A., Canadian Solar Inc., EDF, Enel Spa, General Electric, Innergex, Invenergy, National Grid Renewables, NextEra Energy Inc., Ocean Power Technologies Inc., Orsted A/S, Siemens AG, Suzlon Energy Ltd., SynTech Bioenergy LLC, Tata Power, Tocardo BV, Vestas Wind Systems A/S, Yingli Solar, and Others. |
Key Segment |
By Energy Source, By End-User, and By Region |
Major Regions Covered |
North America, Europe, Asia Pacific, Latin America, and the Middle East &, Africa |
Purchase Options |
Request customized purchase options to meet your research needs. Explore purchase options |
Renewable Energy Market: Regional Analysis
Asia-Pacific region is experiencing the fastest growth in the renewable energy sector, led by China and India. Asia Pacific currently holds the top spot with a market share exceeding 36.9% (as of 2023) and a projected CAGR (Compound Annual Growth Rate) of around 9.5%. This dominance is fueled by rapid industrialization, urbanization, and a large, growing population, all leading to a high demand for clean energy.
North America, particularly the United States and Canada, is heavily invested in expanding its renewable energy capacity. The region has a strong policy framework supporting renewable energy, including federal tax incentives and state-level mandates for renewable energy consumption. The CAGR for North America is strong, driven by aggressive renewable targets and technological innovations in the wind and solar energy sectors.
Europe is a leader in renewable energy deployment, driven by stringent government policies aimed at reducing carbon emissions. This region holds a strong position with a market share of over 31.4% and a CAGR of around 8.7%. Countries like Germany, the UK, and Spain have made significant investments in wind, solar, and biomass energy. Europe’s renewable energy market is growing robustly, supported by EU-wide initiatives such as the Green Deal and various national decarbonization policies.
Latin America has vast potential for renewable energy development, particularly in solar and wind energy. Countries like Brazil, Chile, and Mexico are leading in the adoption of renewable energy technologies, thanks to rich natural resources and favorable government policies. The market is expected to grow steadily, with significant investments aimed at harnessing the region’s abundant renewable resources.
The Middle East and Africa are increasingly focusing on renewable energy to diversify energy sources away from fossil fuels and to meet the increasing demand for electricity. Solar energy, in particular, is becoming a significant focus due to the abundant sunlight. The growth rate in this region is promising, particularly in countries like South Africa and the UAE, which are actively promoting renewable energy projects.
Renewable Energy Market: Competitive Landscape
Some of the main competitors dominating the global renewable energy market include;
- ABB
- Acciona
- Acconia S.A.
- Canadian Solar Inc.
- EDF
- Enel Spa
- General Electric
- Innergex
- Invenergy
- National Grid Renewables
- NextEra Energy Inc.
- Ocean Power Technologies Inc.
- Orsted A/S
- Siemens AG
- Suzlon Energy Ltd.
- SynTech Bioenergy LLC
- Tata Power
- Tocardo BV
- Vestas Wind Systems A/S
- Yingli Solar
The global renewable energy market is segmented as follows:
By Energy Source
- Solar Energy
- Wind Energy
- Hydroelectric Power
- Biomass Energy
- Geothermal Energy
By End-User
- Residential
- Commercial
- Industrial
- Utility
By Regional Segment Analysis
- North America
- The U.S.
- Canada
- Mexico
- Europe
- France
- The UK
- Spain
- Germany
- Italy
- Rest of Europe
- Asia Pacific
- China
- Japan
- India
- Australia
- Southeast Asia
- Rest of Asia Pacific
- The Middle East & Africa
- Saudi Arabia
- UAE
- Egypt
- Kuwait
- South Africa
- Rest of the Middle East & Africa
- Latin America
- Brazil
- Argentina
- Rest of Latin America
Table of Content
Industry Major Market Players
- ABB
- Acciona
- Acconia S.A.
- Canadian Solar Inc.
- EDF
- Enel Spa
- General Electric
- Innergex
- Invenergy
- National Grid Renewables
- NextEra Energy Inc.
- Ocean Power Technologies Inc.
- Orsted A/S
- Siemens AG
- Suzlon Energy Ltd.
- SynTech Bioenergy LLC
- Tata Power
- Tocardo BV
- Vestas Wind Systems A/S
- Yingli Solar


Copyright © 2024 - 2025, All Rights Reserved, Facts and Factors