Search Market Research Report

Discover Our Latest Reports
Discover Our Featured Reports
Discover Top Selling Reports

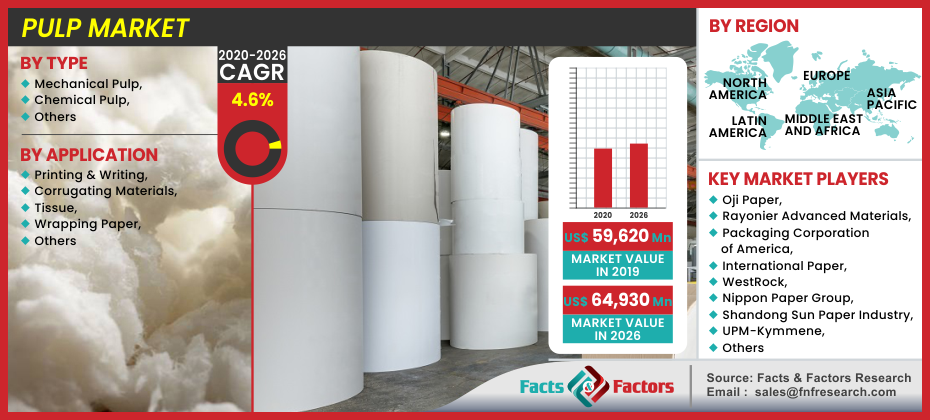
Pulp Market Size, Share Global Analysis Report, , 2020 – 2026

report img

Pulp Market By Type (Mechanical Pulp, Chemical Pulp, and Others), By Application (Printing & Writing, Corrugating Materials, Tissue, Wrapping Paper, and Others) : Global Industry Perspective, Comprehensive Analysis, and Forecast, 2020 – 2026

Industry Insights

[195+ Pages Report] The global pulp market is set for rapid growth over the forecast period. In terms of revenue, the global pulp market accounted for USD 59,620.0 Million in 2019 and is anticipated to reach around USD 64,930.0 Million by 2026, growing at a CAGR of 4.6%.

logoMarket Overview

Pulp is a wood-based raw material that is pure, organic, and biodegradable. It can be used to make paper, tissue, sheets, and advanced paper, all of which will be 100% organic bioproducts. Paper pulp is a raw material that is used to make paper. The rest of the paper is made from wood pulp. Paper has been around for a long time and is an important aspect of daily life. Due to increased demand from printing and writing applications, the pulp market is anticipated to grow.

logoIndustry Growth Factors

The increasing demand from the corrugating materials industry is expected to drive the pulp market. Over the last few years, the textile industry has expanded its research spending. Jute and flax pulp would be easier to produce and products as a result of this trend. In addition, hemp pulp is gaining prominence in the textile industry. The increasing global demand for tissue paper, which is mainly used in kitchens, bathrooms, and homes, is expected to fuel market growth in the upcoming years. Increased demand for wood pulp from the paper industry, increasing customer demand for tissue paper products, and an increase in the trade-in wood pulp products have all been described as market factors. Stringent environmental legislation, especially concerning deforestation, as well as rising energy and transportation costs, have been identified as market restraints.

logo COVID-19 Impact

COVID-19's outbreak in 2020 has an impact on the global economy and business situation in major industries around the world. The global lockout has resulted in export constraints, trade practices, supply-chain uncertainty, and other events as a consequence of the pandemic scenario. During this time, primary end-use application industries for pulp, such as printing and writing, corrugated materials, tissue, and wrapping paper, were also impacted. This illustration has been drastically altered by the COVID-19 pandemic. China is now in the early stages of rehabilitation after taking draconian measures to contain the epidemic. The delayed response in the United States and Europe is increasingly evolving into a strong and all-encompassing response.

These policies will have an especially negative economic impact, and they have significantly raised the likelihood of a recession. The global economy has already started to exhibit signs of substantial decline, raising the risk and severity of a slowdown exponentially. Due to weak demand from end-use markets, the high-growth pulp market is projected to slow down in 2020. The economy, on the other hand, is improving, and enterprises have resumed operations with reduced capabilities and in line with government regulations. At the beginning of 2021, all end-use markets are projected to be fully operational, resulting in a strong demand for pulp. As a result, demand is expected to increase rapidly over the forecasted period. Several applicants from the printing and writing, corrugating materials, and paper sectors have shown interest in using pulp products to improve the quality of their products. During COVID-19 lockdowns, the pulp industry faced both a supply and demand crunch.

If COVID-19 infections spread across the workforce, plant capacity may be harmed unless appropriate preventative measures are taken. The lockdown slowed the manufacturing of pulp. Due to the lockdown, the supply of finished goods and the procurement of raw materials were also hindered in the supply chain and logistics. Because the majority of the pulp industry's production workforce is employed in on-site jobs that cannot be performed remotely, the industry may be particularly vulnerable. Furthermore, given the nature of the industry, businesses may need to consider how to generate social distancing in workplaces where workers are often crowded. Trade limitations, market fluctuations, production chain disruption, unpredictable demand, and workforce shortages are estimated to affect the chemical industry as a whole.

Pulp Market

To know more about this report | Request Free Sample Copy

logoGlobal Pulp Market: Segmentation

The global pulp market is bifurcated into its type, application, and regions. By type, the global market is divided into mechanical pulp, chemical pulp, and others. In 2019, the chemical pulp segment was the leading segment accounted for more than 70% of the market revenue share among the other segments. Based on application, the global pulp market is divided into printing & writing, corrugating materials, tissue, wrapping paper, and others. In 2019, the corrugating materials segment was the leading segment accounted for more than 30% of the market revenue share among the other segments. Geographically, the global pulp market is divided into North America, Asia-Pacific, Europe, Latin America, and Middle East & Africa.

logoGlobal Pulp Market: Regional Analysis

Asia Pacific region dominated the global pulp market in 2019 and is anticipated to continue its dominance in the upcoming years. The Asia Pacific market is also anticipated to a significant growth rate in the forecast period. The dominance of the Asia Pacific market can be attributed to the rapid industrialization and the growing paper industry in the region. The Chinese government has implemented several new regulations on waste paper importation in response to rising environmental awareness and safety concerns, resulting in a surge in demand from China. In terms of consumption, Germany, France, and the United Kingdom dominate the European pulp industry across a broad variety of applications. In addition, the arrival of major players is expected to fuel demand even further. The province's market for pulp would be driven by the heavy presence of influential pulp producers, as well as private sector investment in processing and expansion of R&D operations.

logoReport Scope

Report Attribute

Details

Market Size in 2019

USD 59,620.0 Million

Projected Market Size in 2026

USD 64,930.0 Million

Growth Rate

CAGR 4.6%

Base Year

2019

Forecast Years

2020-2026

Key Market Players

Oji Paper, Rayonier Advanced Materials, Packaging Corporation of America, International Paper, WestRock, Nippon Paper Group, Shandong Sun Paper Industry, UPM-Kymmene, Mitsubishi Paper Mills, and Stora Ensoamong others.

Key Segment

By Type, By Application, and By Region

Major Regions Covered

North America, Europe, Asia Pacific, Latin America, and the Middle East & Africa

Purchase Options

Request customized purchase options to meet your research needs. Explore purchase options

logoGlobal Pulp Market: Competitive Players

Some of the key players in the pulp market are

  • Oji Paper
  • Rayonier Advanced Materials
  • Packaging Corporation of America
  • International Paper
  • WestRock
  • Nippon Paper Group
  • Shandong Sun Paper Industry
  • UPM-Kymmene
  • Mitsubishi Paper Mills
  • Stora Enso

logoGlobal Pulp Market: Regional Segment Analysis

  • North America 
    • U.S. 
    • Canada 
  • Europe 
    • Germany 
    • France 
    • U.K. 
    • Italy 
    • Spain 
    • Rest of Europe 
  • Asia Pacific 
    • China 
    • Japan 
    • India 
    • South Korea 
    • South-East Asia 
    • Rest of Asia Pacific 
  • Latin America 
    • Brazil 
    • Mexico 
    • Rest of Latin America 
  • The Middle-East and Africa 
    • GCC Countries 
    • South Africa 
    • Rest of Middle-East Africa 

Table of Content

  1. Chapter 1 Executive Summary
    1. 1.1. Introduction of Pulp
    2. 1.2. Global Pulp Market, 2019 & 2026 (USD Million)
    3. 1.3. Global Pulp Market, 2016 – 2026 (USD Million) (Kilo Tons)
    4. 1.4. Global Pulp Market Absolute Revenue Opportunity, 2016 – 2026 (USD Million)
    5. 1.5. Global Pulp Market Incremental Revenue Opportunity, 2020 – 2026 (USD Million)
  2. Chapter 2 Pulp Market – Type Analysis
    1. 2.1. Global Pulp Market – Type Overview
    2. 2.2. Global Pulp Market Share, by Type, 2019 & 2026 (USD Million)
    3. 2.3. Global Pulp Market share, by Type, 2019 & 2026 (Kilo Tons)
    4. 2.4. Mechanical Pulp
      1. 2.4.1. Global Mechanical Pulp Pulp Market, 2016 – 2026 (USD Million)
      2. 2.4.2. Global Mechanical Pulp Pulp Market, 2016 – 2026 (Kilo Tons)
    5. 2.5. Chemical Pulp
      1. 2.5.1. Global Chemical Pulp Pulp Market, 2016 – 2026 (USD Million)
      2. 2.5.2. Global Chemical Pulp Pulp Market, 2016 – 2026 (Kilo Tons)
    6. 2.6. Others
      1. 2.6.1. Global Others Pulp Market, 2016 – 2026 (USD Million)
      2. 2.6.2. Global Others Pulp Market, 2016 – 2026 (Kilo Tons)
  3. Chapter 3 Pulp Market – Application Analysis
    1. 3.1. Global Pulp Market – Application Overview
    2. 3.2. Global Pulp Market Share, by Application, 2019 & 2026 (USD Million)
    3. 3.3. Global Pulp Market share, by Application, 2019 & 2026 (Kilo Tons)
    4. 3.4. Printing & Writing
      1. 3.4.1. Global Printing & Writing Pulp Market, 2016 – 2026 (USD Million)
      2. 3.4.2. Global Printing & Writing Pulp Market, 2016 – 2026 (Kilo Tons)
    5. 3.5. Corrugating Materials
      1. 3.5.1. Global Corrugating Materials Pulp Market, 2016 – 2026 (USD Million)
      2. 3.5.2. Global Corrugating Materials Pulp Market, 2016 – 2026 (Kilo Tons)
    6. 3.6. Tissue
      1. 3.6.1. Global Tissue Pulp Market, 2016 – 2026 (USD Million)
      2. 3.6.2. Global Tissue Pulp Market, 2016 – 2026 (Kilo Tons)
    7. 3.7. Wrapping Paper
      1. 3.7.1. Global Wrapping Paper Pulp Market, 2016 – 2026 (USD Million)
      2. 3.7.2. Global Wrapping Paper Pulp Market, 2016 – 2026 (Kilo Tons)
    8. 3.8. Others
      1. 3.8.1. Global Others Pulp Market, 2016 – 2026 (USD Million)
      2. 3.8.2. Global Others Pulp Market, 2016 – 2026 (Kilo Tons)
  4. Chapter 4 Pulp Market – Regional Analysis
    1. 4.1. Global Pulp Market Regional Overview
    2. 4.2. Global Pulp Market Share, by Region, 2019 & 2026 (USD Million)
    3. 4.3. Global Pulp Market Share, by Region, 2019 & 2026 (Kilo Tons)
    4. 4.4. North America
      1. 4.4.1. North America Pulp Market, 2016 – 2026 (USD Million)
        1. 4.4.1.1. North America Pulp Market, by Country, 2016 – 2026 (USD Million)
      2. 4.4.2. North America Market, 2016 – 2026 (Kilo Tons)
        1. 4.4.2.1. North America Pulp Market, by Country, 2016 – 2026 (Kilo Tons)
      3. 4.4.3. North America Pulp Market, by Type, 2016 – 2026
        1. 4.4.3.1. North America Pulp Market, by Type, 2016 – 2026 (USD Million)
        2. 4.4.3.2. North America Pulp Market, by Type, 2016 – 2026 (Kilo Tons)
      4. 4.4.4. North America Pulp Market, by Application, 2016 – 2026
        1. 4.4.4.1. North America Pulp Market, by Application, 2016 – 2026 (USD Million)
        2. 4.4.4.2. North America Pulp Market, by Application, 2016 – 2026 (Kilo Tons)
      5. 4.4.5. U.S.
        1. 4.4.5.1. U.S. Pulp Market, 2016 – 2026 (USD Million)
        2. 4.4.5.2. U.S. Pulp Market, 2016 – 2026 (Kilo Tons)
      6. 4.4.6. Canada
        1. 4.4.6.1. Canada Pulp Market, 2016 – 2026 (USD Million)
        2. 4.4.6.2. Canada Pulp Market, 2016 – 2026 (Kilo Tons)
    5. 4.5. Europe
      1. 4.5.1. Europe Pulp Market, 2016 – 2026 (USD Million)
        1. 4.5.1.1. Europe Pulp Market, by Country, 2016 – 2026 (USD Million)
      2. 4.5.2. Europe Market, 2016 – 2026 (Kilo Tons)
        1. 4.5.2.1. Europe Pulp Market, by Country, 2016 – 2026 (Kilo Tons)
      3. 4.5.3. Europe Pulp Market, by Type, 2016 – 2026
        1. 4.5.3.1. Europe Pulp Market, by Type, 2016 – 2026 (USD Million)
        2. 4.5.3.2. Europe Pulp Market, by Type, 2016 – 2026 (Kilo Tons)
      4. 4.5.4. Europe Pulp Market, by Application, 2016 – 2026
        1. 4.5.4.1. Europe Pulp Market, by Application, 2016 – 2026 (USD Million)
        2. 4.5.4.2. Europe Pulp Market, by Application, 2016 – 2026 (Kilo Tons)
      5. 4.5.5. Germany
        1. 4.5.5.1. Germany Pulp Market, 2016 – 2026 (USD Million)
        2. 4.5.5.2. Germany Pulp Market, 2016 – 2026 (Kilo Tons)
      6. 4.5.6. France
        1. 4.5.6.1. France Pulp Market, 2016 – 2026 (USD Million)
        2. 4.5.6.2. France Pulp Market, 2016 – 2026 (Kilo Tons)
      7. 4.5.7. U.K.
        1. 4.5.7.1. U.K. Pulp Market, 2016 – 2026 (USD Million)
        2. 4.5.7.2. U.K. Pulp Market, 2016 – 2026 (Kilo Tons)
      8. 4.5.8. Italy
        1. 4.5.8.1. Italy Pulp Market, 2016 – 2026 (USD Million)
        2. 4.5.8.2. Italy Pulp Market, 2016 – 2026 (Kilo Tons)
      9. 4.5.9. Spain
        1. 4.5.9.1. Spain Pulp Market, 2016 – 2026 (USD Million)
        2. 4.5.9.2. Spain Pulp Market, 2016 – 2026 (Kilo Tons)
      10. 4.5.10. Rest of Europe
        1. 4.5.10.1. Rest of Europe Pulp Market, 2016 – 2026 (USD Million)
        2. 4.5.10.2. Rest of Europe Pulp Market, 2016 – 2026 (Kilo Tons)
    6. 4.6. Asia Pacific
      1. 4.6.1. Asia Pacific Pulp Market, 2016 – 2026 (USD Million)
        1. 4.6.1.1. Asia Pacific Pulp Market, by Country, 2016 – 2026 (USD Million)
      2. 4.6.2. Asia Pacific Market, 2016 – 2026 (Kilo Tons)
        1. 4.6.2.1. Asia Pacific Pulp Market, by Country, 2016 – 2026 (Kilo Tons)
      3. 4.6.3. Asia Pacific Pulp Market, by Type, 2016 – 2026
        1. 4.6.3.1. Asia Pacific Pulp Market, by Type, 2016 – 2026 (USD Million)
        2. 4.6.3.2. Asia Pacific Pulp Market, by Type, 2016 – 2026 (Kilo Tons)
      4. 4.6.4. Asia Pacific Pulp Market, by Application, 2016 – 2026
        1. 4.6.4.1. Asia Pacific Pulp Market, by Application, 2016 – 2026 (USD Million)
        2. 4.6.4.2. Asia Pacific Pulp Market, by Application, 2016 – 2026 (Kilo Tons)
      5. 4.6.5. China
        1. 4.6.5.1. China Pulp Market, 2016 – 2026 (USD Million)
        2. 4.6.5.2. China Pulp Market, 2016 – 2026 (Kilo Tons)
      6. 4.6.6. Japan
        1. 4.6.6.1. Japan Pulp Market, 2016 – 2026 (USD Million)
        2. 4.6.6.2. Japan Pulp Market, 2016 – 2026 (Kilo Tons)
      7. 4.6.7. India
        1. 4.6.7.1. India Pulp Market, 2016 – 2026 (USD Million)
        2. 4.6.7.2. India Pulp Market, 2016 – 2026 (Kilo Tons)
      8. 4.6.8. South Korea
        1. 4.6.8.1. South Korea Pulp Market, 2016 – 2026 (USD Million)
        2. 4.6.8.2. South Korea Pulp Market, 2016 – 2026 (Kilo Tons)
      9. 4.6.9. South-East Asia
        1. 4.6.9.1. South-East Asia Pulp Market, 2016 – 2026 (USD Million)
        2. 4.6.9.2. South-East Asia Pulp Market, 2016 – 2026 (Kilo Tons)
      10. 4.6.10. Rest of Asia Pacific
        1. 4.6.10.1. Rest of Asia Pacific Pulp Market, 2016 – 2026 (USD Million)
        2. 4.6.10.2. Rest of Asia Pacific Pulp Market, 2016 – 2026 (Kilo Tons)
    7. 4.7. Latin America
      1. 4.7.1. Latin America Pulp Market, 2016 – 2026 (USD Million)
        1. 4.7.1.1. Latin America Pulp Market, by Country, 2016 – 2026 (USD Million)
      2. 4.7.2. Latin America Market, 2016 – 2026 (Kilo Tons)
        1. 4.7.2.1. Latin America Pulp Market, by Country, 2016 – 2026 (Kilo Tons)
      3. 4.7.3. Latin America Pulp Market, by Type, 2016 – 2026
        1. 4.7.3.1. Latin America Pulp Market, by Type, 2016 – 2026 (USD Million)
        2. 4.7.3.2. Latin America Pulp Market, by Type, 2016 – 2026 (Kilo Tons)
      4. 4.7.4. Latin America Pulp Market, by Application, 2016 – 2026
        1. 4.7.4.1. Latin America Pulp Market, by Application, 2016 – 2026 (USD Million)
        2. 4.7.4.2. Latin America Pulp Market, by Application, 2016 – 2026 (Kilo Tons)
      5. 4.7.5. Brazil
        1. 4.7.5.1. Brazil Pulp Market, 2016 – 2026 (USD Million)
        2. 4.7.5.2. Brazil Pulp Market, 2016 – 2026 (Kilo Tons)
      6. 4.7.6. Mexico
        1. 4.7.6.1. Mexico Pulp Market, 2016 – 2026 (USD Million)
        2. 4.7.6.2. Mexico Pulp Market, 2016 – 2026 (Kilo Tons)
      7. 4.7.7. Rest of Latin America
        1. 4.7.7.1. Rest of Latin America Pulp Market, 2016 – 2026 (USD Million)
        2. 4.7.7.2. Rest of Latin America Pulp Market, 2016 – 2026 (Kilo Tons)
    8. 4.8. The Middle-East and Africa
      1. 4.8.1. The Middle-East and Africa Pulp Market, 2016 – 2026 (USD Million)
        1. 4.8.1.1. The Middle-East and Africa Pulp Market, by Country, 2016 – 2026 (USD Million)
      2. 4.8.2. The Middle-East and Africa Market, 2016 – 2026 (Kilo Tons)
        1. 4.8.2.1. The Middle-East and Africa Pulp Market, by Country, 2016 – 2026 (Kilo Tons)
      3. 4.8.3. The Middle-East and Africa Pulp Market, by Type, 2016 – 2026
        1. 4.8.3.1. The Middle-East and Africa Pulp Market, by Type, 2016 – 2026 (USD Million)
        2. 4.8.3.2. The Middle-East and Africa Pulp Market, by Type, 2016 – 2026 (Kilo Tons)
      4. 4.8.4. The Middle-East and Africa Pulp Market, by Application, 2016 – 2026
        1. 4.8.4.1. The Middle-East and Africa Pulp Market, by Application, 2016 – 2026 (USD Million)
        2. 4.8.4.2. The Middle-East and Africa Pulp Market, by Application, 2016 – 2026 (Kilo Tons)
      5. 4.8.5. GCC Countries
        1. 4.8.5.1. GCC Countries Pulp Market, 2016 – 2026 (USD Million)
        2. 4.8.5.2. GCC Countries Pulp Market, 2016 – 2026 (Kilo Tons)
      6. 4.8.6. South Africa
        1. 4.8.6.1. South Africa Pulp Market, 2016 – 2026 (USD Million)
        2. 4.8.6.2. South Africa Pulp Market, 2016 – 2026 (Kilo Tons)
      7. 4.8.7. Rest of Middle-East Africa
        1. 4.8.7.1. Rest of Middle-East Africa Pulp Market, 2016 – 2026 (USD Million)
        2. 4.8.7.2. Rest of Middle-East Africa Pulp Market, 2016 – 2026 (Kilo Tons)
  5. Chapter 5 Pulp Production, Consumption, Export, Import by Regions
    1. 5.1. Global Pulp Production and Consumption, 2016 – 2026 (Kilo Tons)
    2. 5.2. Global Import and Export Analysis, by Region
  6. Chapter 6 Pulp Market – Competitive Landscape
    1. 6.1. Competitor Market Share – Revenue
    2. 6.2. Market Concentration Rate Analysis, Top 3 and Top 5 Players
    3. 6.3. Competitor Market Share – Volume
    4. 6.4. Strategic Developments
      1. 6.4.1. Acquisitions and Mergers
      2. 6.4.2. New Products
      3. 6.4.3. Research & Development Activities
  7. Chapter 7 Company Profiles
    1. 7.1. Rayonier Advanced Materials
      1. 7.1.1. Company Overview
      2. 7.1.2. Product/Service Portfolio
      3. 7.1.3. Rayonier Advanced Materials Sales, Revenue, Price, and Gross Margin
      4. 7.1.4. Rayonier Advanced Materials Revenue and Growth Rate
      5. 7.1.5. Rayonier Advanced Materials Market Share
      6. 7.1.6. Recent Initiatives, Funding/VC Activities, and Technological Innovations
    2. 7.2. Oji Paper
      1. 7.2.1. Company Overview
      2. 7.2.2. Product/Service Portfolio
      3. 7.2.3. Oji Paper Sales, Revenue, Price, and Gross Margin
      4. 7.2.4. Oji Paper Revenue and Growth Rate
      5. 7.2.5. Oji Paper Market Share
      6. 7.2.6. Recent Initiatives, Funding/VC Activities, and Technological Innovations
    3. 7.3. International Paper
      1. 7.3.1. Company Overview
      2. 7.3.2. Product/Service Portfolio
      3. 7.3.3. International Paper Sales, Revenue, Price, and Gross Margin
      4. 7.3.4. International Paper Revenue and Growth Rate
      5. 7.3.5. International Paper Market Share
      6. 7.3.6. Recent Initiatives, Funding/VC Activities, and Technological Innovations
    4. 7.4. Packaging Corporation of America
      1. 7.4.1. Company Overview
      2. 7.4.2. Product/Service Portfolio
      3. 7.4.3. Packaging Corporation of America Sales, Revenue, Price, and Gross Margin
      4. 7.4.4. Packaging Corporation of America Revenue and Growth Rate
      5. 7.4.5. Packaging Corporation of America Market Share
      6. 7.4.6. Recent Initiatives, Funding/VC Activities, and Technological Innovations
    5. 7.5. Nippon Paper Group
      1. 7.5.1. Company Overview
      2. 7.5.2. Product/Service Portfolio
      3. 7.5.3. Nippon Paper Group Sales, Revenue, Price, and Gross Margin
      4. 7.5.4. Nippon Paper Group Revenue and Growth Rate
      5. 7.5.5. Nippon Paper Group Market Share
      6. 7.5.6. Recent Initiatives, Funding/VC Activities, and Technological Innovations
    6. 7.6. WestRock
      1. 7.6.1. Company Overview
      2. 7.6.2. Product/Service Portfolio
      3. 7.6.3. WestRock Sales, Revenue, Price, and Gross Margin
      4. 7.6.4. WestRock Revenue and Growth Rate
      5. 7.6.5. WestRock Market Share
      6. 7.6.6. Recent Initiatives, Funding/VC Activities, and Technological Innovations
    7. 7.7. UPM-Kymmene
      1. 7.7.1. Company Overview
      2. 7.7.2. Product/Service Portfolio
      3. 7.7.3. UPM-Kymmene Sales, Revenue, Price, and Gross Margin
      4. 7.7.4. UPM-Kymmene Revenue and Growth Rate
      5. 7.7.5. UPM-Kymmene Market Share
      6. 7.7.6. Recent Initiatives, Funding/VC Activities, and Technological Innovations
    8. 7.8. Shandong Sun Paper Industry
      1. 7.8.1. Company Overview
      2. 7.8.2. Product/Service Portfolio
      3. 7.8.3. Shandong Sun Paper Industry Sales, Revenue, Price, and Gross Margin
      4. 7.8.4. Shandong Sun Paper Industry Revenue and Growth Rate
      5. 7.8.5. Shandong Sun Paper Industry Market Share
      6. 7.8.6. Recent Initiatives, Funding/VC Activities, and Technological Innovations
    9. 7.9. Mitsubishi Paper Mills
      1. 7.9.1. Company Overview
      2. 7.9.2. Product/Service Portfolio
      3. 7.9.3. Mitsubishi Paper Mills Sales, Revenue, Price, and Gross Margin
      4. 7.9.4. Mitsubishi Paper Mills Revenue and Growth Rate
      5. 7.9.5. Mitsubishi Paper Mills Market Share
      6. 7.9.6. Recent Initiatives, Funding/VC Activities, and Technological Innovations
    10. 7.10. Stora Enso
      1. 7.10.1. Company Overview
      2. 7.10.2. Product/Service Portfolio
      3. 7.10.3. Stora Enso Sales, Revenue, Price, and Gross Margin
      4. 7.10.4. Stora Enso Revenue and Growth Rate
      5. 7.10.5. Stora Enso Market Share
      6. 7.10.6. Recent Initiatives, Funding/VC Activities, and Technological Innovations
  8. Chapter 8 Pulp — Industry Analysis
    1. 8.1. Introduction and Taxonomy
    2. 8.2. Pulp Market – Key Trends
      1. 8.2.1. Market Drivers
      2. 8.2.2. Market Restraints
      3. 8.2.3. Market Opportunities
    3. 8.3. Value Chain Analysis
    4. 8.4. Key Mandates and Regulations
    5. 8.5. Technology Roadmap and Timeline
    6. 8.6. Pulp Market – Attractiveness Analysis
      1. 8.6.1. By Type
      2. 8.6.2. By Application
      3. 8.6.3. By Region
  9. Chapter 9 Raw Material Analysis
    1. 9.1. Pulp Key Raw Material Analysis
      1. 9.1.1. Key Raw Materials
      2. 9.1.2. Price Trend of Key Raw Materials
    2. 9.2. Key Suppliers of Raw Materials
    3. 9.3. Proportion of Manufacturing Cost Structure
      1. 9.3.1. Raw Materials Cost
      2. 9.3.2. Labor Cost
      3. 9.3.3. Manufacturing Expenses
      4. 9.3.4. Miscellaneous Expenses
    4. 9.4. Manufacturing Cost Analysis of Pulp
  10. Chapter 10 Industrial Chain, Sourcing Strategy, and Downstream Buyers
    1. 10.1. Pulp Industrial Chain Analysis
    2. 10.2. Upstream Raw Materials Sourcing
      1. 10.2.1. Risk Mitigation:
      2. 10.2.2. Supplier Relationships:
      3. 10.2.3. Business Processes:
      4. 10.2.4. Securing the Product:
    3. 10.3. Raw Materials Sources of Pulp Major Manufacturers
    4. 10.4. Downstream Buyers
    5. 10.5. Distributors/Traders List
  11. Chapter 11 Marketing Strategy Analysis, Distributors
    1. 11.1. Marketing Channel
    2. 11.2. Direct Marketing
    3. 11.3. Indirect Marketing
    4. 11.4. Marketing Channel Development Trends
    5. 11.5. Economic/Political Environmental Change
  12. Chapter 12 Report Conclusion & Key Insights
    1. 12.1. Key Insights from Primary Interviews & Surveys Respondents
    2. 12.2. Key Takeaways from Analysts, Consultants, and Industry Leaders
  13. Chapter 13 Research Approach & Methodology
    1. 13.1. Report Description
    2. 13.2. Research Scope
    3. 13.3. Research Methodology
      1. 13.3.1. Secondary Research
      2. 13.3.2. Primary Research
      3. 13.3.3. Statistical Models
        1. 13.3.3.1. Company Share Analysis Model
        2. 13.3.3.2. Revenue Based Modeling
      4. 13.3.4. Research Limitations

      List of Figures

      Fig.1	Product Picture of Pulp
      Fig.2	Global Pulp Market, 2016 – 2026 (USD Million)
      Fig.3	Global Pulp Market, 2016 – 2026 (Kilo Tons)
      Fig.4	Global Pulp Market Absolute Revenue Opportunity, 2016 – 2026 (USD Million)
      Fig.5	Global Pulp Market Incremental Revenue Opportunity, 2020 – 2026 (USD Million)
      Fig.6	Global Pulp Market Share, by Type, 2019 & 2026 (USD Million)
      Fig.7	Global Pulp Market Share, by Type, 2019 & 2026 (Kilo Tons)
      Fig.8	Global Mechanical Pulp Pulp Market, 2016 – 2026 (USD Million)
      Fig.9	Global Mechanical Pulp Pulp Market, 2016 – 2026 (Kilo Tons)
      Fig.10	Global Chemical Pulp Pulp Market, 2016 – 2026 (USD Million)
      Fig.11	Global Chemical Pulp Pulp Market, 2016 – 2026 (Kilo Tons)
      Fig.12	Global Others Pulp Market, 2016 – 2026 (USD Million)
      Fig.13	Global Others Pulp Market, 2016 – 2026 (Kilo Tons)
      Fig.14	Global Pulp Market Share, by Application, 2019 & 2026 (USD Million)
      Fig.15	Global Pulp Market Share, by Application, 2019 & 2026 (Kilo Tons)
      Fig.16	Global Printing & Writing Pulp Market, 2016 – 2026 (USD Million)
      Fig.17	Global Printing & Writing Pulp Market, 2016 – 2026 (Kilo Tons)
      Fig.18	Global Corrugating Materials Pulp Market, 2016 – 2026 (USD Million)
      Fig.19	Global Corrugating Materials Pulp Market, 2016 – 2026 (Kilo Tons)
      Fig.20	Global Tissue Pulp Market, 2016 – 2026 (USD Million)
      Fig.21	Global Tissue Pulp Market, 2016 – 2026 (Kilo Tons)
      Fig.22	Global Wrapping Paper Pulp Market, 2016 – 2026 (USD Million)
      Fig.23	Global Wrapping Paper Pulp Market, 2016 – 2026 (Kilo Tons)
      Fig.24	Global Others Pulp Market, 2016 – 2026 (USD Million)
      Fig.25	Global Others Pulp Market, 2016 – 2026 (Kilo Tons)
      Fig.26	Global Pulp Market Share, by Region, 2019 & 2026 (USD Million)
      Fig.27	Global Pulp Market Share, by Region, 2019 & 2026 (Kilo Tons)
      Fig.28	North America Pulp Market, 2016 – 2026 (USD Million)
      Fig.29	North America Pulp Market, 2016 – 2026 (Kilo Tons)
      Fig.30	U.S. Pulp Market, 2016 – 2026 (USD Million)
      Fig.31	U.S. Pulp  Market, 2016 – 2026 (Kilo Tons)
      Fig.32	Canada Pulp Market, 2016 – 2026 (USD Million)
      Fig.33	Canada Pulp  Market, 2016 – 2026 (Kilo Tons)
      Fig.34	Europe Pulp Market, 2016 – 2026 (USD Million)
      Fig.35	Europe Pulp Market, 2016 – 2026 (Kilo Tons)
      Fig.36	Germany Pulp Market, 2016 – 2026 (USD Million)
      Fig.37	Germany Pulp  Market, 2016 – 2026 (Kilo Tons)
      Fig.38	France Pulp Market, 2016 – 2026 (USD Million)
      Fig.39	France Pulp  Market, 2016 – 2026 (Kilo Tons)
      Fig.40	U.K. Pulp Market, 2016 – 2026 (USD Million)
      Fig.41	U.K. Pulp  Market, 2016 – 2026 (Kilo Tons)
      Fig.42	Italy Pulp Market, 2016 – 2026 (USD Million)
      Fig.43	Italy Pulp  Market, 2016 – 2026 (Kilo Tons)
      Fig.44	Spain Pulp Market, 2016 – 2026 (USD Million)
      Fig.45	Spain Pulp  Market, 2016 – 2026 (Kilo Tons)
      Fig.46	Rest of Europe Pulp Market, 2016 – 2026 (USD Million)
      Fig.47	Rest of Europe Pulp  Market, 2016 – 2026 (Kilo Tons)
      Fig.48	Asia Pacific Pulp Market, 2016 – 2026 (USD Million)
      Fig.49	Asia Pacific Pulp Market, 2016 – 2026 (Kilo Tons)
      Fig.50	China Pulp Market, 2016 – 2026 (USD Million)
      Fig.51	China Pulp  Market, 2016 – 2026 (Kilo Tons)
      Fig.52	Japan Pulp Market, 2016 – 2026 (USD Million)
      Fig.53	Japan Pulp  Market, 2016 – 2026 (Kilo Tons)
      Fig.54	India Pulp Market, 2016 – 2026 (USD Million)
      Fig.55	India Pulp  Market, 2016 – 2026 (Kilo Tons)
      Fig.56	South  Korea Pulp Market, 2016 – 2026 (USD Million)
      Fig.57	South  Korea Pulp  Market, 2016 – 2026 (Kilo Tons)
      Fig.58	South-East Asia Pulp Market, 2016 – 2026 (USD Million)
      Fig.59	South-East Asia Pulp  Market, 2016 – 2026 (Kilo Tons)
      Fig.60	Rest of Asia Pacific Pulp Market, 2016 – 2026 (USD Million)
      Fig.61	Rest of Asia Pacific Pulp  Market, 2016 – 2026 (Kilo Tons)
      Fig.62	Latin America Pulp Market, 2016 – 2026 (USD Million)
      Fig.63	Latin America Pulp Market, 2016 – 2026 (Kilo Tons)
      Fig.64	Brazil Pulp Market, 2016 – 2026 (USD Million)
      Fig.65	Brazil Pulp  Market, 2016 – 2026 (Kilo Tons)
      Fig.66	Mexico Pulp Market, 2016 – 2026 (USD Million)
      Fig.67	Mexico Pulp  Market, 2016 – 2026 (Kilo Tons)
      Fig.68	Rest of Latin America Pulp Market, 2016 – 2026 (USD Million)
      Fig.69	Rest of Latin America Pulp  Market, 2016 – 2026 (Kilo Tons)
      Fig.70	The Middle-East and Africa Pulp Market, 2016 – 2026 (USD Million)
      Fig.71	The Middle-East and Africa Pulp Market, 2016 – 2026 (Kilo Tons)
      Fig.72	GCC Countries Pulp Market, 2016 – 2026 (USD Million)
      Fig.73	GCC Countries Pulp  Market, 2016 – 2026 (Kilo Tons)
      Fig.74	South Africa Pulp Market, 2016 – 2026 (USD Million)
      Fig.75	South Africa Pulp  Market, 2016 – 2026 (Kilo Tons)
      Fig.76	Rest of Middle-East Africa Pulp Market, 2016 – 2026 (USD Million)
      Fig.77	Rest of Middle-East Africa Pulp  Market, 2016 – 2026 (Kilo Tons)
      Fig.78	Global Pulp Production and Consumption, 2016 – 2026 (Kilo Tons)
      Fig.79	North America Pulp Production and Consumption, 2016 – 2026 (USD Million) (Kilo Tons)
      Fig.80	Europe Pulp Production and Consumption, 2016 – 2026 (USD Million) (Kilo Tons)
      Fig.81	Asia Pacific Pulp Production and Consumption, 2016 – 2026 (USD Million) (Kilo Tons)
      Fig.82	Latin America Pulp Production and Consumption, 2016 – 2026 (USD Million) (Kilo Tons)
      Fig.83	The Middle-East and Africa Pulp Production and Consumption, 2016 – 2026 (USD Million) (Kilo Tons)
      Fig.84	Competitor Market Share – Revenue
      Fig.85	Competitor Market Share – Volume
      Fig.86	Rayonier Advanced Materials Revenue and Growth Rate
      Fig.87	Rayonier Advanced Materials Market Share
      Fig.88	Oji Paper Revenue and Growth Rate
      Fig.89	Oji Paper Market Share
      Fig.90	International Paper Revenue and Growth Rate
      Fig.91	International Paper Market Share
      Fig.92	Packaging Corporation of America Revenue and Growth Rate
      Fig.93	Packaging Corporation of America Market Share
      Fig.94	Nippon Paper Group Revenue and Growth Rate
      Fig.95	Nippon Paper Group Market Share
      Fig.96	WestRock Revenue and Growth Rate
      Fig.97	WestRock Market Share
      Fig.98	UPM-Kymmene Revenue and Growth Rate
      Fig.99	UPM-Kymmene Market Share
      Fig.100	Shandong Sun Paper Industry Revenue and Growth Rate
      Fig.101	Shandong Sun Paper Industry Market Share
      Fig.102	Mitsubishi Paper Mills Revenue and Growth Rate
      Fig.103	Mitsubishi Paper Mills Market Share
      Fig.104	Stora Enso Revenue and Growth Rate
      Fig.105	Stora Enso Market Share
      Fig.106	Market Dynamics
      Fig.107	Global Pulp – Value Chain Analysis
      Fig.108	Key Mandates and Regulations
      Fig.109	Technology Roadmap and Timeline
      Fig.110	Market Attractiveness Analysis – By Type
      Fig.111	Market Attractiveness Analysis – By Application
      Fig.112	Market Attractiveness Analysis – By Region
      Fig.113	Manufacturing Cost Structure of Pulp
      Fig.114	Pulp Industrial Chain Analysis
      Fig.115	Market Channels
      Fig.116	Marketing Channel Development Trend
      Fig.117	Growth in World Gross Product, 2008-2018
      

      List of Tables

      Table 1	Global Pulp Market, 2019 & 2026 (USD Million)
      Table 2	Global Pulp Market, by Type, 2016 – 2026 (USD Million)
      Table 3	Global Pulp Market, by Type, 2016 – 2026 (Kilo Tons)
      Table 4	Global Pulp Market, by Application, 2016 – 2026 (USD Million)
      Table 5	Global Pulp Market, by Application, 2016 – 2026 (Kilo Tons)
      Table 6	Global Pulp Market, by Region, 2016 – 2026 (USD Million)
      Table 7	Global Pulp Market, by Region, 2016 – 2026 (Kilo Tons)
      Table 8	North America Pulp Market, by Country, 2016 – 2026 (USD Million)
      Table 9 North America Pulp Market, by Country, 2016 – 2026 (Kilo Tons)
      Table 10 North America Pulp Market, by Type, 2016 – 2026 (USD Million)
      Table 11 North America Pulp Market, by Type, 2016 – 2026 (Kilo Tons)
      Table 12 North America Pulp Market, by Application, 2016 – 2026 (USD Million)
      Table 13 North America Pulp Market, by Application, 2016 – 2026 (Kilo Tons)
      Table 14 Europe Pulp Market, by Country, 2016 – 2026 (USD Million)
      Table 15 Europe Pulp Market, by Country, 2016 – 2026 (Kilo Tons)
      Table 16 Europe Pulp Market, by Type, 2016 – 2026 (USD Million)
      Table 17 Europe Pulp Market, by Type, 2016 – 2026 (Kilo Tons)
      Table 18 Europe Pulp Market, by Application, 2016 – 2026 (USD Million)
      Table 19 Europe Pulp Market, by Application, 2016 – 2026 (Kilo Tons)
      Table 20 Asia Pacific Pulp Market, by Country, 2016 – 2026 (USD Million)
      Table 21 Asia Pacific Pulp Market, by Country, 2016 – 2026 (Kilo Tons)
      Table 22 Asia Pacific Pulp Market, by Type, 2016 – 2026 (USD Million)
      Table 23 Asia Pacific Pulp Market, by Type, 2016 – 2026 (Kilo Tons)
      Table 24 Asia Pacific Pulp Market, by Application, 2016 – 2026 (USD Million)
      Table 25 Asia Pacific Pulp Market, by Application, 2016 – 2026 (Kilo Tons)
      Table 26 Latin America Pulp Market, by Country, 2016 – 2026 (USD Million)
      Table 27 Latin America Pulp Market, by Country, 2016 – 2026 (Kilo Tons)
      Table 28 Latin America Pulp Market, by Type, 2016 – 2026 (USD Million)
      Table 29 Latin America Pulp Market, by Type, 2016 – 2026 (Kilo Tons)
      Table 30 Latin America Pulp Market, by Application, 2016 – 2026 (USD Million)
      Table 31 Latin America Pulp Market, by Application, 2016 – 2026 (Kilo Tons)
      Table 32 The Middle-East and Africa Pulp Market, by Country, 2016 – 2026 (USD Million)
      Table 33 The Middle-East and Africa Pulp Market, by Country, 2016 – 2026 (Kilo Tons)
      Table 34 The Middle-East and Africa Pulp Market, by Type, 2016 – 2026 (USD Million)
      Table 35 The Middle-East and Africa Pulp Market, by Type, 2016 – 2026 (Kilo Tons)
      Table 36 The Middle-East and Africa Pulp Market, by Application, 2016 – 2026 (USD Million)
      Table 37 The Middle-East and Africa Pulp Market, by Application, 2016 – 2026 (Kilo Tons)
      Table 38 North America Pulp Production, Consumption, Export, Import, 2016 – 2019
      Table 39 Europe Pulp Production, Consumption, Export, Import, 2016 – 2019
      Table 40 Asia Pacific Pulp Production, Consumption, Export, Import, 2016 – 2019
      Table 41 Latin America Pulp Production, Consumption, Export, Import, 2016 – 2019
      Table 42 The Middle-East and Africa Pulp Production, Consumption, Export, Import, 2016 – 2019
      Table 43 Global Pulp Market - Company Revenue Analysis, 2016 – 2019 (USD Million)
      Table 44 Global Pulp Market - Company Revenue Share Analysis, 2016 – 2019 (%)
      Table 45 Global Pulp Market - Company Volume Analysis, 2016 – 2019 (Kilo Tons)
      Table 46 Global Pulp Market - Company Volume Share Analysis, 2016 – 2019 (%)
      Table 47 Acquisitions and Mergers
      Table 48 Market Drivers – Impact Analysis
      Table 49 Market Restraints
      Table 50 Market Opportunities
      Table 51 Production Base and Market Concentration Rate of Raw Material
      Table 52 Key Suppliers of Raw Materials
      Table 53 Raw Materials Sources of Pulp Major Manufacturers
      Table 54 Major Buyers of Pulp
      Table 55 Distributors/Traders of Pulp by Region
      

Industry Major Market Players

  • Oji Paper
  • Rayonier Advanced Materials
  • Packaging Corporation of America
  • International Paper
  • WestRock
  • Nippon Paper Group
  • Shandong Sun Paper Industry
  • UPM-Kymmene
  • Mitsubishi Paper Mills
  • Stora Enso