Search Market Research Report

Discover Our Latest Reports
Discover Our Featured Reports
Discover Top Selling Reports

Precious Metals Market Size, Share Global Analysis Report, 2019–2026

report img

Precious Metals Market By Type (Gold, Silver, Platinum, Palladium, Others) and By End-User (Individual, Broker): Global Industry Perspective, Market Size, Statistical Research, Market Intelligence, Comprehensive Analysis, Historical Trends, and Forecast 2019–2026

Industry Insights

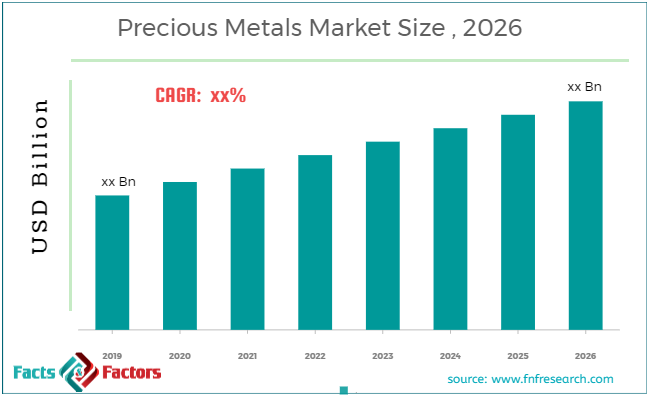
This professional and specialized report study examines the technical and business perspective of the precious metals industry. The report provides a historical analysis of the industry as well as the projected trends expected to be witnessed in the precious metals market. The report study analyzes the market statistics at the global as well as the regional levels to gain an in-depth perspective of the overall precious metals market. The historical insights are provided from 2016 to 2019 and projected trends are provided from 2020 to 2026. The quantitative data is provided in terms of value (USD Billion) for 2016 – 2026. The qualitative data is reinforced by analyzing and providing numerous market dynamics (directly or indirectly affecting the industry) such as growth drivers, restraints, challenges, and opportunities.

We have included various industry analysis models in our report and extensively demonstrated the key business strategies and competitive landscape of the precious metals market in our study.

Precious Metals Market Size

To know more about this report | Request Free Sample Copy


logoKey Insights from Primary Research

  • After conducting extensive interviews with C-level executives operating in the precious metals market, we analyzed that the global market is anticipated to foresee a considerable growth by the end of 2026.
  • In 2019, the precious metals generated revenues worth more than USD 290 billion owing to the use of precious metals in various end-use industries such as jewelry, automotive, electronics, etc. and is predicted the market to witness the lucrative growth of the market during the forecast period.
  • Geographically, Europe was the second-largest market for precious metals in 2019. This growth is attributed due to the high demand for gold, silver, and platinum in this region.
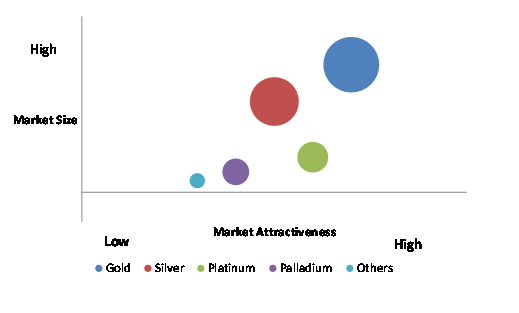
  • Based on type, the goldcategory penetrated the market with higher shares in 2019. Gold was followed by silver, generated revenue of more than USD 100 billion in 2019.However, our primary respondents believe that the silver segment is projected to witness significant growth over the future years.
  • Considering application segment, an individual category penetrated the market with around USD 220 billion in 2019 and is further anticipated to grow in the near future owing to increasing consumer interest in investment of gold and silver.

logoKey Recommendations from Analysts

  • Our analysts recommend,gold category is expected to exibit to grow at faster pace attributed tothe increasing customer demand forthe gold in the from of jewelry, coins, bars, biscuits, etc.
  • Due to the increasing interest and knowledge of customers about the trading of precious metals, the individual segment is anticipated to grow at a highest market share in the near future.
  • The significant CAGR of nearly 6% is observed by the global precious metals market and is set to bring profitable opportunities for the players owing to the increasing demand for precious metals globally.
  • Asia-Pacific is expected to be the fastest-growing market for precious metals during the coming years due to the increasing investments in the region. Moreover, the changing fashion trends, the growing demand for traditional and temple golden jewelry specifically for big-fat Indian weddings in this region. This parameter is projected to witness the robust demand for precious metal in the region over the upcoming years.    
  • Precious metal serves as a strong barrier during economic collapse and market volatility. Precious metals have no credit risk.Because of these reasons, our analysts predicted that the precious metals market will grow in the forthcoming years.

logoMarket Attractiveness by Type

Precious Metals Market

To know more about this report | Request Free Sample Copy

Our study also includes an analysis of Porter’s Five Forces framework for understanding the competitive strategies adopted by various stakeholders involved in the entire value chain of the precious metals market. It also encompasses PESTLE analysis and SWOT analysis.

The report also offers an in-depth analysis of the market shares of each industry player and gives an outline of the market position of key players in the precious metals market. Moreover, the study offers wide coverage of key strategic advances witnessed in the market such as new product launches, acquisitions & mergers, collaborations & joint ventures, funding & VC activities, agreements, partnerships, R&D activities, and regional expansion of key players of the precious metals market.

The research study provides a critical assessment of the precious metals industry by logically segmenting the market on the basis of type, end-user, and regions. Based on the past, present, and future trends, all the segments were analyzed from the bottom up, and the market sizes have been estimated from 2020 to 2026. The regional segmentation of the precious metals industry includes the holistic bifurcation of all the five major continents including North America, Europe, Asia Pacific, Latin America, and the Middle East & Africa.

Precious metals occur naturally and very rare metallic elements that have important economic value. By property, they are lustrous, malleable, and good conductors of electricity and heat. Generally, metals are solid at room temperature. Precious metals are industrial product and it is primarily considered as an investment. Gold and platinum are some of the most well-known precious metals of the industry. While the coinage metal and silver are used in industrial applications, such as jewelry, and art.

logoReport Scope

Report Attribute

Details

Market Size in 2019

USD 290 Billion

Projected Market Size in 2026

USD XX Billion

CAGR Growth Rate

6.0% CAGR

Base Year

2019

Forecast Years

2020-2026

Key Market Players

AvaTrade, Plus500 Ltd., AxiTrader, EToro Ltd., Forex.com, XM Global Limited, Henyep Capital Markets (HYCM), Pepperstone, XTB, Goodwill Wealth Management Private Limited, iForex, and others.

Key Segment

By Drive Type, End-User, and Region

Major Regions Covered

North America, Europe, Asia Pacific, Latin America, and the Middle East &, Africa

Purchase Options

Request customized purchase options to meet your research needs. Explore purchase options

Due to growing uncertainty in the market, investors are seeking a safe haven in the precious metals commodity. Increasing mining activities for precious metals is supporting market growth. Increasing demand for precious metals in various end-use industries such as jewelry, automotive, electronic, chemical, oil, and gas, etc. is driving the demand for precious metals. This, in turn, is supporting the precious metals market growth. Intensifying reportage of dirty gold and issues around where and in what way the metals are sourced and how it is moved through the supply chain are the factors may restrain the market growth. Illegal gold mining activities may hamper the market growth. Demand for precious metals such as gold, platinum, silver, etc. mainly comes from jewelry, everyday technological products, and for investment purposes. Growing end-use industries is anticipated to offer a lucrative opportunity for market growth. Precious metals have often been used as a safe investment. Hence, it is the most preferred commodity by the people for investment. The fluctuating stock market, uncertainty in the profit gain is likely to fuel the precious metals market growth in the near future.

The precious metals market is segmented based on type and end-user.  On the basis of type segmentation, the market is classified into gold, silver, platinum, palladium, and others. In terms of end-user, the market is bifurcated into an individual and broker.

logoSome of the essential players operating in the Precious Metals market, but not restricted to include

  • AvaTrade
  • XM Global Limited
  • XTB
  • Pepperstone
  • AxiTrader
  • EToro Ltd.
  • Forex.com
  • Plus500 Ltd.
  • Henyep Capital Markets (HYCM)
  • Forex 
  • Goodwill Wealth Management Private Limited

The taxonomy of the Precious Metals Market by its scope and segmentation is as follows:

logo By Type Segmentation Analysis

  • Gold

Silver

  • Platinum
  • Palladium
  • Others

logo By End-User Segmentation Analysis

  • Individual
  • Broker

logo Regional Segmentation Analysis

  • North America
    • The U.S.
    • Canada
  • Europe
    • France
    • The UK
    • Spain
    • Germany
    • Italy
    • Rest of Europe
  • Asia Pacific
    • China
    • Japan
    • India
    • South Korea
    • Southeast Asia
    • Rest of Asia Pacific
  • Latin America
    • Brazil
    • Mexico
    • Rest of Latin America
  • Middle East & Africa
    • GCC
    • South Africa
    • Rest of Middle East & Africa

logoKEY BUSINESS POINTERS ADDRESSED & FOREMOST REASONS TO PROCURE THE REPORT:

  • Statistical Analysis of the Past, Current, and Future Trends of the Industry with Validated Market Sizes Data
  • Direct and Indirect Rationales Impacting the Industry
  • In-depth and Micro Analysis of Viable Segments and Sub-segments
  • Companies and Vendors Market Share, Competitive Landscape, and Player Positioning Analysis
  • Demand Side (Consumption) and Supply Side (Production) Perspective and Analysis wherever applicable
  • Key Buyers and End-Users Analysis
  • Value Chain and Manufacturing Cost Structure Analysis wherever relevant
  • Key Marketing Strategies as well as Key Sales Channels adopted in the market
  • Investment Opportunity Analysis & Patents Analysis wherever feasible
  • Technological Road Map & Technical Analysis
  • Robust Research Methodology comprising dynamic mix (65%~35%) of Extensive Primary Research (primary interviews, ad-hoc surveys, questionnaires) and Protracted Secondary Research (proprietary in-house database, paid external databases, publically available validated sources)

Table of Content

  1. CHAPTER 1. Executive Summary
  2. CHAPTER 2. Precious Metals market – By Type Analysis
    1. 2.1. Global Precious Metals Market – By Type Overview
    2. 2.2. Global Precious Metals Market Share, by By Type, 2019&2026 (USD Billion)
    3. 2.3. Gold
      1. 2.3.1. Global Gold Precious Metals Market, 2016-2026 (USD Billion)
    4. 2.4. Silver
      1. 2.4.1. Global Silver Precious Metals Market, 2016-2026 (USD Billion)
    5. 2.5. Platinum
      1. 2.5.1. Global Platinum Precious Metals Market, 2016-2026 (USD Billion)
    6. 2.6. Palladium
      1. 2.6.1. Global Palladium Precious Metals Market, 2016-2026 (USD Billion)
    7. 2.7. Others
      1. 2.7.1. Global Others Precious Metals Market, 2016-2026 (USD Billion)
  3. CHAPTER 3. Precious Metals market – By End-User Analysis
    1. 3.1. Global Precious Metals Market – By End-User Overview
    2. 3.2. Global Precious Metals Market Share, by By End-User, 2019&2026 (USD Billion)
    3. 3.3. Individual
      1. 3.3.1. Global Individual Precious Metals Market, 2016-2026 (USD Billion)
    4. 3.4. Broker
      1. 3.4.1. Global Broker Precious Metals Market, 2016-2026 (USD Billion)
  4. CHAPTER 4. Precious Metals market – Regional Analysis
    1. 4.1. Global Precious Metals Market Regional Overview
    2. 4.2. Global Precious Metals Market Share, by Region, 2019&2026 (Value)
    3. 4.3. North America
      1. 4.3.1. North America Precious Metals Market size and forecast, 2016-2026
      2. 4.3.2. North America Precious Metals Market, by Country, 2019&2026 (USD Billion)
      3. 4.3.3. North America Precious Metals Market, by By Type, 2016-2026
        1. 4.3.3.1. North America Precious Metals Market, by By Type, 2016-2026 (USD Billion)
      4. 4.3.4. North America Precious Metals Market, by By End-User, 2016-2026
        1. 4.3.4.1. North America Precious Metals Market, by By End-User, 2016-2026 (USD Billion)
      5. 4.3.5. U.S.
        1. 4.3.5.1. U.S. Market size and forecast, 2016-2026 (USD Billion)
      6. 4.3.6. Canada
        1. 4.3.6.1. Canada Market size and forecast, 2016-2026 (USD Billion)
    4. 4.4. Europe
      1. 4.4.1. Europe Precious Metals Market size and forecast, 2016-2026
      2. 4.4.2. Europe Precious Metals Market, by Country, 2019&2026 (USD Billion)
      3. 4.4.3. Europe Precious Metals Market, by By Type, 2016-2026
        1. 4.4.3.1. Europe Precious Metals Market, by By Type, 2016-2026 (USD Billion)
      4. 4.4.4. Europe Precious Metals Market, by By End-User, 2016-2026
        1. 4.4.4.1. Europe Precious Metals Market, by By End-User, 2016-2026 (USD Billion)
      5. 4.4.5. Germany
        1. 4.4.5.1. Germany Market size and forecast, 2016-2026 (USD Billion)
      6. 4.4.6. France
        1. 4.4.6.1. France Market size and forecast, 2016-2026 (USD Billion)
      7. 4.4.7. U.K.
        1. 4.4.7.1. U.K. Market size and forecast, 2016-2026 (USD Billion)
      8. 4.4.8. Italy
        1. 4.4.8.1. Italy Market size and forecast, 2016-2026 (USD Billion)
      9. 4.4.9. Spain
        1. 4.4.9.1. Spain Market size and forecast, 2016-2026 (USD Billion)
      10. 4.4.10. Rest of Europe
        1. 4.4.10.1. Rest of Europe Market size and forecast, 2016-2026 (USD Billion)
    5. 4.5. Asia Pacific
      1. 4.5.1. Asia Pacific Precious Metals Market size and forecast, 2016-2026
      2. 4.5.2. Asia Pacific Precious Metals Market, by Country, 2019&2026 (USD Billion)
      3. 4.5.3. Asia Pacific Precious Metals Market, by By Type, 2016-2026
        1. 4.5.3.1. Asia Pacific Precious Metals Market, by By Type, 2016-2026 (USD Billion)
      4. 4.5.4. Asia Pacific Precious Metals Market, by By End-User, 2016-2026
        1. 4.5.4.1. Asia Pacific Precious Metals Market, by By End-User, 2016-2026 (USD Billion)
      5. 4.5.5. China
        1. 4.5.5.1. China Market size and forecast, 2016-2026 (USD Billion)
      6. 4.5.6. Japan
        1. 4.5.6.1. Japan Market size and forecast, 2016-2026 (USD Billion)
      7. 4.5.7. India
        1. 4.5.7.1. India Market size and forecast, 2016-2026 (USD Billion)
      8. 4.5.8. South Korea
        1. 4.5.8.1. South Korea Market size and forecast, 2016-2026 (USD Billion)
      9. 4.5.9. South-East Asia
        1. 4.5.9.1. South-East Asia Market size and forecast, 2016-2026 (USD Billion)
      10. 4.5.10. Rest of Asia Pacific
        1. 4.5.10.1. Rest of Asia Pacific Market size and forecast, 2016-2026 (USD Billion)
    6. 4.6. Latin America
      1. 4.6.1. Latin America Precious Metals Market size and forecast, 2016-2026
      2. 4.6.2. Latin America Precious Metals Market, by Country, 2019&2026 (USD Billion)
      3. 4.6.3. Latin America Precious Metals Market, by By Type, 2016-2026
        1. 4.6.3.1. Latin America Precious Metals Market, by By Type, 2016-2026 (USD Billion)
      4. 4.6.4. Latin America Precious Metals Market, by By End-User, 2016-2026
        1. 4.6.4.1. Latin America Precious Metals Market, by By End-User, 2016-2026 (USD Billion)
      5. 4.6.5. Brazil
        1. 4.6.5.1. Brazil Market size and forecast, 2016-2026 (USD Billion)
      6. 4.6.6. Mexico
        1. 4.6.6.1. Mexico Market size and forecast, 2016-2026 (USD Billion)
      7. 4.6.7. Rest of Latin America
        1. 4.6.7.1. Rest of Latin America Market size and forecast, 2016-2026 (USD Billion)
    7. 4.7. The Middle-East and Africa
      1. 4.7.1. The Middle-East and Africa Precious Metals Market size and forecast, 2016-2026
      2. 4.7.2. The Middle-East and Africa Precious Metals Market, by Country, 2019&2026 (USD Billion)
      3. 4.7.3. The Middle-East and Africa Precious Metals Market, by By Type, 2016-2026
        1. 4.7.3.1. The Middle-East and Africa Precious Metals Market, by By Type, 2016-2026 (USD Billion)
      4. 4.7.4. The Middle-East and Africa Precious Metals Market, by By End-User, 2016-2026
        1. 4.7.4.1. The Middle-East and Africa Precious Metals Market, by By End-User, 2016-2026 (USD Billion)
      5. 4.7.5. GCC Countries
        1. 4.7.5.1. GCC Countries Market size and forecast, 2016-2026 (USD Billion)
      6. 4.7.6. South Africa
        1. 4.7.6.1. South Africa Market size and forecast, 2016-2026 (USD Billion)
      7. 4.7.7. Rest of Middle-East Africa
        1. 4.7.7.1. Rest of Middle-East Africa Market size and forecast, 2016-2026 (USD Billion)
  5. CHAPTER 5. Precious Metals market – Competitive Landscape
    1. 5.1. Competitor Market Share – Revenue
    2. 5.2. Market Concentration Rate Analysis, Top 3 and Top 5 Players
    3. 5.3. Strategic Development
      1. 5.3.1. Acquisitions and Mergers
      2. 5.3.2. New Products
      3. 5.3.3. Research & Development Activities
  6. CHAPTER 6. Company Profiles
    1. 6.1. AvaTrade
      1. 6.1.1. Company Overview
      2. 6.1.2. AvaTrade Revenue and Gross Margin
      3. 6.1.3. Product portfolio
      4. 6.1.4. Recent initiatives
    2. 6.2. Plus500 Ltd.
      1. 6.2.1. Company Overview
      2. 6.2.2. Plus500 Ltd. Revenue and Gross Margin
      3. 6.2.3. Product portfolio
      4. 6.2.4. Recent initiatives
    3. 6.3. AxiTrader
      1. 6.3.1. Company Overview
      2. 6.3.2. AxiTrader Revenue and Gross Margin
      3. 6.3.3. Product portfolio
      4. 6.3.4. Recent initiatives
    4. 6.4. EToro Ltd.
      1. 6.4.1. Company Overview
      2. 6.4.2. EToro Ltd. Revenue and Gross Margin
      3. 6.4.3. Product portfolio
      4. 6.4.4. Recent initiatives
      5. 6.5. Forex.com
      6. 6.5.1. Company Overview
        1. 6.5.2. Forex.com Revenue and Gross Margin
      7. 6.5.3. Product portfolio
      8. 6.5.4. Recent initiatives
    5. 6.6. XM Global Limited
      1. 6.6.1. Company Overview
      2. 6.6.2. XM Global Limited Revenue and Gross Margin
      3. 6.6.3. Product portfolio
      4. 6.6.4. Recent initiatives
    6. 6.7. Henyep Capital Markets (HYCM)
      1. 6.7.1. Company Overview
      2. 6.7.2. Henyep Capital Markets (HYCM) Revenue and Gross Margin
      3. 6.7.3. Product portfolio
      4. 6.7.4. Recent initiatives
    7. 6.8. Pepperstone
      1. 6.8.1. Company Overview
      2. 6.8.2. Pepperstone Revenue and Gross Margin
      3. 6.8.3. Product portfolio
      4. 6.8.4. Recent initiatives
    8. 6.9. XTB
      1. 6.9.1. Company Overview
      2. 6.9.2. XTB Revenue and Gross Margin
      3. 6.9.3. Product portfolio
      4. 6.9.4. Recent initiatives
    9. 6.10. Goodwill Wealth Management Private Limited
      1. 6.10.1. Company Overview
      2. 6.10.2. Goodwill Wealth Management Private Limited Revenue and Gross Margin
      3. 6.10.3. Product portfolio
      4. 6.10.4. Recent initiatives
    10. 6.11. iForex
      1. 6.11.1. Company Overview
      2. 6.11.2. iForex Revenue and Gross Margin
      3. 6.11.3. Product portfolio
      4. 6.11.4. Recent initiatives
  7. CHAPTER 7. Precious Metals — Industry Analysis
    1. 7.1. Precious Metals Market – Key Trends
      1. 7.1.1. Market Drivers
      2. 7.1.2. Market Restraints
      3. 7.1.3. Market Opportunities
    2. 7.2. Value Chain Analysis
    3. 7.3. Technology Roadmap and Timeline
    4. 7.4. Precious Metals Market – Attractiveness Analysis
      1. 7.4.1. By By Type
      2. 7.4.2. By By End-User
      3. 7.4.3. By Region
  8. CHAPTER 8. Marketing Strategy Analysis, Distributors
    1. 8.1. Marketing Channel
    2. 8.2. Direct Marketing
    3. 8.3. Indirect Marketing
    4. 8.4. Marketing Channel Development Trend
    5. 8.5. Economic/Political Environmental Change
  9. CHAPTER 9. Report Conclusion
  10. CHAPTER 10. Research Approach & Methodology
    1. 10.1. Report Description
    2. 10.2. Research Scope
    3. 10.3. Research Methodology
      1. 10.3.1. Secondary Research
      2. 10.3.2. Primary Research
      3. 10.3.3. Models
        1. 10.3.3.1. Company Share Analysis Model
        2. 10.3.3.2. Revenue Based Modeling
        3. 10.3.3.3. Research Limitations

        List of Figures

        FIG. 1 Global Precious Metals Market, 2016-2026 (USD Billion)
        FIG. 2 Global Precious Metals Market Share, by By Type, 2019&2026 (USD Billion)
        FIG. 3 Global Gold Precious Metals Market, 2016-2026 (USD Billion)
        FIG. 4 Global Silver Precious Metals Market, 2016-2026 (USD Billion)
        FIG. 5 Global Platinum Precious Metals Market, 2016-2026 (USD Billion)
        FIG. 6 Global Palladium Precious Metals Market, 2016-2026 (USD Billion)
        FIG. 7 Global Others Precious Metals Market, 2016-2026 (USD Billion)
        FIG. 8 Global Precious Metals Market Share, by By End-User, 2019&2026 (USD Billion)
        FIG. 9 Global Individual Precious Metals Market, 2016-2026 (USD Billion)
        FIG. 10 Global Broker Precious Metals Market, 2016-2026 (USD Billion)
        FIG. 11 Global Precious Metals Market Share, by Region, 2019&2026
        FIG. 12 North America Precious Metals Market, 2016-2026
        FIG. 13 U.S. Precious Metals Market, 2016-2026
        FIG. 14 Canada Precious Metals Market, 2016-2026
        FIG. 15 Europe Precious Metals Market, 2016-2026
        FIG. 16 Germany Precious Metals Market, 2016-2026
        FIG. 17 France Precious Metals Market, 2016-2026
        FIG. 18 U.K. Precious Metals Market, 2016-2026
        FIG. 19 Italy Precious Metals Market, 2016-2026
        FIG. 20 Spain Precious Metals Market, 2016-2026
        FIG. 21 Rest of Europe Precious Metals Market, 2016-2026
        FIG. 22 Asia Pacific Precious Metals Market, 2016-2026
        FIG. 23 China Precious Metals Market, 2016-2026
        FIG. 24 Japan Precious Metals Market, 2016-2026
        FIG. 25 India Precious Metals Market, 2016-2026
        FIG. 26 South  Korea Precious Metals Market, 2016-2026
        FIG. 27 South-East Asia Precious Metals Market, 2016-2026
        FIG. 28 Rest of Asia Pacific Precious Metals Market, 2016-2026
        FIG. 29 Latin America Precious Metals Market, 2016-2026
        FIG. 30 Brazil Precious Metals Market, 2016-2026
        FIG. 31 Mexico Precious Metals Market, 2016-2026
        FIG. 32 Rest of Latin America Precious Metals Market, 2016-2026
        FIG. 33 The Middle-East and Africa Precious Metals Market, 2016-2026
        FIG. 34 GCC Countries Precious Metals Market, 2016-2026
        FIG. 35 South Africa Precious Metals Market, 2016-2026
        FIG. 36 Rest of Middle-East Africa Precious Metals Market, 2016-2026
        FIG. 37 Competitor Market Share – Revenue
        FIG. 38 AvaTrade Revenue and Growth Rate
        FIG. 39 AvaTrade Market Share
        FIG. 40 Plus500 Ltd. Revenue and Growth Rate
        FIG. 41 Plus500 Ltd. Market Share
        FIG. 42 AxiTrader Revenue and Growth Rate
        FIG. 43 AxiTrader Market Share
        FIG. 44 EToro Ltd. Revenue and Growth Rate
        FIG. 45 EToro Ltd. Market Share
        FIG. 46 Forex.com Revenue and Growth Rate
        FIG. 47 Forex.com Market Share
        FIG. 48 XM Global Limited Revenue and Growth Rate
        FIG. 49 XM Global Limited Market Share
        FIG. 50 Henyep Capital Markets (HYCM) Revenue and Growth Rate
        FIG. 51 Henyep Capital Markets (HYCM) Market Share
        FIG. 52 Pepperstone Revenue and Growth Rate
        FIG. 53 Pepperstone Market Share
        FIG. 54 XTB Revenue and Growth Rate
        FIG. 55 XTB Market Share
        FIG. 56 Goodwill Wealth Management Private Limited Revenue and Growth Rate
        FIG. 57 Goodwill Wealth Management Private Limited Market Share
        FIG. 58 iForex Revenue and Growth Rate
        FIG. 59 iForex Market Share
        FIG. 60 Market Dynamics
        FIG. 61 Global Precious Metals – Value Chain Analysis
        FIG. 62 Technology Roadmap and Timeline
        FIG. 63 Market Attractiveness Analysis – By By Type
        FIG. 64 Market Attractiveness Analysis – By By End-User
        FIG. 65 Market Attractiveness Analysis – By Region
        FIG. 66 Market Channel
        FIG. 67 Marketing Channel Development Trend
        FIG. 68 Growth in World Gross Product, 2008-2019


        List of Tables

        ABLE 1 Global Precious Metals Market, 2019&2026 (USD Billion)
        TABLE 2 Global Precious Metals market, by By Type, 2016-2026 (USD Billion)
        TABLE 3 Global Precious Metals market, by By End-User, 2016-2026 (USD Billion)
        TABLE 4 Global Precious Metals market, by Region, 2016-2026 (USD Billion)
        TABLE 5 North America Precious Metals Market, by By Type, 2016-2026 (USD Billion)
        TABLE 6 North America Precious Metals Market, by By End-User, 2016-2026 (USD Billion)
        TABLE 7 Europe Precious Metals Market, by By Type, 2016-2026 (USD Billion)
        TABLE 8 Europe Precious Metals Market, by By End-User, 2016-2026 (USD Billion)
        TABLE 9 Asia Pacific Precious Metals Market, by By Type, 2016-2026 (USD Billion)
        TABLE 10 Asia Pacific Precious Metals Market, by By End-User, 2016-2026 (USD Billion)
        TABLE 11 Latin America Precious Metals Market, by By Type, 2016-2026 (USD Billion)
        TABLE 12 Latin America Precious Metals Market, by By End-User, 2016-2026 (USD Billion)
        TABLE 13 The Middle-East and Africa Precious Metals Market, by By Type, 2016-2026 (USD Billion)
        TABLE 14 The Middle-East and Africa Precious Metals Market, by By End-User, 2016-2026 (USD Billion)
        TABLE 15 Global Precious Metals Market - Company Revenue Analysis 2016-2019 (USD Billion)
        TABLE 16 Global Precious Metals Market - Company Revenue Share Analysis 2016-2019
        TABLE 17 Acquisitions and Mergers
        TABLE 18 New Product/Service Launch
        TABLE 19 Research & Development Activities
        TABLE 20 Market Drivers
        TABLE 21 Market Restraints
        TABLE 22 Market Opportunities
         

Industry Major Market Players

  • AvaTrade
  • XM Global Limited
  • XTB
  • Pepperstone
  • AxiTrader
  • EToro Ltd.
  • Forex.com
  • Plus500 Ltd.
  • Henyep Capital Markets (HYCM)
  • Forex 
  • Goodwill Wealth Management Private Limited