Search Market Research Report

Discover Our Latest Reports
Discover Our Featured Reports
Discover Top Selling Reports

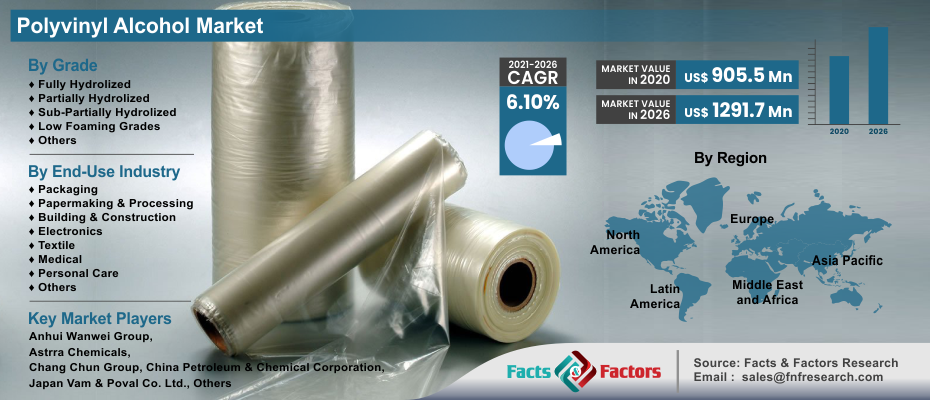
Polyvinyl Alcohol Market Size, Share Global Analysis Report, , 2021 – 2026

report img

Polyvinyl Alcohol Market By Grade Type (Fully Hydrolyzed, Partially Hydrolyzed, Sub-Partially Hydrolyzed, Low Foaming Grades, Others), End-Use Industries (Packaging, Papermaking & Processing, Building & Construction, Electronics, Textile, Medical, Personal Care, Others), By Regional Analysis (North America, Europe, Asia Pacific, Latin America, Middle East and Africa) Global Industry Analysis, Size, Share, Growth, Trends, and Forecast, 2021 – 2026

Industry Insights

[187+ Pages Report] According to a survey released by Facts and Factors, the global polyvinyl alcohol market was valued at USD 905.5 Million in 2020 and is predicted to reach USD 1291.7 Million by the end of 2026, rising at a CAGR of nearly 6.10% between 2021 and 2026.

logoMarket Overview      

Polyvinyl alcohol, a synthetic water-soluble polymer, has long been utilized in formulation processes in a wide range of end-use industries, including food packaging, construction, electronics, coatings, printing, textile, cosmetics, and paper. It's primarily utilized in the food packaging industry since it's a polymer with high water solubility and biodegradability. There are several uses for polyvinyl alcohol, such as in ceramics, textiles, coatings, and papers and wood. Other applications include a variety of different end-uses for the same grade of the product. Since then, PVA sales have increased as a result of this capability. Aside from ethanol, water solubility, and grease, and oil resistance, there are lesser-known product alternatives. Polyvinyl alcohol is widely used in the construction industry for a number of reasons, including enhanced water solubility and particle size, adsorption strength, cement porous solution viscosity, and static cement slurry filtration.

logoIndustry Growth Factors

The rising demand for biodegradable products drives the polyvinyl alcohol business. As the polyvinyl alcohol business grows internationally, some of the most important factors include changing consumer preferences for environmentally-friendly goods, trash disposal, and waste management, as well as increased disposable incomes of consumers and the expansion of various industries. The increased use of polyvinyl alcohol in the electronics industry is expected to drive the worldwide polyvinyl alcohol market in the coming years. The expanding construction sector in many emerging nations across the world has also considerably expanded the application of polyvinyl alcohols, which are utilized in concrete mixes for outstanding adhesive qualities. Significant expansion in the global food and beverage sector, as well as rising demand for biodegradable synthetic polymers for packing solutions, are expected to drive the market over the forecast period.

Polyvinyl Alcohol Market

To know more about this report | Request Free Sample Copy

logoSegmentation Analysis

The global polyvinyl alcohol market is segregated based on grade type, end-use industry, and region. Based on grade type, the global polyvinyl alcohol industry is categorized into fully hydrolyzed, partially hydrolyzed, sub-partially hydrolyzed, low foaming grades, and others. In 2020, partly hydrolyzed grade PVA will dominate the market because of its growing usage in the food and beverage sector uses it as a packing agent in high-moisture foods as a gas barrier and to keep the items' quality and taste. Based on the end-use industry, the global polyvinyl alcohol industry is categorized into packaging, papermaking & processing, building & construction, electronics, textile, medical, personal care, and others. As of 2020, polyvinyl alcohol was mostly used in the building and construction industry. PVA is added to mortar to improve cohesion, fluidity, as well as the drying time of the concrete surface by increasing cohesion and fluidity. Polymerization aid, or the production of other goods using PV alcohol, has been its most common use in nations such as the United States and China. Polyvinyl alcohol is most commonly used as a polymerization aid in China, while PVB is more commonly used in Western Europe and the United States.

logoReport Scope:

Report Attribute

Details

Market Size in 2020

USD 905.5 Million

Projected Market Size in 2026

USD 1291.7 Million

CAGR Growth Rate

6.10%

Base Year

2020

Forecast Years

2021-2026

Key Market Players

Anhui Wanwei Group, Astrra Chemicals, Chang Chun Group, China Petroleum & Chemical Corporation, Japan Vam&Poval Co. Ltd., and Others

Key Segments

Grade Type, End-Use Industry, and Region

Major Regions Covered

North America, Europe, Asia Pacific, Latin America, and Middle East & Africa

Purchase Options

Request customized purchase options to meet your research needs. Explore purchase options

logo Regional Analysis

Asia-Pacific is anticipated to be the largest regional market for polyvinyl alcohol in the world. The product market is being driven by growing demand from end-use industries such as automotive, electrical and electronics, chemicals, healthcare, oil and gas, and home care. India, Indonesia, Vietnam, and other rising economies in the Asia-Pacific area have contributed to the expansion of the construction sector in the region. Due to the increasing attractiveness of these markets, enormous amounts of money have been invested in the industrial and service sectors of these nations. As a result, the need for commercial and residential infrastructures has risen throughout time, resulting in an increase in building projects. Following the lead of the Asia-Pacific market, it is expected that the North American and European markets will grow steadily over the forecast period. The North American and European markets are expected to grow gradually during the forecast period, following the Asia-Pacific market's lead.

logo Competitive Players

Some main participants of the global polyvinyl alcohol market are

  • Anhui Wanwei Group
  • Astrra Chemicals
  • Chang Chun Group
  • China Petroleum & Chemical Corporation
  • Japan Vam&Poval Co. Ltd.
  • Kemipex
  • KURARAY CO. LTD.
  • Nippon Synthetic Chemical Industry Co. Ltd.
  • Merck KGaA
  • OCI Company Ltd.
  • Polysciences Inc.
  • SNP Inc.
  • Sekisui Chemical Co. Ltd.
  • Solutia Inc.(Eastman Chemical Company)

logoBy Grade Type:

  • Fully Hydrolized
  • Partially Hydrolized
  • Sub-Partially Hydrolized
  • Low Foaming Grades
  • Others

logoBy End-Use Industry:

  • Packaging
  • Papermaking & Processing
  • Building & Construction
  • Electronics
  • Textile
  • Medical
  • Personal Care
  • Others

logoBy Region:

  • North America
    • The U.S.
    • Canada
  • Europe
    • France
    • The UK
    • Spain
    • Germany
    • Italy
    • Rest of Europe
  • Asia Pacific
    • China
    • Japan
    • India
    • South Korea
    • Southeast Asia
    • Rest of Asia Pacific
  • Latin America
    • Brazil
    • Mexico
    • Rest of Latin America
  • Middle East & Africa
    • GCC Countries
    • South Africa
    • Rest of Middle East & Africa

Table of Content

  1. Chapter 1 Executive Summary
    1. 1.1. Introduction of Polyvinyl Alcohol
    2. 1.2. Global Polyvinyl Alcohol Market, 2020 & 2026 (USD Million)
    3. 1.3. Global Polyvinyl Alcohol Market, 2016 – 2026 (USD Million) (Kilo Tons)
    4. 1.4. Global Polyvinyl Alcohol Market Absolute Revenue Opportunity, 2016 – 2026 (USD Million)
    5. 1.5. Global Polyvinyl Alcohol Market Incremental Revenue Opportunity, 2020 – 2026 (USD Million)
  2. Chapter 2 Polyvinyl Alcohol Market – Grade Type Analysis
    1. 2.1. Global Polyvinyl Alcohol Market – Grade Type Overview
    2. 2.2. Global Polyvinyl Alcohol Market Share, by Grade Type, 2020 & 2026 (USD Million)
    3. 2.3. Global Polyvinyl Alcohol Market share, by Grade Type, 2020 & 2026 (Kilo Tons)
    4. 2.4. Fully Hydrolyzed
      1. 2.4.1. Global Fully Hydrolyzed Polyvinyl Alcohol Market, 2016 – 2026 (USD Million)
      2. 2.4.2. Global Fully Hydrolyzed Polyvinyl Alcohol Market, 2016 – 2026 (Kilo Tons)
    5. 2.5. Partially Hydrolyzed
      1. 2.5.1. Global Partially Hydrolyzed Polyvinyl Alcohol Market, 2016 – 2026 (USD Million)
      2. 2.5.2. Global Partially Hydrolyzed Polyvinyl Alcohol Market, 2016 – 2026 (Kilo Tons)
    6. 2.6. Sub-Partially Hydrolyzed
      1. 2.6.1. Global Sub-Partially Hydrolyzed Polyvinyl Alcohol Market, 2016 – 2026 (USD Million)
      2. 2.6.2. Global Sub-Partially Hydrolyzed Polyvinyl Alcohol Market, 2016 – 2026 (Kilo Tons)
    7. 2.7. Low Foaming Grades
      1. 2.7.1. Global Low Foaming Grades Polyvinyl Alcohol Market, 2016 – 2026 (USD Million)
      2. 2.7.2. Global Low Foaming Grades Polyvinyl Alcohol Market, 2016 – 2026 (Kilo Tons)
    8. 2.8. Others
      1. 2.8.1. Global Others Polyvinyl Alcohol Market, 2016 – 2026 (USD Million)
      2. 2.8.2. Global Others Polyvinyl Alcohol Market, 2016 – 2026 (Kilo Tons)
  3. Chapter 3 Polyvinyl Alcohol Market – End-Use Industries Analysis
    1. 3.1. Global Polyvinyl Alcohol Market – End-Use Industries Overview
    2. 3.2. Global Polyvinyl Alcohol Market Share, by End-Use Industries, 2020 & 2026 (USD Million)
    3. 3.3. Global Polyvinyl Alcohol Market share, by End-Use Industries, 2020 & 2026 (Kilo Tons)
    4. 3.4. Packaging
      1. 3.4.1. Global Packaging Polyvinyl Alcohol Market, 2016 – 2026 (USD Million)
      2. 3.4.2. Global Packaging Polyvinyl Alcohol Market, 2016 – 2026 (Kilo Tons)
    5. 3.5. Papermaking & Processing
      1. 3.5.1. Global Papermaking & Processing Polyvinyl Alcohol Market, 2016 – 2026 (USD Million)
      2. 3.5.2. Global Papermaking & Processing Polyvinyl Alcohol Market, 2016 – 2026 (Kilo Tons)
    6. 3.6. Building & Construction
      1. 3.6.1. Global Building & Construction Polyvinyl Alcohol Market, 2016 – 2026 (USD Million)
      2. 3.6.2. Global Building & Construction Polyvinyl Alcohol Market, 2016 – 2026 (Kilo Tons)
    7. 3.7. Electronics
      1. 3.7.1. Global Electronics Polyvinyl Alcohol Market, 2016 – 2026 (USD Million)
      2. 3.7.2. Global Electronics Polyvinyl Alcohol Market, 2016 – 2026 (Kilo Tons)
    8. 3.8. Textile
      1. 3.8.1. Global Textile Polyvinyl Alcohol Market, 2016 – 2026 (USD Million)
      2. 3.8.2. Global Textile Polyvinyl Alcohol Market, 2016 – 2026 (Kilo Tons)
    9. 3.9. Medical
      1. 3.9.1. Global Medical Polyvinyl Alcohol Market, 2016 – 2026 (USD Million)
      2. 3.9.2. Global Medical Polyvinyl Alcohol Market, 2016 – 2026 (Kilo Tons)
    10. 3.10. Personal Care
      1. 3.10.1. Global Personal Care Polyvinyl Alcohol Market, 2016 – 2026 (USD Million)
      2. 3.10.2. Global Personal Care Polyvinyl Alcohol Market, 2016 – 2026 (Kilo Tons)
    11. 3.11. Others
      1. 3.11.1. Global Others Polyvinyl Alcohol Market, 2016 – 2026 (USD Million)
      2. 3.11.2. Global Others Polyvinyl Alcohol Market, 2016 – 2026 (Kilo Tons)
  4. Chapter 4 Polyvinyl Alcohol Market – Regional Analysis
    1. 4.1. Global Polyvinyl Alcohol Market Regional Overview
    2. 4.2. Global Polyvinyl Alcohol Market Share, by Region, 2020 & 2026 (USD Million)
    3. 4.3. Global Polyvinyl Alcohol Market Share, by Region, 2020 & 2026 (Kilo Tons)
    4. 4.4. North America
      1. 4.4.1. North America Polyvinyl Alcohol Market, 2016 – 2026 (USD Million)
        1. 4.4.1.1. North America Polyvinyl Alcohol Market, by Country, 2016 – 2026 (USD Million)
      2. 4.4.2. North America Market, 2016 – 2026 (Kilo Tons)
        1. 4.4.2.1. North America Polyvinyl Alcohol Market, by Country, 2016 – 2026 (Kilo Tons)
      3. 4.4.3. North America Polyvinyl Alcohol Market, by Grade Type, 2016 – 2026
        1. 4.4.3.1. North America Polyvinyl Alcohol Market, by Grade Type, 2016 – 2026 (USD Million)
        2. 4.4.3.2. North America Polyvinyl Alcohol Market, by Grade Type, 2016 – 2026 (Kilo Tons)
      4. 4.4.4. North America Polyvinyl Alcohol Market, by End-Use Industries, 2016 – 2026
        1. 4.4.4.1. North America Polyvinyl Alcohol Market, by End-Use Industries, 2016 – 2026 (USD Million)
        2. 4.4.4.2. North America Polyvinyl Alcohol Market, by End-Use Industries, 2016 – 2026 (Kilo Tons)
      5. 4.4.5. U.S.
        1. 4.4.5.1. U.S. Polyvinyl Alcohol Market, 2016 – 2026 (USD Million)
        2. 4.4.5.2. U.S. Polyvinyl Alcohol Market, 2016 – 2026 (Kilo Tons)
      6. 4.4.6. Canada
        1. 4.4.6.1. Canada Polyvinyl Alcohol Market, 2016 – 2026 (USD Million)
        2. 4.4.6.2. Canada Polyvinyl Alcohol Market, 2016 – 2026 (Kilo Tons)
    5. 4.5. Europe
      1. 4.5.1. Europe Polyvinyl Alcohol Market, 2016 – 2026 (USD Million)
        1. 4.5.1.1. Europe Polyvinyl Alcohol Market, by Country, 2016 – 2026 (USD Million)
      2. 4.5.2. Europe Market, 2016 – 2026 (Kilo Tons)
        1. 4.5.2.1. Europe Polyvinyl Alcohol Market, by Country, 2016 – 2026 (Kilo Tons)
      3. 4.5.3. Europe Polyvinyl Alcohol Market, by Grade Type, 2016 – 2026
        1. 4.5.3.1. Europe Polyvinyl Alcohol Market, by Grade Type, 2016 – 2026 (USD Million)
        2. 4.5.3.2. Europe Polyvinyl Alcohol Market, by Grade Type, 2016 – 2026 (Kilo Tons)
      4. 4.5.4. Europe Polyvinyl Alcohol Market, by End-Use Industries, 2016 – 2026
        1. 4.5.4.1. Europe Polyvinyl Alcohol Market, by End-Use Industries, 2016 – 2026 (USD Million)
        2. 4.5.4.2. Europe Polyvinyl Alcohol Market, by End-Use Industries, 2016 – 2026 (Kilo Tons)
      5. 4.5.5. Germany
        1. 4.5.5.1. Germany Polyvinyl Alcohol Market, 2016 – 2026 (USD Million)
        2. 4.5.5.2. Germany Polyvinyl Alcohol Market, 2016 – 2026 (Kilo Tons)
      6. 4.5.6. France
        1. 4.5.6.1. France Polyvinyl Alcohol Market, 2016 – 2026 (USD Million)
        2. 4.5.6.2. France Polyvinyl Alcohol Market, 2016 – 2026 (Kilo Tons)
      7. 4.5.7. U.K.
        1. 4.5.7.1. U.K. Polyvinyl Alcohol Market, 2016 – 2026 (USD Million)
        2. 4.5.7.2. U.K. Polyvinyl Alcohol Market, 2016 – 2026 (Kilo Tons)
      8. 4.5.8. Italy
        1. 4.5.8.1. Italy Polyvinyl Alcohol Market, 2016 – 2026 (USD Million)
        2. 4.5.8.2. Italy Polyvinyl Alcohol Market, 2016 – 2026 (Kilo Tons)
      9. 4.5.9. Spain
        1. 4.5.9.1. Spain Polyvinyl Alcohol Market, 2016 – 2026 (USD Million)
        2. 4.5.9.2. Spain Polyvinyl Alcohol Market, 2016 – 2026 (Kilo Tons)
      10. 4.5.10. Rest of Europe
        1. 4.5.10.1. Rest of Europe Polyvinyl Alcohol Market, 2016 – 2026 (USD Million)
        2. 4.5.10.2. Rest of Europe Polyvinyl Alcohol Market, 2016 – 2026 (Kilo Tons)
    6. 4.6. Asia Pacific
      1. 4.6.1. Asia Pacific Polyvinyl Alcohol Market, 2016 – 2026 (USD Million)
        1. 4.6.1.1. Asia Pacific Polyvinyl Alcohol Market, by Country, 2016 – 2026 (USD Million)
      2. 4.6.2. Asia Pacific Market, 2016 – 2026 (Kilo Tons)
        1. 4.6.2.1. Asia Pacific Polyvinyl Alcohol Market, by Country, 2016 – 2026 (Kilo Tons)
      3. 4.6.3. Asia Pacific Polyvinyl Alcohol Market, by Grade Type, 2016 – 2026
        1. 4.6.3.1. Asia Pacific Polyvinyl Alcohol Market, by Grade Type, 2016 – 2026 (USD Million)
        2. 4.6.3.2. Asia Pacific Polyvinyl Alcohol Market, by Grade Type, 2016 – 2026 (Kilo Tons)
      4. 4.6.4. Asia Pacific Polyvinyl Alcohol Market, by End-Use Industries, 2016 – 2026
        1. 4.6.4.1. Asia Pacific Polyvinyl Alcohol Market, by End-Use Industries, 2016 – 2026 (USD Million)
        2. 4.6.4.2. Asia Pacific Polyvinyl Alcohol Market, by End-Use Industries, 2016 – 2026 (Kilo Tons)
      5. 4.6.5. China
        1. 4.6.5.1. China Polyvinyl Alcohol Market, 2016 – 2026 (USD Million)
        2. 4.6.5.2. China Polyvinyl Alcohol Market, 2016 – 2026 (Kilo Tons)
      6. 4.6.6. Japan
        1. 4.6.6.1. Japan Polyvinyl Alcohol Market, 2016 – 2026 (USD Million)
        2. 4.6.6.2. Japan Polyvinyl Alcohol Market, 2016 – 2026 (Kilo Tons)
      7. 4.6.7. India
        1. 4.6.7.1. India Polyvinyl Alcohol Market, 2016 – 2026 (USD Million)
        2. 4.6.7.2. India Polyvinyl Alcohol Market, 2016 – 2026 (Kilo Tons)
      8. 4.6.8. South Korea
        1. 4.6.8.1. South Korea Polyvinyl Alcohol Market, 2016 – 2026 (USD Million)
        2. 4.6.8.2. South Korea Polyvinyl Alcohol Market, 2016 – 2026 (Kilo Tons)
      9. 4.6.9. South-East Asia
        1. 4.6.9.1. South-East Asia Polyvinyl Alcohol Market, 2016 – 2026 (USD Million)
        2. 4.6.9.2. South-East Asia Polyvinyl Alcohol Market, 2016 – 2026 (Kilo Tons)
      10. 4.6.10. Rest of Asia Pacific
        1. 4.6.10.1. Rest of Asia Pacific Polyvinyl Alcohol Market, 2016 – 2026 (USD Million)
        2. 4.6.10.2. Rest of Asia Pacific Polyvinyl Alcohol Market, 2016 – 2026 (Kilo Tons)
    7. 4.7. Latin America
      1. 4.7.1. Latin America Polyvinyl Alcohol Market, 2016 – 2026 (USD Million)
        1. 4.7.1.1. Latin America Polyvinyl Alcohol Market, by Country, 2016 – 2026 (USD Million)
      2. 4.7.2. Latin America Market, 2016 – 2026 (Kilo Tons)
        1. 4.7.2.1. Latin America Polyvinyl Alcohol Market, by Country, 2016 – 2026 (Kilo Tons)
      3. 4.7.3. Latin America Polyvinyl Alcohol Market, by Grade Type, 2016 – 2026
        1. 4.7.3.1. Latin America Polyvinyl Alcohol Market, by Grade Type, 2016 – 2026 (USD Million)
        2. 4.7.3.2. Latin America Polyvinyl Alcohol Market, by Grade Type, 2016 – 2026 (Kilo Tons)
      4. 4.7.4. Latin America Polyvinyl Alcohol Market, by End-Use Industries, 2016 – 2026
        1. 4.7.4.1. Latin America Polyvinyl Alcohol Market, by End-Use Industries, 2016 – 2026 (USD Million)
        2. 4.7.4.2. Latin America Polyvinyl Alcohol Market, by End-Use Industries, 2016 – 2026 (Kilo Tons)
      5. 4.7.5. Brazil
        1. 4.7.5.1. Brazil Polyvinyl Alcohol Market, 2016 – 2026 (USD Million)
        2. 4.7.5.2. Brazil Polyvinyl Alcohol Market, 2016 – 2026 (Kilo Tons)
      6. 4.7.6. Mexico
        1. 4.7.6.1. Mexico Polyvinyl Alcohol Market, 2016 – 2026 (USD Million)
        2. 4.7.6.2. Mexico Polyvinyl Alcohol Market, 2016 – 2026 (Kilo Tons)
      7. 4.7.7. Rest of Latin America
        1. 4.7.7.1. Rest of Latin America Polyvinyl Alcohol Market, 2016 – 2026 (USD Million)
        2. 4.7.7.2. Rest of Latin America Polyvinyl Alcohol Market, 2016 – 2026 (Kilo Tons)
    8. 4.8. The Middle-East and Africa
      1. 4.8.1. The Middle-East and Africa Polyvinyl Alcohol Market, 2016 – 2026 (USD Million)
        1. 4.8.1.1. The Middle-East and Africa Polyvinyl Alcohol Market, by Country, 2016 – 2026 (USD Million)
      2. 4.8.2. The Middle-East and Africa Market, 2016 – 2026 (Kilo Tons)
        1. 4.8.2.1. The Middle-East and Africa Polyvinyl Alcohol Market, by Country, 2016 – 2026 (Kilo Tons)
      3. 4.8.3. The Middle-East and Africa Polyvinyl Alcohol Market, by Grade Type, 2016 – 2026
        1. 4.8.3.1. The Middle-East and Africa Polyvinyl Alcohol Market, by Grade Type, 2016 – 2026 (USD Million)
        2. 4.8.3.2. The Middle-East and Africa Polyvinyl Alcohol Market, by Grade Type, 2016 – 2026 (Kilo Tons)
      4. 4.8.4. The Middle-East and Africa Polyvinyl Alcohol Market, by End-Use Industries, 2016 – 2026
        1. 4.8.4.1. The Middle-East and Africa Polyvinyl Alcohol Market, by End-Use Industries, 2016 – 2026 (USD Million)
        2. 4.8.4.2. The Middle-East and Africa Polyvinyl Alcohol Market, by End-Use Industries, 2016 – 2026 (Kilo Tons)
      5. 4.8.5. GCC Countries
        1. 4.8.5.1. GCC Countries Polyvinyl Alcohol Market, 2016 – 2026 (USD Million)
        2. 4.8.5.2. GCC Countries Polyvinyl Alcohol Market, 2016 – 2026 (Kilo Tons)
      6. 4.8.6. South Africa
        1. 4.8.6.1. South Africa Polyvinyl Alcohol Market, 2016 – 2026 (USD Million)
        2. 4.8.6.2. South Africa Polyvinyl Alcohol Market, 2016 – 2026 (Kilo Tons)
      7. 4.8.7. Rest of Middle-East Africa
        1. 4.8.7.1. Rest of Middle-East Africa Polyvinyl Alcohol Market, 2016 – 2026 (USD Million)
        2. 4.8.7.2. Rest of Middle-East Africa Polyvinyl Alcohol Market, 2016 – 2026 (Kilo Tons)
  5. Chapter 5 Polyvinyl Alcohol Production, Consumption, Export, Import by Regions
    1. 5.1. Global Polyvinyl Alcohol Production and Consumption, 2016 – 2026 (Kilo Tons)
    2. 5.2. Global Import and Export Analysis, by Region
  6. Chapter 6 Polyvinyl Alcohol Market – Competitive Landscape
    1. 6.1. Competitor Market Share – Revenue
    2. 6.2. Market Concentration Rate Analysis, Top 3 and Top 5 Players
    3. 6.3. Competitor Market Share – Volume
    4. 6.4. Strategic Developments
      1. 6.4.1. Acquisitions and Mergers
      2. 6.4.2. New Products
      3. 6.4.3. Research & Development Activities
  7. Chapter 7 Company Profiles
    1. 7.1. Anhui Wanwei Group
      1. 7.1.1. Company Overview
      2. 7.1.2. Product/Service Portfolio
      3. 7.1.3. Anhui Wanwei Group Sales, Revenue, Price, and Gross Margin
      4. 7.1.4. Anhui Wanwei Group Revenue and Growth Rate
      5. 7.1.5. Anhui Wanwei Group Market Share
      6. 7.1.6. Recent Initiatives, Funding/VC Activities, and Technological Innovations
    2. 7.2. Astrra Chemicals
      1. 7.2.1. Company Overview
      2. 7.2.2. Product/Service Portfolio
      3. 7.2.3. Astrra Chemicals Sales, Revenue, Price, and Gross Margin
      4. 7.2.4. Astrra Chemicals Revenue and Growth Rate
      5. 7.2.5. Astrra Chemicals Market Share
      6. 7.2.6. Recent Initiatives, Funding/VC Activities, and Technological Innovations
    3. 7.3. Chang Chun Group.
      1. 7.3.1. Company Overview
      2. 7.3.2. Product/Service Portfolio
      3. 7.3.3. Chang Chun Group. Sales, Revenue, Price, and Gross Margin
      4. 7.3.4. Chang Chun Group. Revenue and Growth Rate
      5. 7.3.5. Chang Chun Group. Market Share
      6. 7.3.6. Recent Initiatives, Funding/VC Activities, and Technological Innovations
    4. 7.4. China Petroleum & Chemical Corporation
      1. 7.4.1. Company Overview
      2. 7.4.2. Product/Service Portfolio
      3. 7.4.3. China Petroleum & Chemical Corporation Sales, Revenue, Price, and Gross Margin
      4. 7.4.4. China Petroleum & Chemical Corporation Revenue and Growth Rate
      5. 7.4.5. China Petroleum & Chemical Corporation Market Share
      6. 7.4.6. Recent Initiatives, Funding/VC Activities, and Technological Innovations
    5. 7.5. Japan Vam & Poval Co. Ltd.
      1. 7.5.1. Company Overview
      2. 7.5.2. Product/Service Portfolio
      3. 7.5.3. Japan Vam & Poval Co. Ltd. Sales, Revenue, Price, and Gross Margin
      4. 7.5.4. Japan Vam & Poval Co. Ltd. Revenue and Growth Rate
      5. 7.5.5. Japan Vam & Poval Co. Ltd. Market Share
      6. 7.5.6. Recent Initiatives, Funding/VC Activities, and Technological Innovations
    6. 7.6. Kemipex
      1. 7.6.1. Company Overview
      2. 7.6.2. Product/Service Portfolio
      3. 7.6.3. Kemipex Sales, Revenue, Price, and Gross Margin
      4. 7.6.4. Kemipex Revenue and Growth Rate
      5. 7.6.5. Kemipex Market Share
      6. 7.6.6. Recent Initiatives, Funding/VC Activities, and Technological Innovations
    7. 7.7. KURARAY CO. LTD.
      1. 7.7.1. Company Overview
      2. 7.7.2. Product/Service Portfolio
      3. 7.7.3. KURARAY CO. LTD. Sales, Revenue, Price, and Gross Margin
      4. 7.7.4. KURARAY CO. LTD. Revenue and Growth Rate
      5. 7.7.5. KURARAY CO. LTD. Market Share
      6. 7.7.6. Recent Initiatives, Funding/VC Activities, and Technological Innovations
    8. 7.8. Merck KGaA
      1. 7.8.1. Company Overview
      2. 7.8.2. Product/Service Portfolio
      3. 7.8.3. Merck KGaA Sales, Revenue, Price, and Gross Margin
      4. 7.8.4. Merck KGaA Revenue and Growth Rate
      5. 7.8.5. Merck KGaA Market Share
      6. 7.8.6. Recent Initiatives, Funding/VC Activities, and Technological Innovations
    9. 7.9. Nippon Synthetic Chemical Industry Co. Ltd.
      1. 7.9.1. Company Overview
      2. 7.9.2. Product/Service Portfolio
      3. 7.9.3. Nippon Synthetic Chemical Industry Co. Ltd. Sales, Revenue, Price, and Gross Margin
      4. 7.9.4. Nippon Synthetic Chemical Industry Co. Ltd. Revenue and Growth Rate
      5. 7.9.5. Nippon Synthetic Chemical Industry Co. Ltd. Market Share
      6. 7.9.6. Recent Initiatives, Funding/VC Activities, and Technological Innovations
    10. 7.10. OCI Company Ltd.
      1. 7.10.1. Company Overview
      2. 7.10.2. Product/Service Portfolio
      3. 7.10.3. OCI Company Ltd. Sales, Revenue, Price, and Gross Margin
      4. 7.10.4. OCI Company Ltd. Revenue and Growth Rate
      5. 7.10.5. OCI Company Ltd. Market Share
      6. 7.10.6. Recent Initiatives, Funding/VC Activities, and Technological Innovations
    11. 7.11. Polysciences Inc.
      1. 7.11.1. Company Overview
      2. 7.11.2. Product/Service Portfolio
      3. 7.11.3. Polysciences Inc. Sales, Revenue, Price, and Gross Margin
      4. 7.11.4. Polysciences Inc. Revenue and Growth Rate
      5. 7.11.5. Polysciences Inc. Market Share
      6. 7.11.6. Recent Initiatives, Funding/VC Activities, and Technological Innovations
    12. 7.12. Sekisui Chemical Co. Ltd.
      1. 7.12.1. Company Overview
      2. 7.12.2. Product/Service Portfolio
      3. 7.12.3. Sekisui Chemical Co. Ltd. Sales, Revenue, Price, and Gross Margin
      4. 7.12.4. Sekisui Chemical Co. Ltd. Revenue and Growth Rate
      5. 7.12.5. Sekisui Chemical Co. Ltd. Market Share
      6. 7.12.6. Recent Initiatives, Funding/VC Activities, and Technological Innovations
    13. 7.13. SNP, Inc.
      1. 7.13.1. Company Overview
      2. 7.13.2. Product/Service Portfolio
      3. 7.13.3. SNP, Inc. Sales, Revenue, Price, and Gross Margin
      4. 7.13.4. SNP, Inc. Revenue and Growth Rate
      5. 7.13.5. SNP, Inc. Market Share
      6. 7.13.6. Recent Initiatives, Funding/VC Activities, and Technological Innovations
    14. 7.14. Solutia Inc. (Eastman Chemical Company)
      1. 7.14.1. Company Overview
      2. 7.14.2. Product/Service Portfolio
      3. 7.14.3. Solutia Inc. (Eastman Chemical Company) Sales, Revenue, Price, and Gross Margin
      4. 7.14.4. Solutia Inc. (Eastman Chemical Company) Revenue and Growth Rate
      5. 7.14.5. Solutia Inc. (Eastman Chemical Company) Market Share
      6. 7.14.6. Recent Initiatives, Funding/VC Activities, and Technological Innovations
  8. Chapter 8 Polyvinyl Alcohol — Industry Analysis
    1. 8.1. Introduction and Taxonomy
    2. 8.2. Polyvinyl Alcohol Market – Key Trends
      1. 8.2.1. Market Drivers
      2. 8.2.2. Market Restraints
      3. 8.2.3. Market Opportunities
    3. 8.3. Value Chain Analysis
    4. 8.4. Key Mandates and Regulations
    5. 8.5. Technology Roadmap and Timeline
    6. 8.6. Polyvinyl Alcohol Market – Attractiveness Analysis
      1. 8.6.1. By Grade Type
      2. 8.6.2. By End-Use Industries
      3. 8.6.3. By Region
  9. Chapter 9 Raw Material Analysis
    1. 9.1. Polyvinyl Alcohol Key Raw Material Analysis
      1. 9.1.1. Key Raw Materials
      2. 9.1.2. Price Trend of Key Raw Materials
    2. 9.2. Key Suppliers of Raw Materials
    3. 9.3. Proportion of Manufacturing Cost Structure
      1. 9.3.1. Raw Materials Cost
      2. 9.3.2. Labor Cost
      3. 9.3.3. Manufacturing Expenses
      4. 9.3.4. Miscellaneous Expenses
    4. 9.4. Manufacturing Cost Analysis of Polyvinyl Alcohol
  10. Chapter 10 Industrial Chain, Sourcing Strategy, and Downstream Buyers
    1. 10.1. Polyvinyl Alcohol Industrial Chain Analysis
    2. 10.2. Upstream Raw Materials Sourcing
      1. 10.2.1. Risk Mitigation:
      2. 10.2.2. Supplier Relationships:
      3. 10.2.3. Business Processes:
      4. 10.2.4. Securing the Product:
    3. 10.3. Raw Materials Sources of Polyvinyl Alcohol Major Manufacturers
    4. 10.4. Downstream Buyers
    5. 10.5. Distributors/Traders List
  11. Chapter 11 Marketing Strategy Analysis, Distributors
    1. 11.1. Marketing Channel
    2. 11.2. Direct Marketing
    3. 11.3. Indirect Marketing
    4. 11.4. Marketing Channel Development Trends
    5. 11.5. Economic/Political Environmental Change
  12. Chapter 12 Report Conclusion & Key Insights
    1. 12.1. Key Insights from Primary Interviews & Surveys Respondents
    2. 12.2. Key Takeaways from Analysts, Consultants, and Industry Leaders
  13. Chapter 13 Research Approach & Methodology
    1. 13.1. Report Description
    2. 13.2. Research Scope
    3. 13.3. Research Methodology
      1. 13.3.1. Secondary Research
      2. 13.3.2. Primary Research
      3. 13.3.3. Statistical Models
        1. 13.3.3.1. Company Share Analysis Model
        2. 13.3.3.2. Revenue Based Modeling
      4. 13.3.4. Research Limitations

      List of Figures

      Fig.1	Product Picture of Polyvinyl Alcohol
      Fig.2	Global Polyvinyl Alcohol Market, 2016 – 2026 (USD Million)
      Fig.3	Global Polyvinyl Alcohol Market, 2016 – 2026 (Kilo Tons)
      Fig.4	Global Polyvinyl Alcohol Market Absolute Revenue Opportunity, 2016 – 2026 (USD Million)
      Fig.5	Global Polyvinyl Alcohol Market Incremental Revenue Opportunity, 2020 – 2026 (USD Million)
      Fig.6	Global Polyvinyl Alcohol Market Share, by Grade Type, 2020 & 2026 (USD Million)
      Fig.7	Global Polyvinyl Alcohol Market Share, by Grade Type, 2020 & 2026 (Kilo Tons)
      Fig.8	Global Fully Hydrolyzed Polyvinyl Alcohol Market, 2016 – 2026 (USD Million)
      Fig.9	Global Fully Hydrolyzed Polyvinyl Alcohol Market, 2016 – 2026 (Kilo Tons)
      Fig.10	Global Partially Hydrolyzed Polyvinyl Alcohol Market, 2016 – 2026 (USD Million)
      Fig.11	Global Partially Hydrolyzed Polyvinyl Alcohol Market, 2016 – 2026 (Kilo Tons)
      Fig.12	Global Sub-Partially Hydrolyzed Polyvinyl Alcohol Market, 2016 – 2026 (USD Million)
      Fig.13	Global Sub-Partially Hydrolyzed Polyvinyl Alcohol Market, 2016 – 2026 (Kilo Tons)
      Fig.14	Global Low Foaming Grades Polyvinyl Alcohol Market, 2016 – 2026 (USD Million)
      Fig.15	Global Low Foaming Grades Polyvinyl Alcohol Market, 2016 – 2026 (Kilo Tons)
      Fig.16	Global Others Polyvinyl Alcohol Market, 2016 – 2026 (USD Million)
      Fig.17	Global Others Polyvinyl Alcohol Market, 2016 – 2026 (Kilo Tons)
      Fig.18	Global Polyvinyl Alcohol Market Share, by End-Use Industries, 2020 & 2026 (USD Million)
      Fig.19	Global Polyvinyl Alcohol Market Share, by End-Use Industries, 2020 & 2026 (Kilo Tons)
      Fig.20	Global Packaging Polyvinyl Alcohol Market, 2016 – 2026 (USD Million)
      Fig.21	Global Packaging Polyvinyl Alcohol Market, 2016 – 2026 (Kilo Tons)
      Fig.22	Global Papermaking & Processing Polyvinyl Alcohol Market, 2016 – 2026 (USD Million)
      Fig.23	Global Papermaking & Processing Polyvinyl Alcohol Market, 2016 – 2026 (Kilo Tons)
      Fig.24	Global Building & Construction Polyvinyl Alcohol Market, 2016 – 2026 (USD Million)
      Fig.25	Global Building & Construction Polyvinyl Alcohol Market, 2016 – 2026 (Kilo Tons)
      Fig.26	Global Electronics Polyvinyl Alcohol Market, 2016 – 2026 (USD Million)
      Fig.27	Global Electronics Polyvinyl Alcohol Market, 2016 – 2026 (Kilo Tons)
      Fig.28	Global Textile Polyvinyl Alcohol Market, 2016 – 2026 (USD Million)
      Fig.29	Global Textile Polyvinyl Alcohol Market, 2016 – 2026 (Kilo Tons)
      Fig.30	Global Medical Polyvinyl Alcohol Market, 2016 – 2026 (USD Million)
      Fig.31	Global Medical Polyvinyl Alcohol Market, 2016 – 2026 (Kilo Tons)
      Fig.32	Global Personal Care Polyvinyl Alcohol Market, 2016 – 2026 (USD Million)
      Fig.33	Global Personal Care Polyvinyl Alcohol Market, 2016 – 2026 (Kilo Tons)
      Fig.34	Global Others Polyvinyl Alcohol Market, 2016 – 2026 (USD Million)
      Fig.35	Global Others Polyvinyl Alcohol Market, 2016 – 2026 (Kilo Tons)
      Fig.36	Global Polyvinyl Alcohol Market Share, by Region, 2020 & 2026 (USD Million)
      Fig.37	Global Polyvinyl Alcohol Market Share, by Region, 2020 & 2026 (Kilo Tons)
      Fig.38	North America Polyvinyl Alcohol Market, 2016 – 2026 (USD Million)
      Fig.39	North America Polyvinyl Alcohol Market, 2016 – 2026 (Kilo Tons)
      Fig.40	U.S. Polyvinyl Alcohol Market, 2016 – 2026 (USD Million)
      Fig.41	U.S. Polyvinyl Alcohol  Market, 2016 – 2026 (Kilo Tons)
      Fig.42	Canada Polyvinyl Alcohol Market, 2016 – 2026 (USD Million)
      Fig.43	Canada Polyvinyl Alcohol  Market, 2016 – 2026 (Kilo Tons)
      Fig.44	Europe Polyvinyl Alcohol Market, 2016 – 2026 (USD Million)
      Fig.45	Europe Polyvinyl Alcohol Market, 2016 – 2026 (Kilo Tons)
      Fig.46	Germany Polyvinyl Alcohol Market, 2016 – 2026 (USD Million)
      Fig.47	Germany Polyvinyl Alcohol  Market, 2016 – 2026 (Kilo Tons)
      Fig.48	France Polyvinyl Alcohol Market, 2016 – 2026 (USD Million)
      Fig.49	France Polyvinyl Alcohol  Market, 2016 – 2026 (Kilo Tons)
      Fig.50	U.K. Polyvinyl Alcohol Market, 2016 – 2026 (USD Million)
      Fig.51	U.K. Polyvinyl Alcohol  Market, 2016 – 2026 (Kilo Tons)
      Fig.52	Italy Polyvinyl Alcohol Market, 2016 – 2026 (USD Million)
      Fig.53	Italy Polyvinyl Alcohol  Market, 2016 – 2026 (Kilo Tons)
      Fig.54	Spain Polyvinyl Alcohol Market, 2016 – 2026 (USD Million)
      Fig.55	Spain Polyvinyl Alcohol  Market, 2016 – 2026 (Kilo Tons)
      Fig.56	Rest of Europe Polyvinyl Alcohol Market, 2016 – 2026 (USD Million)
      Fig.57	Rest of Europe Polyvinyl Alcohol  Market, 2016 – 2026 (Kilo Tons)
      Fig.58	Asia Pacific Polyvinyl Alcohol Market, 2016 – 2026 (USD Million)
      Fig.59	Asia Pacific Polyvinyl Alcohol Market, 2016 – 2026 (Kilo Tons)
      Fig.60	China Polyvinyl Alcohol Market, 2016 – 2026 (USD Million)
      Fig.61	China Polyvinyl Alcohol  Market, 2016 – 2026 (Kilo Tons)
      Fig.62	Japan Polyvinyl Alcohol Market, 2016 – 2026 (USD Million)
      Fig.63	Japan Polyvinyl Alcohol  Market, 2016 – 2026 (Kilo Tons)
      Fig.64	India Polyvinyl Alcohol Market, 2016 – 2026 (USD Million)
      Fig.65	India Polyvinyl Alcohol  Market, 2016 – 2026 (Kilo Tons)
      Fig.66	South  Korea Polyvinyl Alcohol Market, 2016 – 2026 (USD Million)
      Fig.67	South  Korea Polyvinyl Alcohol  Market, 2016 – 2026 (Kilo Tons)
      Fig.68	South-East Asia Polyvinyl Alcohol Market, 2016 – 2026 (USD Million)
      Fig.69	South-East Asia Polyvinyl Alcohol  Market, 2016 – 2026 (Kilo Tons)
      Fig.70	Rest of Asia Pacific Polyvinyl Alcohol Market, 2016 – 2026 (USD Million)
      Fig.71	Rest of Asia Pacific Polyvinyl Alcohol  Market, 2016 – 2026 (Kilo Tons)
      Fig.72	Latin America Polyvinyl Alcohol Market, 2016 – 2026 (USD Million)
      Fig.73	Latin America Polyvinyl Alcohol Market, 2016 – 2026 (Kilo Tons)
      Fig.74	Brazil Polyvinyl Alcohol Market, 2016 – 2026 (USD Million)
      Fig.75	Brazil Polyvinyl Alcohol  Market, 2016 – 2026 (Kilo Tons)
      Fig.76	Mexico Polyvinyl Alcohol Market, 2016 – 2026 (USD Million)
      Fig.77	Mexico Polyvinyl Alcohol  Market, 2016 – 2026 (Kilo Tons)
      Fig.78	Rest of Latin America Polyvinyl Alcohol Market, 2016 – 2026 (USD Million)
      Fig.79	Rest of Latin America Polyvinyl Alcohol  Market, 2016 – 2026 (Kilo Tons)
      Fig.80	The Middle-East and Africa Polyvinyl Alcohol Market, 2016 – 2026 (USD Million)
      Fig.81	The Middle-East and Africa Polyvinyl Alcohol Market, 2016 – 2026 (Kilo Tons)
      Fig.82	GCC Countries Polyvinyl Alcohol Market, 2016 – 2026 (USD Million)
      Fig.83	GCC Countries Polyvinyl Alcohol  Market, 2016 – 2026 (Kilo Tons)
      Fig.84	South Africa Polyvinyl Alcohol Market, 2016 – 2026 (USD Million)
      Fig.85	South Africa Polyvinyl Alcohol  Market, 2016 – 2026 (Kilo Tons)
      Fig.86	Rest of Middle-East Africa Polyvinyl Alcohol Market, 2016 – 2026 (USD Million)
      Fig.87	Rest of Middle-East Africa Polyvinyl Alcohol  Market, 2016 – 2026 (Kilo Tons)
      Fig.88	Global Polyvinyl Alcohol Production and Consumption, 2016 – 2026 (Kilo Tons)
      Fig.89	North America Polyvinyl Alcohol Production and Consumption, 2016 – 2026 (USD Million) (Kilo Tons)
      Fig.90	Europe Polyvinyl Alcohol Production and Consumption, 2016 – 2026 (USD Million) (Kilo Tons)
      Fig.91	Asia Pacific Polyvinyl Alcohol Production and Consumption, 2016 – 2026 (USD Million) (Kilo Tons)
      Fig.92	Latin America Polyvinyl Alcohol Production and Consumption, 2016 – 2026 (USD Million) (Kilo Tons)
      Fig.93	The Middle-East and Africa Polyvinyl Alcohol Production and Consumption, 2016 – 2026 (USD Million) (Kilo Tons)
      Fig.94	Competitor Market Share – Revenue
      Fig.95	Competitor Market Share – Volume
      Fig.96	Anhui Wanwei Group Revenue and Growth Rate
      Fig.97	Anhui Wanwei Group Market Share
      Fig.98	Astrra Chemicals Revenue and Growth Rate
      Fig.99	Astrra Chemicals Market Share
      Fig.100	Chang Chun Group. Revenue and Growth Rate
      Fig.101	Chang Chun Group. Market Share
      Fig.102	China Petroleum & Chemical Corporation Revenue and Growth Rate
      Fig.103	China Petroleum & Chemical Corporation Market Share
      Fig.104	Japan Vam & Poval Co. Ltd. Revenue and Growth Rate
      Fig.105	Japan Vam & Poval Co. Ltd. Market Share
      Fig.106	Kemipex Revenue and Growth Rate
      Fig.107	Kemipex Market Share
      Fig.108	KURARAY CO. LTD. Revenue and Growth Rate
      Fig.109	KURARAY CO. LTD. Market Share
      Fig.110	Merck KGaA Revenue and Growth Rate
      Fig.111	Merck KGaA Market Share
      Fig.112	Nippon Synthetic Chemical Industry Co. Ltd. Revenue and Growth Rate
      Fig.113	Nippon Synthetic Chemical Industry Co. Ltd. Market Share
      Fig.114	OCI Company Ltd. Revenue and Growth Rate
      Fig.115	OCI Company Ltd. Market Share
      Fig.116	Polysciences Inc. Revenue and Growth Rate
      Fig.117	Polysciences Inc. Market Share
      Fig.118	Sekisui Chemical Co. Ltd. Revenue and Growth Rate
      Fig.119	Sekisui Chemical Co. Ltd. Market Share
      Fig.120	SNP, Inc. Revenue and Growth Rate
      Fig.121	SNP, Inc. Market Share
      Fig.122	Solutia Inc. (Eastman Chemical Company) Revenue and Growth Rate
      Fig.123	Solutia Inc. (Eastman Chemical Company) Market Share
      Fig.124	Market Dynamics
      Fig.125	Global Polyvinyl Alcohol – Value Chain Analysis
      Fig.126	Key Mandates and Regulations
      Fig.127	Technology Roadmap and Timeline
      Fig.128	Market Attractiveness Analysis – By Grade Type
      Fig.129	Market Attractiveness Analysis – By End-Use Industries
      Fig.130	Market Attractiveness Analysis – By Region
      Fig.131	Manufacturing Cost Structure of Polyvinyl Alcohol
      Fig.132	Polyvinyl Alcohol Industrial Chain Analysis
      Fig.133	Market Channels
      Fig.134	Marketing Channel Development Trend
      Fig.135	Growth in World Gross Product, 2008-2018
      

      List of Tables

      Table 1	Global Polyvinyl Alcohol Market, 2020 & 2026 (USD Million)
      Table 2	Global Polyvinyl Alcohol Market, by Grade Type, 2016 – 2026 (USD Million)
      Table 3	Global Polyvinyl Alcohol Market, by Grade Type, 2016 – 2026 (Kilo Tons)
      Table 4	Global Polyvinyl Alcohol Market, by End-Use Industries, 2016 – 2026 (USD Million)
      Table 5	Global Polyvinyl Alcohol Market, by End-Use Industries, 2016 – 2026 (Kilo Tons)
      Table 6	Global Polyvinyl Alcohol Market, by Region, 2016 – 2026 (USD Million)
      Table 7	Global Polyvinyl Alcohol Market, by Region, 2016 – 2026 (Kilo Tons)
      Table 8	North America Polyvinyl Alcohol Market, by Country, 2016 – 2026 (USD Million)
      Table 9	North America Polyvinyl Alcohol Market, by Country, 2016 – 2026 (Kilo Tons)
      Table 10 North America Polyvinyl Alcohol Market, by Grade Type, 2016 – 2026 (USD Million)
      Table 11 North America Polyvinyl Alcohol Market, by Grade Type, 2016 – 2026 (Kilo Tons)
      Table 12 North America Polyvinyl Alcohol Market, by End-Use Industries, 2016 – 2026 (USD Million)
      Table 13 North America Polyvinyl Alcohol Market, by End-Use Industries, 2016 – 2026 (Kilo Tons)
      Table 14 Europe Polyvinyl Alcohol Market, by Country, 2016 – 2026 (USD Million)
      Table 15 Europe Polyvinyl Alcohol Market, by Country, 2016 – 2026 (Kilo Tons)
      Table 16 Europe Polyvinyl Alcohol Market, by Grade Type, 2016 – 2026 (USD Million)
      Table 17 Europe Polyvinyl Alcohol Market, by Grade Type, 2016 – 2026 (Kilo Tons)
      Table 18 Europe Polyvinyl Alcohol Market, by End-Use Industries, 2016 – 2026 (USD Million)
      Table 19 Europe Polyvinyl Alcohol Market, by End-Use Industries, 2016 – 2026 (Kilo Tons)
      Table 20 Asia Pacific Polyvinyl Alcohol Market, by Country, 2016 – 2026 (USD Million)
      Table 21 Asia Pacific Polyvinyl Alcohol Market, by Country, 2016 – 2026 (Kilo Tons)
      Table 22 Asia Pacific Polyvinyl Alcohol Market, by Grade Type, 2016 – 2026 (USD Million)
      Table 23 Asia Pacific Polyvinyl Alcohol Market, by Grade Type, 2016 – 2026 (Kilo Tons)
      Table 24 Asia Pacific Polyvinyl Alcohol Market, by End-Use Industries, 2016 – 2026 (USD Million)
      Table 25 Asia Pacific Polyvinyl Alcohol Market, by End-Use Industries, 2016 – 2026 (Kilo Tons)
      Table 26 Latin America Polyvinyl Alcohol Market, by Country, 2016 – 2026 (USD Million)
      Table 27 Latin America Polyvinyl Alcohol Market, by Country, 2016 – 2026 (Kilo Tons)
      Table 28 Latin America Polyvinyl Alcohol Market, by Grade Type, 2016 – 2026 (USD Million)
      Table 29 Latin America Polyvinyl Alcohol Market, by Grade Type, 2016 – 2026 (Kilo Tons)
      Table 30 Latin America Polyvinyl Alcohol Market, by End-Use Industries, 2016 – 2026 (USD Million)
      Table 31 Latin America Polyvinyl Alcohol Market, by End-Use Industries, 2016 – 2026 (Kilo Tons)
      Table 32 The Middle-East and Africa Polyvinyl Alcohol Market, by Country, 2016 – 2026 (USD Million)
      Table 33 The Middle-East and Africa Polyvinyl Alcohol Market, by Country, 2016 – 2026 (Kilo Tons)
      Table 34 The Middle-East and Africa Polyvinyl Alcohol Market, by Grade Type, 2016 – 2026 (USD Million)
      Table 35 The Middle-East and Africa Polyvinyl Alcohol Market, by Grade Type, 2016 – 2026 (Kilo Tons)
      Table 36 The Middle-East and Africa Polyvinyl Alcohol Market, by End-Use Industries, 2016 – 2026 (USD Million)
      Table 37 The Middle-East and Africa Polyvinyl Alcohol Market, by End-Use Industries, 2016 – 2026 (Kilo Tons)
      Table 38 North America Polyvinyl Alcohol Production, Consumption, Export, Import, 2016 – 2019
      Table 39 Europe Polyvinyl Alcohol Production, Consumption, Export, Import, 2016 – 2019
      Table 40 Asia Pacific Polyvinyl Alcohol Production, Consumption, Export, Import, 2016 – 2019
      Table 41 Latin America Polyvinyl Alcohol Production, Consumption, Export, Import, 2016 – 2019
      Table 42 The Middle-East and Africa Polyvinyl Alcohol Production, Consumption, Export, Import, 2016 – 2019
      Table 43 Global Polyvinyl Alcohol Market - Company Revenue Analysis, 2016 – 2019 (USD Million)
      Table 44 Global Polyvinyl Alcohol Market - Company Revenue Share Analysis, 2016 – 2019 (%)
      Table 45 Global Polyvinyl Alcohol Market - Company Volume Analysis, 2016 – 2019 (Kilo Tons)
      Table 46 Global Polyvinyl Alcohol Market - Company Volume Share Analysis, 2016 – 2019 (%)
      Table 47 Acquisitions and Mergers
      Table 48 Market Drivers – Impact Analysis
      Table 49 Market Restraints
      Table 50 Market Opportunities
      Table 51 Production Base and Market Concentration Rate of Raw Material
      Table 52 Key Suppliers of Raw Materials
      Table 53 Raw Materials Sources of Polyvinyl Alcohol Major Manufacturers
      Table 54 Major Buyers of Polyvinyl Alcohol
      Table 55 Distributors/Traders of Polyvinyl Alcohol by Region
      

Industry Major Market Players

  • Anhui Wanwei Group
  • Astrra Chemicals
  • Chang Chun Group
  • China Petroleum & Chemical Corporation
  • Japan Vam&Poval Co. Ltd.
  • Kemipex
  • KURARAY CO. LTD.
  • Nippon Synthetic Chemical Industry Co. Ltd.
  • Merck KGaA
  • OCI Company Ltd.
  • Polysciences Inc.
  • SNP Inc.
  • Sekisui Chemical Co. Ltd.
  • Solutia Inc.(Eastman Chemical Company)