Search Market Research Report

Discover Our Latest Reports
Discover Our Featured Reports
Discover Top Selling Reports

Polymeric Adsorbents Market Size, Share Global Analysis Report, 2021 – 2026

report img

Polymeric Adsorbents Market by Type (Methacrylic, Aromatic, Modified Aromatic, and Others), By Application (Anthocyanin Removal, Chlorinated Solvents Removal, Heterocyclic Amines Removal, Purification of Alkanolamines, Sugar Decolorization, and Others), and End-User Industry (Food and Beverage, Industrial, Chemicals, Pharmaceutical, Textile, and Others), By Region: Global & Regional Industry Perspective, Comprehensive Analysis, and Forecast 2021 – 2026

Industry Insights

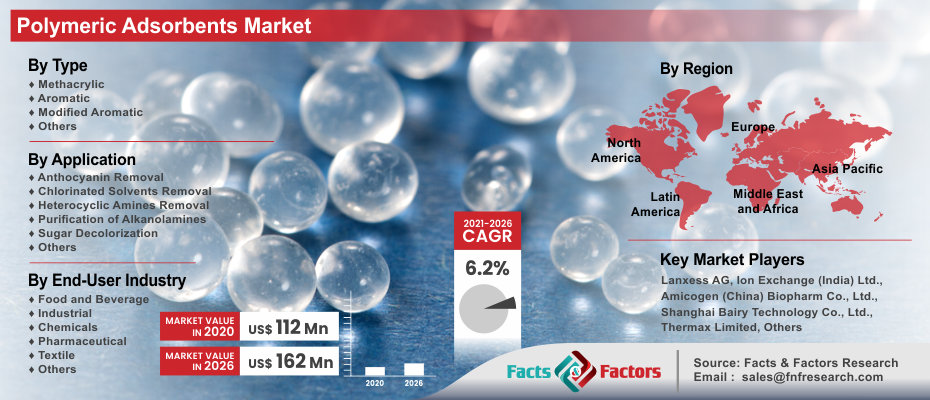
[187+ Pages Report] According to Facts and Factors, the global polymeric adsorbents market was valued at roughly USD 112 Million in 2020 and is predicted to create revenue of roughly USD 162 Million by the end of 2026, with a CAGR of roughly 6.2% between 2021 and 2026.

logoMarket Overview             

Polymeric adsorbents are adsorbents that have been artificially produced and have their subunits covalently linked together. When compared to traditional adsorbents, these polymers have a wider variety of characteristics, including higher porosity, greater endurance, and a bigger surface area. Polymer adsorbents are widely utilized to treat phenolic wastes in a variety of end-use sectors, including pharmaceuticals, food & beverages, textiles, and others, due to their outstanding physicochemical qualities and adsorption capabilities. Mechanical strength, adsorption capacity, and selectivity may all be changed depending on the operating requirements.

logo Key Trends

Polymeric adsorbents are mostly utilized in the pharmaceutical sectors and food & beverage for purification and separation procedures. Purification of pharmaceutical goods, such as antibiotics and active pharmaceutical ingredients (APIs), as well as food and beverage items, such as citric juices and vitamins, entails removing unwanted components and extracting high-quality and purified products. Polymeric adsorbents are more effective than conventional adsorbents at extracting components without contamination. They are also extremely resistant to caustic and acidic environments. This is anticipated to drive the polymeric adsorbents market. 

In industrial applications, polymeric adsorbents are used to remove phenol and substituted phenol from non-aqueous streams and aqueous, purify alkanol amines, recover heterocyclic amines, recover toluene, benzene, and xylene, decolonize organic streams and kraft pulp mill effluents, and purify hydrogen peroxide. Government laws governing the emission of flue and hazardous gases are forcing the chemical industry to use improved adsorption technology in purification operations all around the world. As a result, polymeric adsorbents are chosen over activated carbon due to their greater average pore diameter. This is expected to create lucrative opportunities for the market in the upcoming years.

logoSegmentation Analysis

The global polymeric adsorbents market is divided based on type, application,end-user industry, and region

Based on type the market is bifurcated into aromatic, methacrylic, modified aromatic, and others. Aromatic dominated the type segment as its resin is utilized in various food processing industries to recover materials such as proteins along with other high-value materials. It is also utilized to decolorize and purify food additives and ingredients. Also, the aromatic resin is used to purify and separate compounds with smaller molecular weight such as vitamins, enzymes, antibiotics, peptides, amino acids, and steroids. It can also be utilized in several process cycles in batch or column systems due to its thermal stability and physical resistance.

Based on the application the market is segregated into chlorinated solvents removal, purification of alkanol amines, anthocyanin removal, heterocyclic amines removal, sugar decolorization, and others. Chlorinated solvents removal dominated the application segmentation in 2020. This can be attributed to its use in cleaning solutions such as glues, paint thinner, resins, and pesticides among others. Chlorinated solvents, such as trichloroethylene (TCE), carbon tetrachloride (carbon tet), and methylene chloride, are a wide family of chemical compounds that include chlorine. Their chlorine-containing chemical structure aids them in dissolving organic compounds like fats and greases effectively, as well as serving as raw materials or intermediates in the manufacture of other chemicals. Workers can be exposed to chlorinated solvents by solvent absorption, skin contact, and inhalation. Because solvents evaporate quickly, inhalation is the most prevalent method of workplace exposure. Another significant method of exposure in the workplace is through skin contact. As a result of its increasing importance in the removal of chlorinated solvents, the market demand for polymeric adsorbents is increasing.

Based on the end-user industry, the market is bifurcated into the industrial, pharmaceutical, food and beverage, chemicals, textile, and others. The pharmaceutical segment dominated the end-user industry segmentation due to its use in the pharmaceutical industry for purification and separation of enzymes, and antibiotics among others. Proteins, peptides, antibiotics, and several compounds can be removed efficiently using polymeric adsorbents. In many cases, the resin's pore structure may be used to increase the removal of smaller molecules while rejecting larger ones. Due to the hemocompatible nature of adsorbent resins, they are frequently employed to extract substances such as β2-microglobulin and cytokines from blood and other biologic fluids while leaving serum proteins intact. As a result, polymeric adsorbents are becoming more prevalent in the market.

logoPolymeric Adsorbents Market: Report Scope

Report Attribute

Details

Market Size in 2020

USD 112 Million

Projected Market Size in 2026

USD 162 Million

CAGR Growth Rate

6.2%

Base Year

2020

Forecast Years

2021-2026

Key Market Players

Lanxess AG, Ion Exchange (India) Ltd., Thermax Limited, Amicogen (China) Biopharm Co., Ltd., Shanghai Bairy Technology Co., Ltd and Others

Key Segments

Type, Application, End-User, and Region

Major Regions Covered

North America, Europe, Asia Pacific, Latin America, and Middle East & Africa

Purchase Options

Request customized purchase options to meet your research needs. Explore purchase options

logo Regional Analysis

Asia Pacific region dominated the polymeric adsorbents market and is anticipated to continue its dominance in the upcoming years. The growing demand for polymeric adsorbents is due to increasing demand from developing and developed economies in the region such as India, China, Japan, and South Korea. The growing demand from end-user industries such as food & beverage and in these countries is one of the driving factors for the polymeric adsorbents market in the Asia Pacific. Increasing private and public investments, growing disposable income, population, and economy are some of the reasons driving these industries in the Asia Pacific region. China is projected to be the region's fastest-growing country-level market due to the presence of significant end-use industries. Due to rising demand for polymeric adsorbents in different end-use sectors such as textile and pharmaceutical, India and other Southeast Asian nations are projected to boost regional market expansion.

Polymeric Adsorbents Market

To know more about this report | Request Free Sample Copy

logo Competitive Players

Some main participants of the global polymeric adsorbents market are

  • Lanxess AG
  • Ion Exchange (India) Ltd.
  • Thermax Limited
  • Amicogen (China) Biopharm Co. Ltd.
  • Shanghai Bairy Technology Co. Ltd.
  • Canftech Inc.
  • Samyang Corporation
  • Jiangsu Kimshan New Material Co. Ltd
  • ResinTech Inc.
  • Tianjin NankaiHecheng Science &Technology Co. Ltd.
  • DuPont de Nemours Inc.
  • Purolite
  • Chemra GmbH
  • Minerals Technologies Inc.
  • Mitsubishi Chemical Corporation
  • Ajinomoto Fine-Techno Co.Inc.
  • Ningbo Zhengguang Resin Co.Ltd.
  • Suqing Group
  • Suzhou Bojie Resin Technology Co.Ltd.
  • Sunresin New Materials Co Ltd
  • Seppro Separation Technology LTD
  • Jiangsu Jinkai Resin Chemical Co. Ltd

logo By Type

  • Methacrylic
  • Aromatic
  • Modified Aromatic
  • Others

logo By Application

  • Anthocyanin Removal
  • Chlorinated Solvents Removal
  • Heterocyclic Amines Removal
  • Purification of Alkanolamines
  • Sugar Decolorization
  • Others

logo By End-User Industry

  • Food and Beverage
  • Industrial
  • Chemicals
  • Pharmaceutical
  • Textile
  • Others

logo By Region

  • North America
    • U.S.
    • Canada
  • Europe
    • France
    • UK
    • Spain
    • Germany
    • Italy
    • Rest of Europe
  • Asia Pacific
    • China
    • Japan
    • India
    • South Korea
    • Southeast Asia
    • Rest of Asia Pacific
  • Latin America
    • Brazil
    • Mexico
    • Rest of Latin America
  • Middle East & Africa
    • GCC Countries
    • South Africa
    • Rest of Middle East & Africa

Table of Content

  1. Chapter 1 Executive Summary
    1. 1.1. Introduction of Polymeric Adsorbents
    2. 1.2. Global Polymeric Adsorbents Market, 2020 & 2026 (USD Million)
    3. 1.3. Global Polymeric Adsorbents Market, 2016 – 2026 (USD Million) (Thousand Liters)
    4. 1.4. Global Polymeric Adsorbents Market Absolute Revenue Opportunity, 2016 – 2026 (USD Million)
    5. 1.5. Global Polymeric Adsorbents Market Incremental Revenue Opportunity, 2021 – 2026 (USD Million)
  2. Chapter 2 Polymeric Adsorbents Market – Type Analysis
    1. 2.1. Global Polymeric Adsorbents Market – Type Overview
    2. 2.2. Global Polymeric Adsorbents Market Share, by Type, 2020 & 2026 (USD Million)
    3. 2.3. Global Polymeric Adsorbents Market share, by Type, 2020 & 2026 (Thousand Liters)
    4. 2.4. Methacrylic
      1. 2.4.1. Global Methacrylic Polymeric Adsorbents Market, 2016 – 2026 (USD Million)
      2. 2.4.2. Global Methacrylic Polymeric Adsorbents Market, 2016 – 2026 (Thousand Liters)
    5. 2.5. Aromatic
      1. 2.5.1. Global Aromatic Polymeric Adsorbents Market, 2016 – 2026 (USD Million)
      2. 2.5.2. Global Aromatic Polymeric Adsorbents Market, 2016 – 2026 (Thousand Liters)
    6. 2.6. Modified Aromatic
      1. 2.6.1. Global Modified Aromatic Polymeric Adsorbents Market, 2016 – 2026 (USD Million)
      2. 2.6.2. Global Modified Aromatic Polymeric Adsorbents Market, 2016 – 2026 (Thousand Liters)
    7. 2.7. Others
      1. 2.7.1. Global Others Polymeric Adsorbents Market, 2016 – 2026 (USD Million)
      2. 2.7.2. Global Others Polymeric Adsorbents Market, 2016 – 2026 (Thousand Liters)
  3. Chapter 3 Polymeric Adsorbents Market – Application Analysis
    1. 3.1. Global Polymeric Adsorbents Market – Application Overview
    2. 3.2. Global Polymeric Adsorbents Market Share, by Application, 2020 & 2026 (USD Million)
    3. 3.3. Global Polymeric Adsorbents Market share, by Application, 2020 & 2026 (Thousand Liters)
    4. 3.4. Anthocyanin Removal
      1. 3.4.1. Global Anthocyanin Removal Polymeric Adsorbents Market, 2016 – 2026 (USD Million)
      2. 3.4.2. Global Anthocyanin Removal Polymeric Adsorbents Market, 2016 – 2026 (Thousand Liters)
    5. 3.5. Chlorinated Solvents Removal
      1. 3.5.1. Global Chlorinated Solvents Removal Polymeric Adsorbents Market, 2016 – 2026 (USD Million)
      2. 3.5.2. Global Chlorinated Solvents Removal Polymeric Adsorbents Market, 2016 – 2026 (Thousand Liters)
    6. 3.6. Heterocyclic Amines Removal
      1. 3.6.1. Global Heterocyclic Amines Removal Polymeric Adsorbents Market, 2016 – 2026 (USD Million)
      2. 3.6.2. Global Heterocyclic Amines Removal Polymeric Adsorbents Market, 2016 – 2026 (Thousand Liters)
    7. 3.7. Purification of Alkanolamines
      1. 3.7.1. Global Purification of Alkanolamines Polymeric Adsorbents Market, 2016 – 2026 (USD Million)
      2. 3.7.2. Global Purification of Alkanolamines Polymeric Adsorbents Market, 2016 – 2026 (Thousand Liters)
    8. 3.8. Sugar Decolorization
      1. 3.8.1. Global Sugar Decolorization Polymeric Adsorbents Market, 2016 – 2026 (USD Million)
      2. 3.8.2. Global Sugar Decolorization Polymeric Adsorbents Market, 2016 – 2026 (Thousand Liters)
    9. 3.9. Others
      1. 3.9.1. Global Others Polymeric Adsorbents Market, 2016 – 2026 (USD Million)
      2. 3.9.2. Global Others Polymeric Adsorbents Market, 2016 – 2026 (Thousand Liters)
  4. Chapter 4 Polymeric Adsorbents Market – End-User Industry Analysis
    1. 4.1. Global Polymeric Adsorbents Market – End-User Industry Overview
    2. 4.2. Global Polymeric Adsorbents Market Share, by End-User Industry, 2020 & 2026 (USD Million)
    3. 4.3. Global Polymeric Adsorbents Market share, by End-User Industry, 2020 & 2026 (Thousand Liters)
    4. 4.4. Food and Beverage
      1. 4.4.1. Global Food and Beverage Polymeric Adsorbents Market, 2016 – 2026 (USD Million)
      2. 4.4.2. Global Food and Beverage Polymeric Adsorbents Market, 2016 – 2026 (Thousand Liters)
    5. 4.5. Industrial
      1. 4.5.1. Global Industrial Polymeric Adsorbents Market, 2016 – 2026 (USD Million)
      2. 4.5.2. Global Industrial Polymeric Adsorbents Market, 2016 – 2026 (Thousand Liters)
    6. 4.6. Chemicals
      1. 4.6.1. Global Chemicals Polymeric Adsorbents Market, 2016 – 2026 (USD Million)
      2. 4.6.2. Global Chemicals Polymeric Adsorbents Market, 2016 – 2026 (Thousand Liters)
    7. 4.7. Pharmaceutical
      1. 4.7.1. Global Pharmaceutical Polymeric Adsorbents Market, 2016 – 2026 (USD Million)
      2. 4.7.2. Global Pharmaceutical Polymeric Adsorbents Market, 2016 – 2026 (Thousand Liters)
    8. 4.8. Textile
      1. 4.8.1. Global Textile Polymeric Adsorbents Market, 2016 – 2026 (USD Million)
      2. 4.8.2. Global Textile Polymeric Adsorbents Market, 2016 – 2026 (Thousand Liters)
    9. 4.9. Others
      1. 4.9.1. Global Others Polymeric Adsorbents Market, 2016 – 2026 (USD Million)
      2. 4.9.2. Global Others Polymeric Adsorbents Market, 2016 – 2026 (Thousand Liters)
  5. Chapter 5 Polymeric Adsorbents Market – Regional Analysis
    1. 5.1. Global Polymeric Adsorbents Market Regional Overview
    2. 5.2. Global Polymeric Adsorbents Market Share, by Region, 2020 & 2026 (USD Million)
    3. 5.3. Global Polymeric Adsorbents Market Share, by Region, 2020 & 2026 (Thousand Liters)
    4. 5.4. North America
      1. 5.4.1. North America Polymeric Adsorbents Market, 2016 – 2026 (USD Million)
        1. 5.4.1.1. North America Polymeric Adsorbents Market, by Country, 2016 – 2026 (USD Million)
      2. 5.4.2. North America Market, 2016 – 2026 (Thousand Liters)
        1. 5.4.2.1. North America Polymeric Adsorbents Market, by Country, 2016 – 2026 (Thousand Liters)
      3. 5.4.3. North America Polymeric Adsorbents Market, by Type, 2016 – 2026
        1. 5.4.3.1. North America Polymeric Adsorbents Market, by Type, 2016 – 2026 (USD Million)
        2. 5.4.3.2. North America Polymeric Adsorbents Market, by Type, 2016 – 2026 (Thousand Liters)
      4. 5.4.4. North America Polymeric Adsorbents Market, by Application, 2016 – 2026
        1. 5.4.4.1. North America Polymeric Adsorbents Market, by Application, 2016 – 2026 (USD Million)
        2. 5.4.4.2. North America Polymeric Adsorbents Market, by Application, 2016 – 2026 (Thousand Liters)
      5. 5.4.5. North America Polymeric Adsorbents Market, by End-User Industry, 2016 – 2026
        1. 5.4.5.1. North America Polymeric Adsorbents Market, by End-User Industry, 2016 – 2026 (USD Million)
        2. 5.4.5.2. North America Polymeric Adsorbents Market, by End-User Industry, 2016 – 2026 (Thousand Liters)
      6. 5.4.6. U.S.
        1. 5.4.6.1. U.S. Polymeric Adsorbents Market, 2016 – 2026 (USD Million)
        2. 5.4.6.2. U.S. Polymeric Adsorbents Market, 2016 – 2026 (Thousand Liters)
      7. 5.4.7. Canada
        1. 5.4.7.1. Canada Polymeric Adsorbents Market, 2016 – 2026 (USD Million)
        2. 5.4.7.2. Canada Polymeric Adsorbents Market, 2016 – 2026 (Thousand Liters)
    5. 5.5. Europe
      1. 5.5.1. Europe Polymeric Adsorbents Market, 2016 – 2026 (USD Million)
        1. 5.5.1.1. Europe Polymeric Adsorbents Market, by Country, 2016 – 2026 (USD Million)
      2. 5.5.2. Europe Market, 2016 – 2026 (Thousand Liters)
        1. 5.5.2.1. Europe Polymeric Adsorbents Market, by Country, 2016 – 2026 (Thousand Liters)
      3. 5.5.3. Europe Polymeric Adsorbents Market, by Type, 2016 – 2026
        1. 5.5.3.1. Europe Polymeric Adsorbents Market, by Type, 2016 – 2026 (USD Million)
        2. 5.5.3.2. Europe Polymeric Adsorbents Market, by Type, 2016 – 2026 (Thousand Liters)
      4. 5.5.4. Europe Polymeric Adsorbents Market, by Application, 2016 – 2026
        1. 5.5.4.1. Europe Polymeric Adsorbents Market, by Application, 2016 – 2026 (USD Million)
        2. 5.5.4.2. Europe Polymeric Adsorbents Market, by Application, 2016 – 2026 (Thousand Liters)
      5. 5.5.5. Europe Polymeric Adsorbents Market, by End-User Industry, 2016 – 2026
        1. 5.5.5.1. Europe Polymeric Adsorbents Market, by End-User Industry, 2016 – 2026 (USD Million)
        2. 5.5.5.2. Europe Polymeric Adsorbents Market, by End-User Industry, 2016 – 2026 (Thousand Liters)
      6. 5.5.6. Germany
        1. 5.5.6.1. Germany Polymeric Adsorbents Market, 2016 – 2026 (USD Million)
        2. 5.5.6.2. Germany Polymeric Adsorbents Market, 2016 – 2026 (Thousand Liters)
      7. 5.5.7. France
        1. 5.5.7.1. France Polymeric Adsorbents Market, 2016 – 2026 (USD Million)
        2. 5.5.7.2. France Polymeric Adsorbents Market, 2016 – 2026 (Thousand Liters)
      8. 5.5.8. U.K.
        1. 5.5.8.1. U.K. Polymeric Adsorbents Market, 2016 – 2026 (USD Million)
        2. 5.5.8.2. U.K. Polymeric Adsorbents Market, 2016 – 2026 (Thousand Liters)
      9. 5.5.9. Italy
        1. 5.5.9.1. Italy Polymeric Adsorbents Market, 2016 – 2026 (USD Million)
        2. 5.5.9.2. Italy Polymeric Adsorbents Market, 2016 – 2026 (Thousand Liters)
      10. 5.5.10. Spain
        1. 5.5.10.1. Spain Polymeric Adsorbents Market, 2016 – 2026 (USD Million)
        2. 5.5.10.2. Spain Polymeric Adsorbents Market, 2016 – 2026 (Thousand Liters)
      11. 5.5.11. Rest of Europe
        1. 5.5.11.1. Rest of Europe Polymeric Adsorbents Market, 2016 – 2026 (USD Million)
        2. 5.5.11.2. Rest of Europe Polymeric Adsorbents Market, 2016 – 2026 (Thousand Liters)
    6. 5.6. Asia Pacific
      1. 5.6.1. Asia Pacific Polymeric Adsorbents Market, 2016 – 2026 (USD Million)
        1. 5.6.1.1. Asia Pacific Polymeric Adsorbents Market, by Country, 2016 – 2026 (USD Million)
      2. 5.6.2. Asia Pacific Market, 2016 – 2026 (Thousand Liters)
        1. 5.6.2.1. Asia Pacific Polymeric Adsorbents Market, by Country, 2016 – 2026 (Thousand Liters)
      3. 5.6.3. Asia Pacific Polymeric Adsorbents Market, by Type, 2016 – 2026
        1. 5.6.3.1. Asia Pacific Polymeric Adsorbents Market, by Type, 2016 – 2026 (USD Million)
        2. 5.6.3.2. Asia Pacific Polymeric Adsorbents Market, by Type, 2016 – 2026 (Thousand Liters)
      4. 5.6.4. Asia Pacific Polymeric Adsorbents Market, by Application, 2016 – 2026
        1. 5.6.4.1. Asia Pacific Polymeric Adsorbents Market, by Application, 2016 – 2026 (USD Million)
        2. 5.6.4.2. Asia Pacific Polymeric Adsorbents Market, by Application, 2016 – 2026 (Thousand Liters)
      5. 5.6.5. Asia Pacific Polymeric Adsorbents Market, by End-User Industry, 2016 – 2026
        1. 5.6.5.1. Asia Pacific Polymeric Adsorbents Market, by End-User Industry, 2016 – 2026 (USD Million)
        2. 5.6.5.2. Asia Pacific Polymeric Adsorbents Market, by End-User Industry, 2016 – 2026 (Thousand Liters)
      6. 5.6.6. China
        1. 5.6.6.1. China Polymeric Adsorbents Market, 2016 – 2026 (USD Million)
        2. 5.6.6.2. China Polymeric Adsorbents Market, 2016 – 2026 (Thousand Liters)
      7. 5.6.7. Japan
        1. 5.6.7.1. Japan Polymeric Adsorbents Market, 2016 – 2026 (USD Million)
        2. 5.6.7.2. Japan Polymeric Adsorbents Market, 2016 – 2026 (Thousand Liters)
      8. 5.6.8. India
        1. 5.6.8.1. India Polymeric Adsorbents Market, 2016 – 2026 (USD Million)
        2. 5.6.8.2. India Polymeric Adsorbents Market, 2016 – 2026 (Thousand Liters)
      9. 5.6.9. South Korea
        1. 5.6.9.1. South Korea Polymeric Adsorbents Market, 2016 – 2026 (USD Million)
        2. 5.6.9.2. South Korea Polymeric Adsorbents Market, 2016 – 2026 (Thousand Liters)
      10. 5.6.10. South-East Asia
        1. 5.6.10.1. South-East Asia Polymeric Adsorbents Market, 2016 – 2026 (USD Million)
        2. 5.6.10.2. South-East Asia Polymeric Adsorbents Market, 2016 – 2026 (Thousand Liters)
      11. 5.6.11. Rest of Asia Pacific
        1. 5.6.11.1. Rest of Asia Pacific Polymeric Adsorbents Market, 2016 – 2026 (USD Million)
        2. 5.6.11.2. Rest of Asia Pacific Polymeric Adsorbents Market, 2016 – 2026 (Thousand Liters)
    7. 5.7. Latin America
      1. 5.7.1. Latin America Polymeric Adsorbents Market, 2016 – 2026 (USD Million)
        1. 5.7.1.1. Latin America Polymeric Adsorbents Market, by Country, 2016 – 2026 (USD Million)
      2. 5.7.2. Latin America Market, 2016 – 2026 (Thousand Liters)
        1. 5.7.2.1. Latin America Polymeric Adsorbents Market, by Country, 2016 – 2026 (Thousand Liters)
      3. 5.7.3. Latin America Polymeric Adsorbents Market, by Type, 2016 – 2026
        1. 5.7.3.1. Latin America Polymeric Adsorbents Market, by Type, 2016 – 2026 (USD Million)
        2. 5.7.3.2. Latin America Polymeric Adsorbents Market, by Type, 2016 – 2026 (Thousand Liters)
      4. 5.7.4. Latin America Polymeric Adsorbents Market, by Application, 2016 – 2026
        1. 5.7.4.1. Latin America Polymeric Adsorbents Market, by Application, 2016 – 2026 (USD Million)
        2. 5.7.4.2. Latin America Polymeric Adsorbents Market, by Application, 2016 – 2026 (Thousand Liters)
      5. 5.7.5. Latin America Polymeric Adsorbents Market, by End-User Industry, 2016 – 2026
        1. 5.7.5.1. Latin America Polymeric Adsorbents Market, by End-User Industry, 2016 – 2026 (USD Million)
        2. 5.7.5.2. Latin America Polymeric Adsorbents Market, by End-User Industry, 2016 – 2026 (Thousand Liters)
      6. 5.7.6. Brazil
        1. 5.7.6.1. Brazil Polymeric Adsorbents Market, 2016 – 2026 (USD Million)
        2. 5.7.6.2. Brazil Polymeric Adsorbents Market, 2016 – 2026 (Thousand Liters)
      7. 5.7.7. Mexico
        1. 5.7.7.1. Mexico Polymeric Adsorbents Market, 2016 – 2026 (USD Million)
        2. 5.7.7.2. Mexico Polymeric Adsorbents Market, 2016 – 2026 (Thousand Liters)
      8. 5.7.8. Rest of Latin America
        1. 5.7.8.1. Rest of Latin America Polymeric Adsorbents Market, 2016 – 2026 (USD Million)
        2. 5.7.8.2. Rest of Latin America Polymeric Adsorbents Market, 2016 – 2026 (Thousand Liters)
    8. 5.8. The Middle-East and Africa
      1. 5.8.1. The Middle-East and Africa Polymeric Adsorbents Market, 2016 – 2026 (USD Million)
        1. 5.8.1.1. The Middle-East and Africa Polymeric Adsorbents Market, by Country, 2016 – 2026 (USD Million)
      2. 5.8.2. The Middle-East and Africa Market, 2016 – 2026 (Thousand Liters)
        1. 5.8.2.1. The Middle-East and Africa Polymeric Adsorbents Market, by Country, 2016 – 2026 (Thousand Liters)
      3. 5.8.3. The Middle-East and Africa Polymeric Adsorbents Market, by Type, 2016 – 2026
        1. 5.8.3.1. The Middle-East and Africa Polymeric Adsorbents Market, by Type, 2016 – 2026 (USD Million)
        2. 5.8.3.2. The Middle-East and Africa Polymeric Adsorbents Market, by Type, 2016 – 2026 (Thousand Liters)
      4. 5.8.4. The Middle-East and Africa Polymeric Adsorbents Market, by Application, 2016 – 2026
        1. 5.8.4.1. The Middle-East and Africa Polymeric Adsorbents Market, by Application, 2016 – 2026 (USD Million)
        2. 5.8.4.2. The Middle-East and Africa Polymeric Adsorbents Market, by Application, 2016 – 2026 (Thousand Liters)
      5. 5.8.5. The Middle-East and Africa Polymeric Adsorbents Market, by End-User Industry, 2016 – 2026
        1. 5.8.5.1. The Middle-East and Africa Polymeric Adsorbents Market, by End-User Industry, 2016 – 2026 (USD Million)
        2. 5.8.5.2. The Middle-East and Africa Polymeric Adsorbents Market, by End-User Industry, 2016 – 2026 (Thousand Liters)
      6. 5.8.6. GCC Countries
        1. 5.8.6.1. GCC Countries Polymeric Adsorbents Market, 2016 – 2026 (USD Million)
        2. 5.8.6.2. GCC Countries Polymeric Adsorbents Market, 2016 – 2026 (Thousand Liters)
      7. 5.8.7. South Africa
        1. 5.8.7.1. South Africa Polymeric Adsorbents Market, 2016 – 2026 (USD Million)
        2. 5.8.7.2. South Africa Polymeric Adsorbents Market, 2016 – 2026 (Thousand Liters)
      8. 5.8.8. Rest of Middle-East Africa
        1. 5.8.8.1. Rest of Middle-East Africa Polymeric Adsorbents Market, 2016 – 2026 (USD Million)
        2. 5.8.8.2. Rest of Middle-East Africa Polymeric Adsorbents Market, 2016 – 2026 (Thousand Liters)
  6. Chapter 6 Polymeric Adsorbents Production, Consumption, Export, Import by Regions
    1. 6.1. Global Polymeric Adsorbents Production and Consumption, 2016 – 2026 (Thousand Liters)
    2. 6.2. Global Import and Export Analysis, by Region
  7. Chapter 7 Polymeric Adsorbents Market – Competitive Landscape
    1. 7.1. Competitor Market Share – Revenue
    2. 7.2. Market Concentration Rate Analysis, Top 3 and Top 5 Players
    3. 7.3. Competitor Market Share – Volume
    4. 7.4. Strategic Developments
      1. 7.4.1. Acquisitions and Mergers
      2. 7.4.2. New Products
      3. 7.4.3. Research & Development Activities
  8. Chapter 8 Company Profiles
    1. 8.1. Lanxess AG
      1. 8.1.1. Company Overview
      2. 8.1.2. Product/Service Portfolio
      3. 8.1.3. Lanxess AG Sales, Revenue, Price, and Gross Margin
      4. 8.1.4. Lanxess AG Revenue and Growth Rate
      5. 8.1.5. Lanxess AG Market Share
      6. 8.1.6. Recent Initiatives, Funding/VC Activities, and Technological Innovations
    2. 8.2. Ion Exchange (India) Ltd.
      1. 8.2.1. Company Overview
      2. 8.2.2. Product/Service Portfolio
      3. 8.2.3. Ion Exchange (India) Ltd. Sales, Revenue, Price, and Gross Margin
      4. 8.2.4. Ion Exchange (India) Ltd. Revenue and Growth Rate
      5. 8.2.5. Ion Exchange (India) Ltd. Market Share
      6. 8.2.6. Recent Initiatives, Funding/VC Activities, and Technological Innovations
    3. 8.3. Thermax Limited
      1. 8.3.1. Company Overview
      2. 8.3.2. Product/Service Portfolio
      3. 8.3.3. Thermax Limited Sales, Revenue, Price, and Gross Margin
      4. 8.3.4. Thermax Limited Revenue and Growth Rate
      5. 8.3.5. Thermax Limited Market Share
      6. 8.3.6. Recent Initiatives, Funding/VC Activities, and Technological Innovations
    4. 8.4. Amicogen (China) Biopharm Co., Ltd.
      1. 8.4.1. Company Overview
      2. 8.4.2. Product/Service Portfolio
      3. 8.4.3. Amicogen (China) Biopharm Co., Ltd. Sales, Revenue, Price, and Gross Margin
      4. 8.4.4. Amicogen (China) Biopharm Co., Ltd. Revenue and Growth Rate
      5. 8.4.5. Amicogen (China) Biopharm Co., Ltd. Market Share
      6. 8.4.6. Recent Initiatives, Funding/VC Activities, and Technological Innovations
    5. 8.5. Shanghai Bairy Technology Co., Ltd.
      1. 8.5.1. Company Overview
      2. 8.5.2. Product/Service Portfolio
      3. 8.5.3. Shanghai Bairy Technology Co., Ltd. Sales, Revenue, Price, and Gross Margin
      4. 8.5.4. Shanghai Bairy Technology Co., Ltd. Revenue and Growth Rate
      5. 8.5.5. Shanghai Bairy Technology Co., Ltd. Market Share
      6. 8.5.6. Recent Initiatives, Funding/VC Activities, and Technological Innovations
    6. 8.6. Canftech Inc.
      1. 8.6.1. Company Overview
      2. 8.6.2. Product/Service Portfolio
      3. 8.6.3. Canftech Inc. Sales, Revenue, Price, and Gross Margin
      4. 8.6.4. Canftech Inc. Revenue and Growth Rate
      5. 8.6.5. Canftech Inc. Market Share
      6. 8.6.6. Recent Initiatives, Funding/VC Activities, and Technological Innovations
    7. 8.7. Samyang Corporation
      1. 8.7.1. Company Overview
      2. 8.7.2. Product/Service Portfolio
      3. 8.7.3. Samyang Corporation Sales, Revenue, Price, and Gross Margin
      4. 8.7.4. Samyang Corporation Revenue and Growth Rate
      5. 8.7.5. Samyang Corporation Market Share
      6. 8.7.6. Recent Initiatives, Funding/VC Activities, and Technological Innovations
    8. 8.8. Jiangsu Kimshan New Material Co., Ltd
      1. 8.8.1. Company Overview
      2. 8.8.2. Product/Service Portfolio
      3. 8.8.3. Jiangsu Kimshan New Material Co., Ltd Sales, Revenue, Price, and Gross Margin
      4. 8.8.4. Jiangsu Kimshan New Material Co., Ltd Revenue and Growth Rate
      5. 8.8.5. Jiangsu Kimshan New Material Co., Ltd Market Share
      6. 8.8.6. Recent Initiatives, Funding/VC Activities, and Technological Innovations
    9. 8.9. ResinTech Inc.
      1. 8.9.1. Company Overview
      2. 8.9.2. Product/Service Portfolio
      3. 8.9.3. ResinTech Inc. Sales, Revenue, Price, and Gross Margin
      4. 8.9.4. ResinTech Inc. Revenue and Growth Rate
      5. 8.9.5. ResinTech Inc. Market Share
      6. 8.9.6. Recent Initiatives, Funding/VC Activities, and Technological Innovations
    10. 8.10. Tianjin NankaiHecheng Science &Technology Co., Ltd.
      1. 8.10.1. Company Overview
      2. 8.10.2. Product/Service Portfolio
      3. 8.10.3. Tianjin NankaiHecheng Science &Technology Co., Ltd. Sales, Revenue, Price, and Gross Margin
      4. 8.10.4. Tianjin NankaiHecheng Science &Technology Co., Ltd. Revenue and Growth Rate
      5. 8.10.5. Tianjin NankaiHecheng Science &Technology Co., Ltd. Market Share
      6. 8.10.6. Recent Initiatives, Funding/VC Activities, and Technological Innovations
    11. 8.11. DuPont de Nemours, Inc.
      1. 8.11.1. Company Overview
      2. 8.11.2. Product/Service Portfolio
      3. 8.11.3. DuPont de Nemours, Inc. Sales, Revenue, Price, and Gross Margin
      4. 8.11.4. DuPont de Nemours, Inc. Revenue and Growth Rate
      5. 8.11.5. DuPont de Nemours, Inc. Market Share
      6. 8.11.6. Recent Initiatives, Funding/VC Activities, and Technological Innovations
    12. 8.12. Purolite
      1. 8.12.1. Company Overview
      2. 8.12.2. Product/Service Portfolio
      3. 8.12.3. Purolite Sales, Revenue, Price, and Gross Margin
      4. 8.12.4. Purolite Revenue and Growth Rate
      5. 8.12.5. Purolite Market Share
      6. 8.12.6. Recent Initiatives, Funding/VC Activities, and Technological Innovations
    13. 8.13. Chemra GmbH
      1. 8.13.1. Company Overview
      2. 8.13.2. Product/Service Portfolio
      3. 8.13.3. Chemra GmbH Sales, Revenue, Price, and Gross Margin
      4. 8.13.4. Chemra GmbH Revenue and Growth Rate
      5. 8.13.5. Chemra GmbH Market Share
      6. 8.13.6. Recent Initiatives, Funding/VC Activities, and Technological Innovations
    14. 8.14. Minerals Technologies Inc.
      1. 8.14.1. Company Overview
      2. 8.14.2. Product/Service Portfolio
      3. 8.14.3. Minerals Technologies Inc. Sales, Revenue, Price, and Gross Margin
      4. 8.14.4. Minerals Technologies Inc. Revenue and Growth Rate
      5. 8.14.5. Minerals Technologies Inc. Market Share
      6. 8.14.6. Recent Initiatives, Funding/VC Activities, and Technological Innovations
    15. 8.15. Mitsubishi Chemical Corporation
      1. 8.15.1. Company Overview
      2. 8.15.2. Product/Service Portfolio
      3. 8.15.3. Mitsubishi Chemical Corporation Sales, Revenue, Price, and Gross Margin
      4. 8.15.4. Mitsubishi Chemical Corporation Revenue and Growth Rate
      5. 8.15.5. Mitsubishi Chemical Corporation Market Share
      6. 8.15.6. Recent Initiatives, Funding/VC Activities, and Technological Innovations
    16. 8.16. Ajinomoto Fine-Techno Co., Inc.
      1. 8.16.1. Company Overview
      2. 8.16.2. Product/Service Portfolio
      3. 8.16.3. Ajinomoto Fine-Techno Co., Inc. Sales, Revenue, Price, and Gross Margin
      4. 8.16.4. Ajinomoto Fine-Techno Co., Inc. Revenue and Growth Rate
      5. 8.16.5. Ajinomoto Fine-Techno Co., Inc. Market Share
      6. 8.16.6. Recent Initiatives, Funding/VC Activities, and Technological Innovations
    17. 8.17. Ningbo Zhengguang Resin Co.,Ltd.
      1. 8.17.1. Company Overview
      2. 8.17.2. Product/Service Portfolio
      3. 8.17.3. Ningbo Zhengguang Resin Co.,Ltd. Sales, Revenue, Price, and Gross Margin
      4. 8.17.4. Ningbo Zhengguang Resin Co.,Ltd. Revenue and Growth Rate
      5. 8.17.5. Ningbo Zhengguang Resin Co.,Ltd. Market Share
      6. 8.17.6. Recent Initiatives, Funding/VC Activities, and Technological Innovations
    18. 8.18. Suqing Group
      1. 8.18.1. Company Overview
      2. 8.18.2. Product/Service Portfolio
      3. 8.18.3. Suqing Group Sales, Revenue, Price, and Gross Margin
      4. 8.18.4. Suqing Group Revenue and Growth Rate
      5. 8.18.5. Suqing Group Market Share
      6. 8.18.6. Recent Initiatives, Funding/VC Activities, and Technological Innovations
    19. 8.19. Suzhou Bojie Resin Technology Co.,Ltd.
      1. 8.19.1. Company Overview
      2. 8.19.2. Product/Service Portfolio
      3. 8.19.3. Suzhou Bojie Resin Technology Co.,Ltd. Sales, Revenue, Price, and Gross Margin
      4. 8.19.4. Suzhou Bojie Resin Technology Co.,Ltd. Revenue and Growth Rate
      5. 8.19.5. Suzhou Bojie Resin Technology Co.,Ltd. Market Share
      6. 8.19.6. Recent Initiatives, Funding/VC Activities, and Technological Innovations
    20. 8.20. Sunresin New Materials Co Ltd
      1. 8.20.1. Company Overview
      2. 8.20.2. Product/Service Portfolio
      3. 8.20.3. Sunresin New Materials Co Ltd Sales, Revenue, Price, and Gross Margin
      4. 8.20.4. Sunresin New Materials Co Ltd Revenue and Growth Rate
      5. 8.20.5. Sunresin New Materials Co Ltd Market Share
      6. 8.20.6. Recent Initiatives, Funding/VC Activities, and Technological Innovations
    21. 8.21. Seppro Separation Technology LTD
      1. 8.21.1. Company Overview
      2. 8.21.2. Product/Service Portfolio
      3. 8.21.3. Seppro Separation Technology LTD Sales, Revenue, Price, and Gross Margin
      4. 8.21.4. Seppro Separation Technology LTD Revenue and Growth Rate
      5. 8.21.5. Seppro Separation Technology LTD Market Share
      6. 8.21.6. Recent Initiatives, Funding/VC Activities, and Technological Innovations
    22. 8.22. Jiangsu Jinkai Resin Chemical Co., Ltd.
      1. 8.22.1. Company Overview
      2. 8.22.2. Product/Service Portfolio
      3. 8.22.3. Jiangsu Jinkai Resin Chemical Co., Ltd. Sales, Revenue, Price, and Gross Margin
      4. 8.22.4. Jiangsu Jinkai Resin Chemical Co., Ltd. Revenue and Growth Rate
      5. 8.22.5. Jiangsu Jinkai Resin Chemical Co., Ltd. Market Share
      6. 8.22.6. Recent Initiatives, Funding/VC Activities, and Technological Innovations
  9. Chapter 9 Polymeric Adsorbents — Industry Analysis
    1. 9.1. Introduction and Taxonomy
    2. 9.2. Polymeric Adsorbents Market – Key Trends
      1. 9.2.1. Market Drivers
      2. 9.2.2. Market Restraints
      3. 9.2.3. Market Opportunities
    3. 9.3. Value Chain Analysis
    4. 9.4. Key Mandates and Regulations
    5. 9.5. Technology Roadmap and Timeline
    6. 9.6. Polymeric Adsorbents Market – Attractiveness Analysis
      1. 9.6.1. By Type
      2. 9.6.2. By Application
      3. 9.6.3. By End-User Industry
      4. 9.6.4. By Region
  10. Chapter 10 Raw Material Analysis
    1. 10.1. Polymeric Adsorbents Key Raw Material Analysis
      1. 10.1.1. Key Raw Materials
      2. 10.1.2. Price Trend of Key Raw Materials
    2. 10.2. Key Suppliers of Raw Materials
    3. 10.3. Proportion of Manufacturing Cost Structure
      1. 10.3.1. Raw Materials Cost
      2. 10.3.2. Labor Cost
      3. 10.3.3. Manufacturing Expenses
      4. 10.3.4. Miscellaneous Expenses
    4. 10.4. Manufacturing Cost Analysis of Polymeric Adsorbents
  11. Chapter 11 Industrial Chain, Sourcing Strategy, and Downstream Buyers
    1. 11.1. Polymeric Adsorbents Industrial Chain Analysis
    2. 11.2. Upstream Raw Materials Sourcing
      1. 11.2.1. Risk Mitigation:
      2. 11.2.2. Supplier Relationships:
      3. 11.2.3. Business Processes:
      4. 11.2.4. Securing the Product:
    3. 11.3. Raw Materials Sources of Polymeric Adsorbents Major Manufacturers
    4. 11.4. Downstream Buyers
    5. 11.5. Distributors/Traders List
  12. Chapter 12 Marketing Strategy Analysis, Distributors
    1. 12.1. Marketing Channel
    2. 12.2. Direct Marketing
    3. 12.3. Indirect Marketing
    4. 12.4. Marketing Channel Development Trends
    5. 12.5. Economic/Political Environmental Change
  13. Chapter 13 Report Conclusion & Key Insights
    1. 13.1. Key Insights from Primary Interviews & Surveys Respondents
    2. 13.2. Key Takeaways from Analysts, Consultants, and Industry Leaders
  14. Chapter 14 Research Approach & Methodology
    1. 14.1. Report Description
    2. 14.2. Research Scope
    3. 14.3. Research Methodology
      1. 14.3.1. Secondary Research
      2. 14.3.2. Primary Research
      3. 14.3.3. Statistical Models
        1. 14.3.3.1. Company Share Analysis Model
        2. 14.3.3.2. Revenue Based Modeling
      4. 14.3.4. Research Limitations 

      List of Figures

      Fig.1	Product Picture of Polymeric Adsorbents
      Fig.2	Global Polymeric Adsorbents Market, 2016 – 2026 (USD Million)
      Fig.3	Global Polymeric Adsorbents Market, 2016 – 2026 (Thousand Liters)
      Fig.4	Global Polymeric Adsorbents Market Absolute Revenue Opportunity, 2016 – 2026 (USD Million)
      Fig.5	Global Polymeric Adsorbents Market Incremental Revenue Opportunity, 2021 – 2026 (USD Million)
      Fig.6	Global Polymeric Adsorbents Market Share, by Type, 2020 & 2026 (USD Million)
      Fig.7	Global Polymeric Adsorbents Market Share, by Type, 2020 & 2026 (Thousand Liters)
      Fig.8	Global Methacrylic Polymeric Adsorbents Market, 2016 – 2026 (USD Million)
      Fig.9	Global Methacrylic Polymeric Adsorbents Market, 2016 – 2026 (Thousand Liters)
      Fig.10	Global Aromatic Polymeric Adsorbents Market, 2016 – 2026 (USD Million)
      Fig.11	Global Aromatic Polymeric Adsorbents Market, 2016 – 2026 (Thousand Liters)
      Fig.12	Global Modified Aromatic Polymeric Adsorbents Market, 2016 – 2026 (USD Million)
      Fig.13	Global Modified Aromatic Polymeric Adsorbents Market, 2016 – 2026 (Thousand Liters)
      Fig.14	Global Others Polymeric Adsorbents Market, 2016 – 2026 (USD Million)
      Fig.15	Global Others Polymeric Adsorbents Market, 2016 – 2026 (Thousand Liters)
      Fig.16	Global Polymeric Adsorbents Market Share, by Application, 2020 & 2026 (USD Million)
      Fig.17	Global Polymeric Adsorbents Market Share, by Application, 2020 & 2026 (Thousand Liters)
      Fig.18	Global Anthocyanin Removal Polymeric Adsorbents Market, 2016 – 2026 (USD Million)
      Fig.19	Global Anthocyanin Removal Polymeric Adsorbents Market, 2016 – 2026 (Thousand Liters)
      Fig.20	Global Chlorinated Solvents Removal Polymeric Adsorbents Market, 2016 – 2026 (USD Million)
      Fig.21	Global Chlorinated Solvents Removal Polymeric Adsorbents Market, 2016 – 2026 (Thousand Liters)
      Fig.22	Global Heterocyclic Amines Removal Polymeric Adsorbents Market, 2016 – 2026 (USD Million)
      Fig.23	Global Heterocyclic Amines Removal Polymeric Adsorbents Market, 2016 – 2026 (Thousand Liters)
      Fig.24	Global Purification of Alkanolamines Polymeric Adsorbents Market, 2016 – 2026 (USD Million)
      Fig.25	Global Purification of Alkanolamines Polymeric Adsorbents Market, 2016 – 2026 (Thousand Liters)
      Fig.26	Global Sugar Decolorization Polymeric Adsorbents Market, 2016 – 2026 (USD Million)
      Fig.27	Global Sugar Decolorization Polymeric Adsorbents Market, 2016 – 2026 (Thousand Liters)
      Fig.28	Global Others Polymeric Adsorbents Market, 2016 – 2026 (USD Million)
      Fig.29	Global Others Polymeric Adsorbents Market, 2016 – 2026 (Thousand Liters)
      Fig.30	Global Polymeric Adsorbents Market Share, by End-User Industry, 2020 & 2026 (USD Million)
      Fig.31	Global Polymeric Adsorbents Market Share, by End-User Industry, 2020 & 2026 (Thousand Liters)
      Fig.32	Global Food and Beverage Polymeric Adsorbents Market, 2016 – 2026 (USD Million)
      Fig.33	Global Food and Beverage Polymeric Adsorbents Market, 2016 – 2026 (Thousand Liters)
      Fig.34	Global Industrial Polymeric Adsorbents Market, 2016 – 2026 (USD Million)
      Fig.35	Global Industrial Polymeric Adsorbents Market, 2016 – 2026 (Thousand Liters)
      Fig.36	Global Chemicals Polymeric Adsorbents Market, 2016 – 2026 (USD Million)
      Fig.37	Global Chemicals Polymeric Adsorbents Market, 2016 – 2026 (Thousand Liters)
      Fig.38	Global Pharmaceutical Polymeric Adsorbents Market, 2016 – 2026 (USD Million)
      Fig.39	Global Pharmaceutical Polymeric Adsorbents Market, 2016 – 2026 (Thousand Liters)
      Fig.40	Global Textile Polymeric Adsorbents Market, 2016 – 2026 (USD Million)
      Fig.41	Global Textile Polymeric Adsorbents Market, 2016 – 2026 (Thousand Liters)
      Fig.42	Global Others Polymeric Adsorbents Market, 2016 – 2026 (USD Million)
      Fig.43	Global Others Polymeric Adsorbents Market, 2016 – 2026 (Thousand Liters)
      Fig.44	Global Polymeric Adsorbents Market Share, by Region, 2020 & 2026 (USD Million)
      Fig.45	Global Polymeric Adsorbents Market Share, by Region, 2020 & 2026 (Thousand Liters)
      Fig.46	North America Polymeric Adsorbents Market, 2016 – 2026 (USD Million)
      Fig.47	North America Polymeric Adsorbents Market, 2016 – 2026 (Thousand Liters)
      Fig.48	U.S. Polymeric Adsorbents Market, 2016 – 2026 (USD Million)
      Fig.49	U.S. Polymeric Adsorbents  Market, 2016 – 2026 (Thousand Liters)
      Fig.50	Canada Polymeric Adsorbents Market, 2016 – 2026 (USD Million)
      Fig.51	Canada Polymeric Adsorbents  Market, 2016 – 2026 (Thousand Liters)
      Fig.52	Europe Polymeric Adsorbents Market, 2016 – 2026 (USD Million)
      Fig.53	Europe Polymeric Adsorbents Market, 2016 – 2026 (Thousand Liters)
      Fig.54	Germany Polymeric Adsorbents Market, 2016 – 2026 (USD Million)
      Fig.55	Germany Polymeric Adsorbents  Market, 2016 – 2026 (Thousand Liters)
      Fig.56	France Polymeric Adsorbents Market, 2016 – 2026 (USD Million)
      Fig.57	France Polymeric Adsorbents  Market, 2016 – 2026 (Thousand Liters)
      Fig.58	U.K. Polymeric Adsorbents Market, 2016 – 2026 (USD Million)
      Fig.59	U.K. Polymeric Adsorbents  Market, 2016 – 2026 (Thousand Liters)
      Fig.60	Italy Polymeric Adsorbents Market, 2016 – 2026 (USD Million)
      Fig.61	Italy Polymeric Adsorbents  Market, 2016 – 2026 (Thousand Liters)
      Fig.62	Spain Polymeric Adsorbents Market, 2016 – 2026 (USD Million)
      Fig.63	Spain Polymeric Adsorbents  Market, 2016 – 2026 (Thousand Liters)
      Fig.64	Rest of Europe Polymeric Adsorbents Market, 2016 – 2026 (USD Million)
      Fig.65	Rest of Europe Polymeric Adsorbents  Market, 2016 – 2026 (Thousand Liters)
      Fig.66	Asia Pacific Polymeric Adsorbents Market, 2016 – 2026 (USD Million)
      Fig.67	Asia Pacific Polymeric Adsorbents Market, 2016 – 2026 (Thousand Liters)
      Fig.68	China Polymeric Adsorbents Market, 2016 – 2026 (USD Million)
      Fig.69	China Polymeric Adsorbents  Market, 2016 – 2026 (Thousand Liters)
      Fig.70	Japan Polymeric Adsorbents Market, 2016 – 2026 (USD Million)
      Fig.71	Japan Polymeric Adsorbents  Market, 2016 – 2026 (Thousand Liters)
      Fig.72	India Polymeric Adsorbents Market, 2016 – 2026 (USD Million)
      Fig.73	India Polymeric Adsorbents  Market, 2016 – 2026 (Thousand Liters)
      Fig.74	South  Korea Polymeric Adsorbents Market, 2016 – 2026 (USD Million)
      Fig.75	South  Korea Polymeric Adsorbents  Market, 2016 – 2026 (Thousand Liters)
      Fig.76	South-East Asia Polymeric Adsorbents Market, 2016 – 2026 (USD Million)
      Fig.77	South-East Asia Polymeric Adsorbents  Market, 2016 – 2026 (Thousand Liters)
      Fig.78	Rest of Asia Pacific Polymeric Adsorbents Market, 2016 – 2026 (USD Million)
      Fig.79	Rest of Asia Pacific Polymeric Adsorbents  Market, 2016 – 2026 (Thousand Liters)
      Fig.80	Latin America Polymeric Adsorbents Market, 2016 – 2026 (USD Million)
      Fig.81	Latin America Polymeric Adsorbents Market, 2016 – 2026 (Thousand Liters)
      Fig.82	Brazil Polymeric Adsorbents Market, 2016 – 2026 (USD Million)
      Fig.83	Brazil Polymeric Adsorbents  Market, 2016 – 2026 (Thousand Liters)
      Fig.84	Mexico Polymeric Adsorbents Market, 2016 – 2026 (USD Million)
      Fig.85	Mexico Polymeric Adsorbents  Market, 2016 – 2026 (Thousand Liters)
      Fig.86	Rest of Latin America Polymeric Adsorbents Market, 2016 – 2026 (USD Million)
      Fig.87	Rest of Latin America Polymeric Adsorbents  Market, 2016 – 2026 (Thousand Liters)
      Fig.88	The Middle-East and Africa Polymeric Adsorbents Market, 2016 – 2026 (USD Million)
      Fig.89	The Middle-East and Africa Polymeric Adsorbents Market, 2016 – 2026 (Thousand Liters)
      Fig.90	GCC Countries Polymeric Adsorbents Market, 2016 – 2026 (USD Million)
      Fig.91	GCC Countries Polymeric Adsorbents  Market, 2016 – 2026 (Thousand Liters)
      Fig.92	South Africa Polymeric Adsorbents Market, 2016 – 2026 (USD Million)
      Fig.93	South Africa Polymeric Adsorbents  Market, 2016 – 2026 (Thousand Liters)
      Fig.94	Rest of Middle-East Africa Polymeric Adsorbents Market, 2016 – 2026 (USD Million)
      Fig.95	Rest of Middle-East Africa Polymeric Adsorbents  Market, 2016 – 2026 (Thousand Liters)
      Fig.96	Global Polymeric Adsorbents Production and Consumption, 2016 – 2026 (Thousand Liters)
      Fig.97	North America Polymeric Adsorbents Production and Consumption, 2016 – 2026 (USD Million) (Thousand Liters)
      Fig.98	Europe Polymeric Adsorbents Production and Consumption, 2016 – 2026 (USD Million) (Thousand Liters)
      Fig.99	Asia Pacific Polymeric Adsorbents Production and Consumption, 2016 – 2026 (USD Million) (Thousand Liters)
      Fig.100	Latin America Polymeric Adsorbents Production and Consumption, 2016 – 2026 (USD Million) (Thousand Liters)
      Fig.101	The Middle-East and Africa Polymeric Adsorbents Production and Consumption, 2016 – 2026 (USD Million) (Thousand Liters)
      Fig.102	Competitor Market Share – Revenue
      Fig.103	Competitor Market Share – Volume
      Fig.104	Lanxess AG Revenue and Growth Rate
      Fig.105	Lanxess AG Market Share
      Fig.106	Ion Exchange (India) Ltd. Revenue and Growth Rate
      Fig.107	Ion Exchange (India) Ltd. Market Share
      Fig.108	Thermax Limited Revenue and Growth Rate
      Fig.109	Thermax Limited Market Share
      Fig.110	Amicogen (China) Biopharm Co., Ltd. Revenue and Growth Rate
      Fig.111	Amicogen (China) Biopharm Co., Ltd. Market Share
      Fig.112	Shanghai Bairy Technology Co., Ltd. Revenue and Growth Rate
      Fig.113	Shanghai Bairy Technology Co., Ltd. Market Share
      Fig.114	Canftech Inc. Revenue and Growth Rate
      Fig.115	Canftech Inc. Market Share
      Fig.116	Samyang Corporation Revenue and Growth Rate
      Fig.117	Samyang Corporation Market Share
      Fig.118	Jiangsu Kimshan New Material Co., Ltd Revenue and Growth Rate
      Fig.119	Jiangsu Kimshan New Material Co., Ltd Market Share
      Fig.120	ResinTech Inc. Revenue and Growth Rate
      Fig.121	ResinTech Inc. Market Share
      Fig.122	Tianjin NankaiHecheng Science &Technology Co., Ltd. Revenue and Growth Rate
      Fig.123	Tianjin NankaiHecheng Science &Technology Co., Ltd. Market Share
      Fig.124	DuPont de Nemours, Inc. Revenue and Growth Rate
      Fig.125	DuPont de Nemours, Inc. Market Share
      Fig.126	Purolite Revenue and Growth Rate
      Fig.127	Purolite Market Share
      Fig.128	Chemra GmbH Revenue and Growth Rate
      Fig.129	Chemra GmbH Market Share
      Fig.130	Minerals Technologies Inc. Revenue and Growth Rate
      Fig.131	Minerals Technologies Inc. Market Share
      Fig.132	Mitsubishi Chemical Corporation Revenue and Growth Rate
      Fig.133	Mitsubishi Chemical Corporation Market Share
      Fig.134	Ajinomoto Fine-Techno Co., Inc. Revenue and Growth Rate
      Fig.135	Ajinomoto Fine-Techno Co., Inc. Market Share
      Fig.136	Ningbo Zhengguang Resin Co.,Ltd. Revenue and Growth Rate
      Fig.137	Ningbo Zhengguang Resin Co.,Ltd. Market Share
      Fig.138	Suqing Group Revenue and Growth Rate
      Fig.139	Suqing Group Market Share
      Fig.140	Suzhou Bojie Resin Technology Co.,Ltd. Revenue and Growth Rate
      Fig.141	Suzhou Bojie Resin Technology Co.,Ltd. Market Share
      Fig.142	Sunresin New Materials Co Ltd Revenue and Growth Rate
      Fig.143	Sunresin New Materials Co Ltd Market Share
      Fig.144	Seppro Separation Technology LTD Revenue and Growth Rate
      Fig.145	Seppro Separation Technology LTD Market Share
      Fig.146	Jiangsu Jinkai Resin Chemical Co., Ltd. Revenue and Growth Rate
      Fig.147	Jiangsu Jinkai Resin Chemical Co., Ltd. Market Share
      Fig.148	Market Dynamics
      Fig.149	Global Polymeric Adsorbents – Value Chain Analysis
      Fig.150	Key Mandates and Regulations
      Fig.151	Technology Roadmap and Timeline
      Fig.152	Market Attractiveness Analysis – By Type
      Fig.153	Market Attractiveness Analysis – By Application
      Fig.154	Market Attractiveness Analysis – By End-User Industry
      Fig.155	Market Attractiveness Analysis – By Region
      Fig.156	Manufacturing Cost Structure of Polymeric Adsorbents
      Fig.157	Polymeric Adsorbents Industrial Chain Analysis
      Fig.158	Market Channels
      Fig.159	Marketing Channel Development Trend
      Fig.160	Growth in World Gross Product, 2008-2018 
      

      List of Tables

      Table 1	Global Polymeric Adsorbents Market, 2020 & 2026 (USD Million)
      Table 2	Global Polymeric Adsorbents Market, by Type, 2016 – 2026 (USD Million)
      Table 3	Global Polymeric Adsorbents Market, by Type, 2016 – 2026 (Thousand Liters)
      Table 4	Global Polymeric Adsorbents Market, by Application, 2016 – 2026 (USD Million)
      Table 5	Global Polymeric Adsorbents Market, by Application, 2016 – 2026 (Thousand Liters)
      Table 6	Global Polymeric Adsorbents Market, by End-User Industry, 2016 – 2026 (USD Million)
      Table 7	Global Polymeric Adsorbents Market, by End-User Industry, 2016 – 2026 (Thousand Liters)
      Table 8	Global Polymeric Adsorbents Market, by Region, 2016 – 2026 (USD Million)
      Table 9	Global Polymeric Adsorbents Market, by Region, 2016 – 2026 (Thousand Liters)
      Table 10 North America Polymeric Adsorbents Market, by Country, 2016 – 2026 (USD Million)
      Table 11 North America Polymeric Adsorbents Market, by Country, 2016 – 2026 (Thousand Liters)
      Table 12 North America Polymeric Adsorbents Market, by Type, 2016 – 2026 (USD Million)
      Table 13 North America Polymeric Adsorbents Market, by Type, 2016 – 2026 (Thousand Liters)
      Table 14 North America Polymeric Adsorbents Market, by Application, 2016 – 2026 (USD Million)
      Table 15 North America Polymeric Adsorbents Market, by Application, 2016 – 2026 (Thousand Liters)
      Table 16 North America Polymeric Adsorbents Market, by End-User Industry, 2016 – 2026 (USD Million)
      Table 17 North America Polymeric Adsorbents Market, by End-User Industry, 2016 – 2026 (Thousand Liters)
      Table 18 Europe Polymeric Adsorbents Market, by Country, 2016 – 2026 (USD Million)
      Table 19 Europe Polymeric Adsorbents Market, by Country, 2016 – 2026 (Thousand Liters)
      Table 20 Europe Polymeric Adsorbents Market, by Type, 2016 – 2026 (USD Million)
      Table 21 Europe Polymeric Adsorbents Market, by Type, 2016 – 2026 (Thousand Liters)
      Table 22 Europe Polymeric Adsorbents Market, by Application, 2016 – 2026 (USD Million)
      Table 23 Europe Polymeric Adsorbents Market, by Application, 2016 – 2026 (Thousand Liters)
      Table 24 Europe Polymeric Adsorbents Market, by End-User Industry, 2016 – 2026 (USD Million)
      Table 25 Europe Polymeric Adsorbents Market, by End-User Industry, 2016 – 2026 (Thousand Liters)
      Table 26 Asia Pacific Polymeric Adsorbents Market, by Country, 2016 – 2026 (USD Million)
      Table 27 Asia Pacific Polymeric Adsorbents Market, by Country, 2016 – 2026 (Thousand Liters)
      Table 28 Asia Pacific Polymeric Adsorbents Market, by Type, 2016 – 2026 (USD Million)
      Table 29 Asia Pacific Polymeric Adsorbents Market, by Type, 2016 – 2026 (Thousand Liters)
      Table 30 Asia Pacific Polymeric Adsorbents Market, by Application, 2016 – 2026 (USD Million)
      Table 31 Asia Pacific Polymeric Adsorbents Market, by Application, 2016 – 2026 (Thousand Liters)
      Table 32 Asia Pacific Polymeric Adsorbents Market, by End-User Industry, 2016 – 2026 (USD Million)
      Table 33 Asia Pacific Polymeric Adsorbents Market, by End-User Industry, 2016 – 2026 (Thousand Liters)
      Table 34 Latin America Polymeric Adsorbents Market, by Country, 2016 – 2026 (USD Million)
      Table 35 Latin America Polymeric Adsorbents Market, by Country, 2016 – 2026 (Thousand Liters)
      Table 36 Latin America Polymeric Adsorbents Market, by Type, 2016 – 2026 (USD Million)
      Table 37 Latin America Polymeric Adsorbents Market, by Type, 2016 – 2026 (Thousand Liters)
      Table 38 Latin America Polymeric Adsorbents Market, by Application, 2016 – 2026 (USD Million)
      Table 39 Latin America Polymeric Adsorbents Market, by Application, 2016 – 2026 (Thousand Liters)
      Table 40 Latin America Polymeric Adsorbents Market, by End-User Industry, 2016 – 2026 (USD Million)
      Table 41 Latin America Polymeric Adsorbents Market, by End-User Industry, 2016 – 2026 (Thousand Liters)
      Table 42 The Middle-East and Africa Polymeric Adsorbents Market, by Country, 2016 – 2026 (USD Million)
      Table 43 The Middle-East and Africa Polymeric Adsorbents Market, by Country, 2016 – 2026 (Thousand Liters)
      Table 44 The Middle-East and Africa Polymeric Adsorbents Market, by Type, 2016 – 2026 (USD Million)
      Table 45 The Middle-East and Africa Polymeric Adsorbents Market, by Type, 2016 – 2026 (Thousand Liters)
      Table 46 The Middle-East and Africa Polymeric Adsorbents Market, by Application, 2016 – 2026 (USD Million)
      Table 47 The Middle-East and Africa Polymeric Adsorbents Market, by Application, 2016 – 2026 (Thousand Liters)
      Table 48 The Middle-East and Africa Polymeric Adsorbents Market, by End-User Industry, 2016 – 2026 (USD Million)
      Table 49 The Middle-East and Africa Polymeric Adsorbents Market, by End-User Industry, 2016 – 2026 (Thousand Liters)
      Table 50 North America Polymeric Adsorbents Production, Consumption, Export, Import, 2016 – 2020
      Table 51 Europe Polymeric Adsorbents Production, Consumption, Export, Import, 2016 – 2020
      Table 52 Asia Pacific Polymeric Adsorbents Production, Consumption, Export, Import, 2016 – 2020
      Table 53 Latin America Polymeric Adsorbents Production, Consumption, Export, Import, 2016 – 2020
      Table 54 The Middle-East and Africa Polymeric Adsorbents Production, Consumption, Export, Import, 2016 – 2020
      Table 55 Global Polymeric Adsorbents Market - Company Revenue Analysis, 2016 – 2020 (USD Million)
      Table 56 Global Polymeric Adsorbents Market - Company Revenue Share Analysis, 2016 – 2020 (%)
      Table 57 Global Polymeric Adsorbents Market - Company Volume Analysis, 2016 – 2020 (Thousand Liters)
      Table 58 Global Polymeric Adsorbents Market - Company Volume Share Analysis, 2016 – 2020 (%)
      Table 59 Acquisitions and Mergers
      Table 60 Market Drivers – Impact Analysis
      Table 61 Market Restraints
      Table 62 Market Opportunities
      Table 63 Production Base and Market Concentration Rate of Raw Material
      Table 64 Key Suppliers of Raw Materials
      Table 65 Raw Materials Sources of Polymeric Adsorbents Major Manufacturers
      Table 66 Major Buyers of Polymeric Adsorbents
      Table 67 Distributors/Traders of Polymeric Adsorbents by Region
      

Industry Major Market Players

  • Lanxess AG
  • Ion Exchange (India) Ltd.
  • Thermax Limited
  • Amicogen (China) Biopharm Co. Ltd.
  • Shanghai Bairy Technology Co. Ltd.
  • Canftech Inc.
  • Samyang Corporation
  • Jiangsu Kimshan New Material Co. Ltd
  • ResinTech Inc.
  • Tianjin NankaiHecheng Science &Technology Co. Ltd.
  • DuPont de Nemours Inc.
  • Purolite
  • Chemra GmbH
  • Minerals Technologies Inc.
  • Mitsubishi Chemical Corporation
  • Ajinomoto Fine-Techno Co.Inc.
  • Ningbo Zhengguang Resin Co.Ltd.
  • Suqing Group
  • Suzhou Bojie Resin Technology Co.Ltd.
  • Sunresin New Materials Co Ltd
  • Seppro Separation Technology LTD
  • Jiangsu Jinkai Resin Chemical Co. Ltd