Search Market Research Report

Discover Our Latest Reports
Discover Our Featured Reports
Discover Top Selling Reports

Online Sex Toys Market Size, Share Global Analysis Report, 2021 – 2026

report img

Online Sex Toys Market by Product (Adult Vibrators, Dildos, Masturbatory, Sex Dolls Toys, Erection Rings, and Others) By Material (Metal, Plastic, Silicone, Glass, and Others), By Price Range (Mid-Range/ Economy and Premium/ Luxury), By End-User (Women and Men), By Region: Global & Regional Industry Perspective, Comprehensive Analysis, and Forecast 2021 – 2026

Industry Insights

[197+ Pages Report] According to a survey report released by Facts and Factors, the global online sex toys market was valued at USD 12,360.0 Million in 2020 and is predicted to reach USD 18,100.0 Million by the end of 2026, rising at a CAGR of nearly 5.60% between 2021 and 2026.

logoMarket Overview

Sex toys, often known as adult toys or "marriage aids," are devices that individuals use to increase the amount of pleasure they get from sex or masturbation. If someone has a sexual dysfunction or a medical condition, sex toys can sometimes be used for medicinal purposes. Sex toys come in a variety of shapes and sizes, and individuals use them for a variety of reasons. It's perfectly OK to use sex toys, but also acceptable to refrain from doing so - it's a personal choice, and everyone is different. There is no danger in using sex toys as long as they are used responsibly. Sex toys are used by a wide range of people for a variety of reasons. For some people, using sex toys is the simplest (or only) method to achieve an orgasm – this is especially true for those with vulvas. People may use sex toys to assist them in masturbating. During sex with their partners, people also utilize sex toys. Certain sex toys may assist transgender, nonbinary, or gender nonconforming persons establish their gender identity or reducing gender dysphoria.

logoIndustry Growth Factors

One of the major factors driving the popularity of sex toys is the growing number of E-commerce platforms. Despite the fact that the usage of sex toys is becoming more common in the region, the majority of consumers in North America prefer to keep their identities hidden while purchasing sex toys. Customers can disguise their identities when purchasing such items on an online or E-commerce platform, which has led to a surge in the purchase of sex toys. Furthermore, due to the significant market potential, a large number of industry participants are aggressively joining the market.During the projected period, the market is likely to be driven by increased spending capacity and a better quality of life in developing economies. Adult novelty items are becoming more widespread in the sexual health sector, increasing appeal among people of all ages. The acceptance of the LGBTQ population, as well as a growing desire among women in experimenting with sexual health products without trepidation, is boosting product uptake and thereby driving the market. Liberalization, social media penetration, and the impact of pop culture have all contributed to a greater awareness of the significance of sexual health.

logoSegmentation Analysis

The global online sex toys market is segregated based on product, material, price range, end-user, and region.

Adult vibrators, dildos, masturbatory, sex dolls toys, erection rings, and others make up the product segment of the global online sex toys industry. Based on material type, the global online sex toys industry is categorized into metal, plastic, silicone, glass, and others. Mid-range/ economy and premium/ luxury are the price range segment of the global online sex toys market. Based on end-user type, the industry is segmented into women and men.

logoReport Scope

Report Attribute

Details

Market Size in 2020

USD 12,360.0 Million

Projected Market Size in 2026

USD 18,100.0 Million

CAGR Growth Rate

5.60%

Base Year

2020

Forecast Years

2021-2026

Key Market Players

California Exotic Novelties, LLC, Church and Dwight Co. Inc., Doc Johnson Enterprises, FUN FACTORY GmbH, Kanojo Toys, LELOi AB, and Others

Key Segments

Product Type, Material, Price Range, End-User, and Region

Major Regions Covered

North America, Europe, Asia Pacific, Latin America, and Middle East & Africa

Purchase Options

Request customized purchase options to meet your research needs. Explore purchase options

logo Regional Analysis

The global online sex toys market is divided into four regions based on geographical analysis: North America, Europe, Asia Pacific, Latin America, and The Middle East and Africa. North America dominated the market, accounting for 33.8% of total sales in the sex toys industry. This is due to the existence of various producers and merchants that make items easily accessible. According to a poll done in the United States, 53.0% of people use sex toys to improve their sexual experience. During the projection period, demand for adult novelty goods is anticipated to rise due to increased social acceptability and a more liberal sexual lifestyle in the United States and Canada, as well as the presence of various adult stores.

Online Sex Toys Market

To know more about this report | Request Free Sample Copy

logo Competitive Players

Some main participants of the global online sex toys market are

  • California Exotic Novelties
  • LLC
  • Church and Dwight Co. Inc.
  • Doc Johnson Enterprises
  • FUN FACTORY GmbH
  • Kanojo Toys
  • LELOi AB
  • LifeStyles Healthcare Pte Ltd.
  • Lovehoney Group Ltd.
  • Luvu Brands Inc.
  • Meiki Toys.com
  • MS Factory
  • Naughty Nights
  • PrivyPleasures.com
  • Reckitt Benckiser Group Plc
  • TENGA Co. Ltd.
  • TOMAX USA

logo By Product Type

  • Adult Vibrators
  • Dildos
  • Erection Rings
  • Masturbators
  • Sex Dolls Toys
  • Others

logo By Material

  • Metal
  • Silicone
  • Plastic
  • Glass
  • Others

logo By Price Range

  • Premium/ Luxury
  • Mid-Range/ Economy

logo By End-User

  • Premium/ Luxury
  • Mid-Range/ Economy

logo By Region

  • North America
    • The U.S.
    • Canada
  • Europe
    • France
    • The UK
    • Spain
    • Germany
    • Italy
    • Rest of Europe
  • Asia Pacific
    • China
    • Japan
    • India
    • South Korea
    • Southeast Asia
    • Rest of Asia Pacific
  • Latin America
    • Brazil
    • Mexico
    • Rest of Latin America
  • Middle East & Africa
    • GCC Countries
    • South Africa
    • Rest of the Middle East & Africa

Table of Content

  1. Chapter 1 Executive Summary
    1. 1.1. Introduction of Online Sex Toys
    2. 1.2. Global Online Sex Toys Market, 2020 & 2026 (USD Million)
    3. 1.3. Global Online Sex Toys Market, 2016 – 2026 (USD Million) (K Units)
    4. 1.4. Global Online Sex Toys Market Absolute Revenue Opportunity, 2016 – 2026 (USD Million)
    5. 1.5. Global Online Sex Toys Market Incremental Revenue Opportunity, 2020 – 2026 (USD Million)
  2. Chapter 2 Online Sex Toys Market – Product Type Analysis
    1. 2.1. Global Online Sex Toys Market – Product Type Overview
    2. 2.2. Global Online Sex Toys Market Share, by Product Type, 2020 & 2026 (USD Million)
    3. 2.3. Global Online Sex Toys Market share, by Product Type, 2020 & 2026 (K Units)
    4. 2.4. Adult Vibrators
      1. 2.4.1. Global Adult Vibrators Online Sex Toys Market, 2016 – 2026 (USD Million)
      2. 2.4.2. Global Adult Vibrators Online Sex Toys Market, 2016 – 2026 (K Units)
    5. 2.5. Dildos
      1. 2.5.1. Global Dildos Online Sex Toys Market, 2016 – 2026 (USD Million)
      2. 2.5.2. Global Dildos Online Sex Toys Market, 2016 – 2026 (K Units)
    6. 2.6. Erection Rings
      1. 2.6.1. Global Erection Rings Online Sex Toys Market, 2016 – 2026 (USD Million)
      2. 2.6.2. Global Erection Rings Online Sex Toys Market, 2016 – 2026 (K Units)
    7. 2.7. Masturbators
      1. 2.7.1. Global Masturbators Online Sex Toys Market, 2016 – 2026 (USD Million)
      2. 2.7.2. Global Masturbators Online Sex Toys Market, 2016 – 2026 (K Units)
    8. 2.8. Sex Dolls Toys
      1. 2.8.1. Global Sex Dolls Toys Online Sex Toys Market, 2016 – 2026 (USD Million)
      2. 2.8.2. Global Sex Dolls Toys Online Sex Toys Market, 2016 – 2026 (K Units)
    9. 2.9. Others
      1. 2.9.1. Global Others Online Sex Toys Market, 2016 – 2026 (USD Million)
      2. 2.9.2. Global Others Online Sex Toys Market, 2016 – 2026 (K Units)
  3. Chapter 3 Online Sex Toys Market – Material Analysis
    1. 3.1. Global Online Sex Toys Market – Material Overview
    2. 3.2. Global Online Sex Toys Market Share, by Material, 2020 & 2026 (USD Million)
    3. 3.3. Global Online Sex Toys Market share, by Material, 2020 & 2026 (K Units)
    4. 3.4. Metal
      1. 3.4.1. Global Metal Online Sex Toys Market, 2016 – 2026 (USD Million)
      2. 3.4.2. Global Metal Online Sex Toys Market, 2016 – 2026 (K Units)
    5. 3.5. Silicone
      1. 3.5.1. Global Silicone Online Sex Toys Market, 2016 – 2026 (USD Million)
      2. 3.5.2. Global Silicone Online Sex Toys Market, 2016 – 2026 (K Units)
    6. 3.6. Plastic
      1. 3.6.1. Global Plastic Online Sex Toys Market, 2016 – 2026 (USD Million)
      2. 3.6.2. Global Plastic Online Sex Toys Market, 2016 – 2026 (K Units)
    7. 3.7. Glass
      1. 3.7.1. Global Glass Online Sex Toys Market, 2016 – 2026 (USD Million)
      2. 3.7.2. Global Glass Online Sex Toys Market, 2016 – 2026 (K Units)
    8. 3.8. Others
      1. 3.8.1. Global Others Online Sex Toys Market, 2016 – 2026 (USD Million)
      2. 3.8.2. Global Others Online Sex Toys Market, 2016 – 2026 (K Units)
  4. Chapter 4 Online Sex Toys Market – Price Range Analysis
    1. 4.1. Global Online Sex Toys Market – Price Range Overview
    2. 4.2. Global Online Sex Toys Market Share, by Price Range, 2020 & 2026 (USD Million)
    3. 4.3. Global Online Sex Toys Market share, by Price Range, 2020 & 2026 (K Units)
    4. 4.4. Premium/ Luxury
      1. 4.4.1. Global Premium/ Luxury Online Sex Toys Market, 2016 – 2026 (USD Million)
      2. 4.4.2. Global Premium/ Luxury Online Sex Toys Market, 2016 – 2026 (K Units)
    5. 4.5. Mid-Range/ Economy
      1. 4.5.1. Global Mid-Range/ Economy Online Sex Toys Market, 2016 – 2026 (USD Million)
      2. 4.5.2. Global Mid-Range/ Economy Online Sex Toys Market, 2016 – 2026 (K Units)
  5. Chapter 5 Online Sex Toys Market – End-User Analysis
    1. 5.1. Global Online Sex Toys Market – End-User Overview
    2. 5.2. Global Online Sex Toys Market Share, by End-User, 2020 & 2026 (USD Million)
    3. 5.3. Global Online Sex Toys Market share, by End-User, 2020 & 2026 (K Units)
    4. 5.4. Men
      1. 5.4.1. Global Men Online Sex Toys Market, 2016 – 2026 (USD Million)
      2. 5.4.2. Global Men Online Sex Toys Market, 2016 – 2026 (K Units)
    5. 5.5. Women
      1. 5.5.1. Global Women Online Sex Toys Market, 2016 – 2026 (USD Million)
      2. 5.5.2. Global Women Online Sex Toys Market, 2016 – 2026 (K Units)
  6. Chapter 6 Online Sex Toys Market – Regional Analysis
    1. 6.1. Global Online Sex Toys Market Regional Overview
    2. 6.2. Global Online Sex Toys Market Share, by Region, 2020 & 2026 (USD Million)
    3. 6.3. Global Online Sex Toys Market Share, by Region, 2020 & 2026 (K Units)
    4. 6.4. North America
      1. 6.4.1. North America Online Sex Toys Market, 2016 – 2026 (USD Million)
        1. 6.4.1.1. North America Online Sex Toys Market, by Country, 2016 – 2026 (USD Million)
      2. 6.4.2. North America Market, 2016 – 2026 (K Units)
        1. 6.4.2.1. North America Online Sex Toys Market, by Country, 2016 – 2026 (K Units)
      3. 6.4.3. North America Online Sex Toys Market, by Product Type, 2016 – 2026
        1. 6.4.3.1. North America Online Sex Toys Market, by Product Type, 2016 – 2026 (USD Million)
        2. 6.4.3.2. North America Online Sex Toys Market, by Product Type, 2016 – 2026 (K Units)
      4. 6.4.4. North America Online Sex Toys Market, by Material, 2016 – 2026
        1. 6.4.4.1. North America Online Sex Toys Market, by Material, 2016 – 2026 (USD Million)
        2. 6.4.4.2. North America Online Sex Toys Market, by Material, 2016 – 2026 (K Units)
      5. 6.4.5. North America Online Sex Toys Market, by Price Range, 2016 – 2026
        1. 6.4.5.1. North America Online Sex Toys Market, by Price Range, 2016 – 2026 (USD Million)
        2. 6.4.5.2. North America Online Sex Toys Market, by Price Range, 2016 – 2026 (K Units)
      6. 6.4.6. North America Online Sex Toys Market, by End-User, 2016 – 2026
        1. 6.4.6.1. North America Online Sex Toys Market, by End-User, 2016 – 2026 (USD Million)
        2. 6.4.6.2. North America Online Sex Toys Market, by End-User, 2016 – 2026 (K Units)
      7. 6.4.7. U.S.
        1. 6.4.7.1. U.S. Online Sex Toys Market, 2016 – 2026 (USD Million)
        2. 6.4.7.2. U.S. Online Sex Toys Market, 2016 – 2026 (K Units)
      8. 6.4.8. Canada
        1. 6.4.8.1. Canada Online Sex Toys Market, 2016 – 2026 (USD Million)
        2. 6.4.8.2. Canada Online Sex Toys Market, 2016 – 2026 (K Units)
    5. 6.5. Europe
      1. 6.5.1. Europe Online Sex Toys Market, 2016 – 2026 (USD Million)
        1. 6.5.1.1. Europe Online Sex Toys Market, by Country, 2016 – 2026 (USD Million)
      2. 6.5.2. Europe Market, 2016 – 2026 (K Units)
        1. 6.5.2.1. Europe Online Sex Toys Market, by Country, 2016 – 2026 (K Units)
      3. 6.5.3. Europe Online Sex Toys Market, by Product Type, 2016 – 2026
        1. 6.5.3.1. Europe Online Sex Toys Market, by Product Type, 2016 – 2026 (USD Million)
        2. 6.5.3.2. Europe Online Sex Toys Market, by Product Type, 2016 – 2026 (K Units)
      4. 6.5.4. Europe Online Sex Toys Market, by Material, 2016 – 2026
        1. 6.5.4.1. Europe Online Sex Toys Market, by Material, 2016 – 2026 (USD Million)
        2. 6.5.4.2. Europe Online Sex Toys Market, by Material, 2016 – 2026 (K Units)
      5. 6.5.5. Europe Online Sex Toys Market, by Price Range, 2016 – 2026
        1. 6.5.5.1. Europe Online Sex Toys Market, by Price Range, 2016 – 2026 (USD Million)
        2. 6.5.5.2. Europe Online Sex Toys Market, by Price Range, 2016 – 2026 (K Units)
      6. 6.5.6. Europe Online Sex Toys Market, by End-User, 2016 – 2026
        1. 6.5.6.1. Europe Online Sex Toys Market, by End-User, 2016 – 2026 (USD Million)
        2. 6.5.6.2. Europe Online Sex Toys Market, by End-User, 2016 – 2026 (K Units)
      7. 6.5.7. Germany
        1. 6.5.7.1. Germany Online Sex Toys Market, 2016 – 2026 (USD Million)
        2. 6.5.7.2. Germany Online Sex Toys Market, 2016 – 2026 (K Units)
      8. 6.5.8. France
        1. 6.5.8.1. France Online Sex Toys Market, 2016 – 2026 (USD Million)
        2. 6.5.8.2. France Online Sex Toys Market, 2016 – 2026 (K Units)
      9. 6.5.9. U.K.
        1. 6.5.9.1. U.K. Online Sex Toys Market, 2016 – 2026 (USD Million)
        2. 6.5.9.2. U.K. Online Sex Toys Market, 2016 – 2026 (K Units)
      10. 6.5.10. Italy
        1. 6.5.10.1. Italy Online Sex Toys Market, 2016 – 2026 (USD Million)
        2. 6.5.10.2. Italy Online Sex Toys Market, 2016 – 2026 (K Units)
      11. 6.5.11. Spain
        1. 6.5.11.1. Spain Online Sex Toys Market, 2016 – 2026 (USD Million)
        2. 6.5.11.2. Spain Online Sex Toys Market, 2016 – 2026 (K Units)
      12. 6.5.12. Rest of Europe
        1. 6.5.12.1. Rest of Europe Online Sex Toys Market, 2016 – 2026 (USD Million)
        2. 6.5.12.2. Rest of Europe Online Sex Toys Market, 2016 – 2026 (K Units)
    6. 6.6. Asia Pacific
      1. 6.6.1. Asia Pacific Online Sex Toys Market, 2016 – 2026 (USD Million)
        1. 6.6.1.1. Asia Pacific Online Sex Toys Market, by Country, 2016 – 2026 (USD Million)
      2. 6.6.2. Asia Pacific Market, 2016 – 2026 (K Units)
        1. 6.6.2.1. Asia Pacific Online Sex Toys Market, by Country, 2016 – 2026 (K Units)
      3. 6.6.3. Asia Pacific Online Sex Toys Market, by Product Type, 2016 – 2026
        1. 6.6.3.1. Asia Pacific Online Sex Toys Market, by Product Type, 2016 – 2026 (USD Million)
        2. 6.6.3.2. Asia Pacific Online Sex Toys Market, by Product Type, 2016 – 2026 (K Units)
      4. 6.6.4. Asia Pacific Online Sex Toys Market, by Material, 2016 – 2026
        1. 6.6.4.1. Asia Pacific Online Sex Toys Market, by Material, 2016 – 2026 (USD Million)
        2. 6.6.4.2. Asia Pacific Online Sex Toys Market, by Material, 2016 – 2026 (K Units)
      5. 6.6.5. Asia Pacific Online Sex Toys Market, by Price Range, 2016 – 2026
        1. 6.6.5.1. Asia Pacific Online Sex Toys Market, by Price Range, 2016 – 2026 (USD Million)
        2. 6.6.5.2. Asia Pacific Online Sex Toys Market, by Price Range, 2016 – 2026 (K Units)
      6. 6.6.6. Asia Pacific Online Sex Toys Market, by End-User, 2016 – 2026
        1. 6.6.6.1. Asia Pacific Online Sex Toys Market, by End-User, 2016 – 2026 (USD Million)
        2. 6.6.6.2. Asia Pacific Online Sex Toys Market, by End-User, 2016 – 2026 (K Units)
      7. 6.6.7. China
        1. 6.6.7.1. China Online Sex Toys Market, 2016 – 2026 (USD Million)
        2. 6.6.7.2. China Online Sex Toys Market, 2016 – 2026 (K Units)
      8. 6.6.8. Japan
        1. 6.6.8.1. Japan Online Sex Toys Market, 2016 – 2026 (USD Million)
        2. 6.6.8.2. Japan Online Sex Toys Market, 2016 – 2026 (K Units)
      9. 6.6.9. India
        1. 6.6.9.1. India Online Sex Toys Market, 2016 – 2026 (USD Million)
        2. 6.6.9.2. India Online Sex Toys Market, 2016 – 2026 (K Units)
      10. 6.6.10. South Korea
        1. 6.6.10.1. South Korea Online Sex Toys Market, 2016 – 2026 (USD Million)
        2. 6.6.10.2. South Korea Online Sex Toys Market, 2016 – 2026 (K Units)
      11. 6.6.11. South-East Asia
        1. 6.6.11.1. South-East Asia Online Sex Toys Market, 2016 – 2026 (USD Million)
        2. 6.6.11.2. South-East Asia Online Sex Toys Market, 2016 – 2026 (K Units)
      12. 6.6.12. Rest of Asia Pacific
        1. 6.6.12.1. Rest of Asia Pacific Online Sex Toys Market, 2016 – 2026 (USD Million)
        2. 6.6.12.2. Rest of Asia Pacific Online Sex Toys Market, 2016 – 2026 (K Units)
    7. 6.7. Latin America
      1. 6.7.1. Latin America Online Sex Toys Market, 2016 – 2026 (USD Million)
        1. 6.7.1.1. Latin America Online Sex Toys Market, by Country, 2016 – 2026 (USD Million)
      2. 6.7.2. Latin America Market, 2016 – 2026 (K Units)
        1. 6.7.2.1. Latin America Online Sex Toys Market, by Country, 2016 – 2026 (K Units)
      3. 6.7.3. Latin America Online Sex Toys Market, by Product Type, 2016 – 2026
        1. 6.7.3.1. Latin America Online Sex Toys Market, by Product Type, 2016 – 2026 (USD Million)
        2. 6.7.3.2. Latin America Online Sex Toys Market, by Product Type, 2016 – 2026 (K Units)
      4. 6.7.4. Latin America Online Sex Toys Market, by Material, 2016 – 2026
        1. 6.7.4.1. Latin America Online Sex Toys Market, by Material, 2016 – 2026 (USD Million)
        2. 6.7.4.2. Latin America Online Sex Toys Market, by Material, 2016 – 2026 (K Units)
      5. 6.7.5. Latin America Online Sex Toys Market, by Price Range, 2016 – 2026
        1. 6.7.5.1. Latin America Online Sex Toys Market, by Price Range, 2016 – 2026 (USD Million)
        2. 6.7.5.2. Latin America Online Sex Toys Market, by Price Range, 2016 – 2026 (K Units)
      6. 6.7.6. Latin America Online Sex Toys Market, by End-User, 2016 – 2026
        1. 6.7.6.1. Latin America Online Sex Toys Market, by End-User, 2016 – 2026 (USD Million)
        2. 6.7.6.2. Latin America Online Sex Toys Market, by End-User, 2016 – 2026 (K Units)
      7. 6.7.7. Brazil
        1. 6.7.7.1. Brazil Online Sex Toys Market, 2016 – 2026 (USD Million)
        2. 6.7.7.2. Brazil Online Sex Toys Market, 2016 – 2026 (K Units)
      8. 6.7.8. Mexico
        1. 6.7.8.1. Mexico Online Sex Toys Market, 2016 – 2026 (USD Million)
        2. 6.7.8.2. Mexico Online Sex Toys Market, 2016 – 2026 (K Units)
      9. 6.7.9. Rest of Latin America
        1. 6.7.9.1. Rest of Latin America Online Sex Toys Market, 2016 – 2026 (USD Million)
        2. 6.7.9.2. Rest of Latin America Online Sex Toys Market, 2016 – 2026 (K Units)
    8. 6.8. The Middle-East and Africa
      1. 6.8.1. The Middle-East and Africa Online Sex Toys Market, 2016 – 2026 (USD Million)
        1. 6.8.1.1. The Middle-East and Africa Online Sex Toys Market, by Country, 2016 – 2026 (USD Million)
      2. 6.8.2. The Middle-East and Africa Market, 2016 – 2026 (K Units)
        1. 6.8.2.1. The Middle-East and Africa Online Sex Toys Market, by Country, 2016 – 2026 (K Units)
      3. 6.8.3. The Middle-East and Africa Online Sex Toys Market, by Product Type, 2016 – 2026
        1. 6.8.3.1. The Middle-East and Africa Online Sex Toys Market, by Product Type, 2016 – 2026 (USD Million)
        2. 6.8.3.2. The Middle-East and Africa Online Sex Toys Market, by Product Type, 2016 – 2026 (K Units)
      4. 6.8.4. The Middle-East and Africa Online Sex Toys Market, by Material, 2016 – 2026
        1. 6.8.4.1. The Middle-East and Africa Online Sex Toys Market, by Material, 2016 – 2026 (USD Million)
        2. 6.8.4.2. The Middle-East and Africa Online Sex Toys Market, by Material, 2016 – 2026 (K Units)
      5. 6.8.5. The Middle-East and Africa Online Sex Toys Market, by Price Range, 2016 – 2026
        1. 6.8.5.1. The Middle-East and Africa Online Sex Toys Market, by Price Range, 2016 – 2026 (USD Million)
        2. 6.8.5.2. The Middle-East and Africa Online Sex Toys Market, by Price Range, 2016 – 2026 (K Units)
      6. 6.8.6. The Middle-East and Africa Online Sex Toys Market, by End-User, 2016 – 2026
        1. 6.8.6.1. The Middle-East and Africa Online Sex Toys Market, by End-User, 2016 – 2026 (USD Million)
        2. 6.8.6.2. The Middle-East and Africa Online Sex Toys Market, by End-User, 2016 – 2026 (K Units)
      7. 6.8.7. GCC Countries
        1. 6.8.7.1. GCC Countries Online Sex Toys Market, 2016 – 2026 (USD Million)
        2. 6.8.7.2. GCC Countries Online Sex Toys Market, 2016 – 2026 (K Units)
      8. 6.8.8. South Africa
        1. 6.8.8.1. South Africa Online Sex Toys Market, 2016 – 2026 (USD Million)
        2. 6.8.8.2. South Africa Online Sex Toys Market, 2016 – 2026 (K Units)
      9. 6.8.9. Rest of Middle-East Africa
        1. 6.8.9.1. Rest of Middle-East Africa Online Sex Toys Market, 2016 – 2026 (USD Million)
        2. 6.8.9.2. Rest of Middle-East Africa Online Sex Toys Market, 2016 – 2026 (K Units)
  7. Chapter 7 Online Sex Toys Production, Consumption, Export, Import by Regions
    1. 7.1. Global Online Sex Toys Production and Consumption, 2016 – 2026 (K Units)
    2. 7.2. Global Import and Export Analysis, by Region
  8. Chapter 8 Online Sex Toys Market – Competitive Landscape
    1. 8.1. Competitor Market Share – Revenue
    2. 8.2. Market Concentration Rate Analysis, Top 3 and Top 5 Players
    3. 8.3. Competitor Market Share – Volume
    4. 8.4. Strategic Developments
      1. 8.4.1. Acquisitions and Mergers
      2. 8.4.2. New Products
      3. 8.4.3. Research & Development Activities
  9. Chapter 9 Company Profiles
    1. 9.1. California Exotic Novelties, LLC
      1. 9.1.1. Company Overview
      2. 9.1.2. Product/Service Portfolio
      3. 9.1.3. California Exotic Novelties, LLC Sales, Revenue, Price, and Gross Margin
      4. 9.1.4. California Exotic Novelties, LLC Revenue and Growth Rate
      5. 9.1.5. California Exotic Novelties, LLC Market Share
      6. 9.1.6. Recent Initiatives, Funding/VC Activities, and Technological Innovations
    2. 9.2. Church and Dwight Co. Inc.
      1. 9.2.1. Company Overview
      2. 9.2.2. Product/Service Portfolio
      3. 9.2.3. Church and Dwight Co. Inc. Sales, Revenue, Price, and Gross Margin
      4. 9.2.4. Church and Dwight Co. Inc. Revenue and Growth Rate
      5. 9.2.5. Church and Dwight Co. Inc. Market Share
      6. 9.2.6. Recent Initiatives, Funding/VC Activities, and Technological Innovations
    3. 9.3. Doc Johnson Enterprises
      1. 9.3.1. Company Overview
      2. 9.3.2. Product/Service Portfolio
      3. 9.3.3. Doc Johnson Enterprises Sales, Revenue, Price, and Gross Margin
      4. 9.3.4. Doc Johnson Enterprises Revenue and Growth Rate
      5. 9.3.5. Doc Johnson Enterprises Market Share
      6. 9.3.6. Recent Initiatives, Funding/VC Activities, and Technological Innovations
    4. 9.4. FUN FACTORY GmbH
      1. 9.4.1. Company Overview
      2. 9.4.2. Product/Service Portfolio
      3. 9.4.3. FUN FACTORY GmbH Sales, Revenue, Price, and Gross Margin
      4. 9.4.4. FUN FACTORY GmbH Revenue and Growth Rate
      5. 9.4.5. FUN FACTORY GmbH Market Share
      6. 9.4.6. Recent Initiatives, Funding/VC Activities, and Technological Innovations
    5. 9.5. Kanojo Toys
      1. 9.5.1. Company Overview
      2. 9.5.2. Product/Service Portfolio
      3. 9.5.3. Kanojo Toys Sales, Revenue, Price, and Gross Margin
      4. 9.5.4. Kanojo Toys Revenue and Growth Rate
      5. 9.5.5. Kanojo Toys Market Share
      6. 9.5.6. Recent Initiatives, Funding/VC Activities, and Technological Innovations
    6. 9.6. LELOi AB
      1. 9.6.1. Company Overview
      2. 9.6.2. Product/Service Portfolio
      3. 9.6.3. LELOi AB Sales, Revenue, Price, and Gross Margin
      4. 9.6.4. LELOi AB Revenue and Growth Rate
      5. 9.6.5. LELOi AB Market Share
      6. 9.6.6. Recent Initiatives, Funding/VC Activities, and Technological Innovations
    7. 9.7. LifeStyles Healthcare Pte Ltd.
      1. 9.7.1. Company Overview
      2. 9.7.2. Product/Service Portfolio
      3. 9.7.3. LifeStyles Healthcare Pte Ltd. Sales, Revenue, Price, and Gross Margin
      4. 9.7.4. LifeStyles Healthcare Pte Ltd. Revenue and Growth Rate
      5. 9.7.5. LifeStyles Healthcare Pte Ltd. Market Share
      6. 9.7.6. Recent Initiatives, Funding/VC Activities, and Technological Innovations
    8. 9.8. Lovehoney Group Ltd.
      1. 9.8.1. Company Overview
      2. 9.8.2. Product/Service Portfolio
      3. 9.8.3. Lovehoney Group Ltd. Sales, Revenue, Price, and Gross Margin
      4. 9.8.4. Lovehoney Group Ltd. Revenue and Growth Rate
      5. 9.8.5. Lovehoney Group Ltd. Market Share
      6. 9.8.6. Recent Initiatives, Funding/VC Activities, and Technological Innovations
    9. 9.9. Luvu Brands Inc.
      1. 9.9.1. Company Overview
      2. 9.9.2. Product/Service Portfolio
      3. 9.9.3. Luvu Brands Inc. Sales, Revenue, Price, and Gross Margin
      4. 9.9.4. Luvu Brands Inc. Revenue and Growth Rate
      5. 9.9.5. Luvu Brands Inc. Market Share
      6. 9.9.6. Recent Initiatives, Funding/VC Activities, and Technological Innovations
    10. 9.10. Meiki Toys.com
      1. 9.10.1. Company Overview
      2. 9.10.2. Product/Service Portfolio
      3. 9.10.3. Meiki Toys.com Sales, Revenue, Price, and Gross Margin
      4. 9.10.4. Meiki Toys.com Revenue and Growth Rate
      5. 9.10.5. Meiki Toys.com Market Share
      6. 9.10.6. Recent Initiatives, Funding/VC Activities, and Technological Innovations
    11. 9.11. MS Factory
      1. 9.11.1. Company Overview
      2. 9.11.2. Product/Service Portfolio
      3. 9.11.3. MS Factory Sales, Revenue, Price, and Gross Margin
      4. 9.11.4. MS Factory Revenue and Growth Rate
      5. 9.11.5. MS Factory Market Share
      6. 9.11.6. Recent Initiatives, Funding/VC Activities, and Technological Innovations
    12. 9.12. Naughty Nights
      1. 9.12.1. Company Overview
      2. 9.12.2. Product/Service Portfolio
      3. 9.12.3. Naughty Nights Sales, Revenue, Price, and Gross Margin
      4. 9.12.4. Naughty Nights Revenue and Growth Rate
      5. 9.12.5. Naughty Nights Market Share
      6. 9.12.6. Recent Initiatives, Funding/VC Activities, and Technological Innovations
      7. 9.13. PrivyPleasures.com
      8. 9.13.1. Company Overview
      9. 9.13.2. Product/Service Portfolio
        1. 9.13.3. PrivyPleasures.com Sales, Revenue, Price, and Gross Margin
        2. 9.13.4. PrivyPleasures.com Revenue and Growth Rate
        3. 9.13.5. PrivyPleasures.com Market Share
      10. 9.13.6. Recent Initiatives, Funding/VC Activities, and Technological Innovations
    13. 9.14. Reckitt Benckiser Group Plc
      1. 9.14.1. Company Overview
      2. 9.14.2. Product/Service Portfolio
      3. 9.14.3. Reckitt Benckiser Group Plc Sales, Revenue, Price, and Gross Margin
      4. 9.14.4. Reckitt Benckiser Group Plc Revenue and Growth Rate
      5. 9.14.5. Reckitt Benckiser Group Plc Market Share
      6. 9.14.6. Recent Initiatives, Funding/VC Activities, and Technological Innovations
    14. 9.15. TENGA Co. Ltd.
      1. 9.15.1. Company Overview
      2. 9.15.2. Product/Service Portfolio
      3. 9.15.3. TENGA Co. Ltd. Sales, Revenue, Price, and Gross Margin
      4. 9.15.4. TENGA Co. Ltd. Revenue and Growth Rate
      5. 9.15.5. TENGA Co. Ltd. Market Share
      6. 9.15.6. Recent Initiatives, Funding/VC Activities, and Technological Innovations
    15. 9.16. TOMAX USA
      1. 9.16.1. Company Overview
      2. 9.16.2. Product/Service Portfolio
      3. 9.16.3. TOMAX USA Sales, Revenue, Price, and Gross Margin
      4. 9.16.4. TOMAX USA Revenue and Growth Rate
      5. 9.16.5. TOMAX USA Market Share
      6. 9.16.6. Recent Initiatives, Funding/VC Activities, and Technological Innovations
    16. 9.17. Others
      1. 9.17.1. Company Overview
      2. 9.17.2. Product/Service Portfolio
      3. 9.17.3. Others Sales, Revenue, Price, and Gross Margin
      4. 9.17.4. Others Revenue and Growth Rate
      5. 9.17.5. Others Market Share
      6. 9.17.6. Recent Initiatives, Funding/VC Activities, and Technological Innovations
  10. Chapter 10 Online Sex Toys — Industry Analysis
    1. 10.1. Introduction and Taxonomy
    2. 10.2. Online Sex Toys Market – Key Trends
      1. 10.2.1. Market Drivers
      2. 10.2.2. Market Restraints
      3. 10.2.3. Market Opportunities
    3. 10.3. Value Chain Analysis
    4. 10.4. Key Mandates and Regulations
    5. 10.5. Technology Roadmap and Timeline
    6. 10.6. Online Sex Toys Market – Attractiveness Analysis
      1. 10.6.1. By Product Type
      2. 10.6.2. By Material
      3. 10.6.3. By Price Range
      4. 10.6.4. By End-User
      5. 10.6.5. By Region
  11. Chapter 11 Raw Material Analysis
    1. 11.1. Online Sex Toys Key Raw Material Analysis
      1. 11.1.1. Key Raw Materials
      2. 11.1.2. Price Trend of Key Raw Materials
    2. 11.2. Key Suppliers of Raw Materials
    3. 11.3. Proportion of Manufacturing Cost Structure
      1. 11.3.1. Raw Materials Cost
      2. 11.3.2. Labor Cost
      3. 11.3.3. Manufacturing Expenses
      4. 11.3.4. Miscellaneous Expenses
    4. 11.4. Manufacturing Cost Analysis of Online Sex Toys
  12. Chapter 12 Industrial Chain, Sourcing Strategy, and Downstream Buyers
    1. 12.1. Online Sex Toys Industrial Chain Analysis
    2. 12.2. Upstream Raw Materials Sourcing
      1. 12.2.1. Risk Mitigation:
      2. 12.2.2. Supplier Relationships:
      3. 12.2.3. Business Processes:
      4. 12.2.4. Securing the Product:
    3. 12.3. Raw Materials Sources of Online Sex Toys Major Manufacturers
    4. 12.4. Downstream Buyers
    5. 12.5. Distributors/Traders List
  13. Chapter 13 Marketing Strategy Analysis, Distributors
    1. 13.1. Marketing Channel
    2. 13.2. Direct Marketing
    3. 13.3. Indirect Marketing
    4. 13.4. Marketing Channel Development Trends
    5. 13.5. Economic/Political Environmental Change
  14. Chapter 14 Report Conclusion & Key Insights
    1. 14.1. Key Insights from Primary Interviews & Surveys Respondents
    2. 14.2. Key Takeaways from Analysts, Consultants, and Industry Leaders
  15. Chapter 15 Research Approach & Methodology
    1. 15.1. Report Description
    2. 15.2. Research Scope
    3. 15.3. Research Methodology
      1. 15.3.1. Secondary Research
      2. 15.3.2. Primary Research
      3. 15.3.3. Statistical Models
        1. 15.3.3.1. Company Share Analysis Model
        2. 15.3.3.2. Revenue Based Modeling
      4. 15.3.4. Research Limitations

      List of Figures

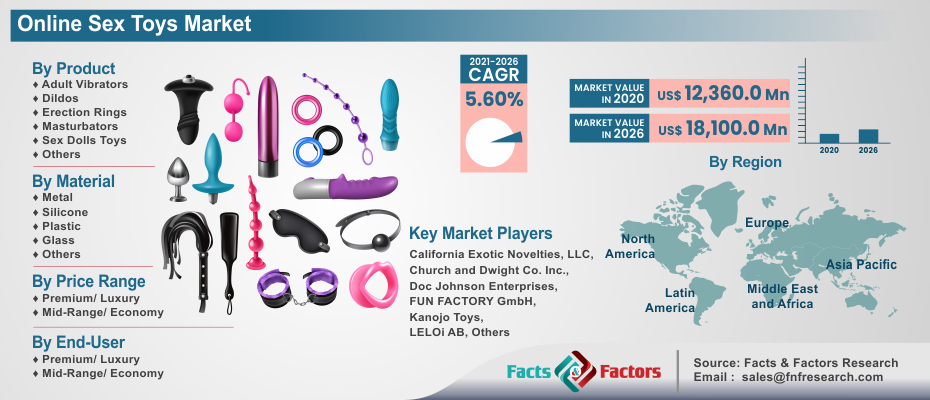
      Fig.1	Product Picture of Online Sex Toys
      Fig.2	Global Online Sex Toys Market, 2016 – 2026 (USD Million)
      Fig.3	Global Online Sex Toys Market, 2016 – 2026 (K Units)
      Fig.4	Global Online Sex Toys Market Absolute Revenue Opportunity, 2016 – 2026 (USD Million)
      Fig.5	Global Online Sex Toys Market Incremental Revenue Opportunity, 2020 – 2026 (USD Million)
      Fig.6	Global Online Sex Toys Market Share, by Product Type, 2020 & 2026 (USD Million)
      Fig.7	Global Online Sex Toys Market Share, by Product Type, 2020 & 2026 (K Units)
      Fig.8	Global Adult Vibrators Online Sex Toys Market, 2016 – 2026 (USD Million)
      Fig.9	Global Adult Vibrators Online Sex Toys Market, 2016 – 2026 (K Units)
      Fig.10	Global Dildos Online Sex Toys Market, 2016 – 2026 (USD Million)
      Fig.11	Global Dildos Online Sex Toys Market, 2016 – 2026 (K Units)
      Fig.12	Global Erection Rings Online Sex Toys Market, 2016 – 2026 (USD Million)
      Fig.13	Global Erection Rings Online Sex Toys Market, 2016 – 2026 (K Units)
      Fig.14	Global Masturbators Online Sex Toys Market, 2016 – 2026 (USD Million)
      Fig.15	Global Masturbators Online Sex Toys Market, 2016 – 2026 (K Units)
      Fig.16	Global Sex Dolls Toys Online Sex Toys Market, 2016 – 2026 (USD Million)
      Fig.17	Global Sex Dolls Toys Online Sex Toys Market, 2016 – 2026 (K Units)
      Fig.18	Global Others Online Sex Toys Market, 2016 – 2026 (USD Million)
      Fig.19	Global Others Online Sex Toys Market, 2016 – 2026 (K Units)
      Fig.20	Global Online Sex Toys Market Share, by Material, 2020 & 2026 (USD Million)
      Fig.21	Global Online Sex Toys Market Share, by Material, 2020 & 2026 (K Units)
      Fig.22	Global Metal Online Sex Toys Market, 2016 – 2026 (USD Million)
      Fig.23	Global Metal Online Sex Toys Market, 2016 – 2026 (K Units)
      Fig.24	Global Silicone Online Sex Toys Market, 2016 – 2026 (USD Million)
      Fig.25	Global Silicone Online Sex Toys Market, 2016 – 2026 (K Units)
      Fig.26	Global Plastic Online Sex Toys Market, 2016 – 2026 (USD Million)
      Fig.27	Global Plastic Online Sex Toys Market, 2016 – 2026 (K Units)
      Fig.28	Global Glass Online Sex Toys Market, 2016 – 2026 (USD Million)
      Fig.29	Global Glass Online Sex Toys Market, 2016 – 2026 (K Units)
      Fig.30	Global Others Online Sex Toys Market, 2016 – 2026 (USD Million)
      Fig.31	Global Others Online Sex Toys Market, 2016 – 2026 (K Units)
      Fig.32	Global Online Sex Toys Market Share, by Price Range, 2020 & 2026 (USD Million)
      Fig.33	Global Online Sex Toys Market Share, by Price Range, 2020 & 2026 (K Units)
      Fig.34	Global  Premium/ Luxury Online Sex Toys Market, 2016 – 2026 (USD Million)
      Fig.35	Global  Premium/ Luxury Online Sex Toys Market, 2016 – 2026 (K Units)
      Fig.36	Global Mid-Range/ Economy Online Sex Toys Market, 2016 – 2026 (USD Million)
      Fig.37	Global Mid-Range/ Economy Online Sex Toys Market, 2016 – 2026 (K Units)
      Fig.38	Global Online Sex Toys Market Share, by End-User, 2020 & 2026 (USD Million)
      Fig.39	Global Online Sex Toys Market Share, by End-User, 2020 & 2026 (K Units)
      Fig.40	Global Men Online Sex Toys Market, 2016 – 2026 (USD Million)
      Fig.41	Global Men Online Sex Toys Market, 2016 – 2026 (K Units)
      Fig.42	Global Women Online Sex Toys Market, 2016 – 2026 (USD Million)
      Fig.43	Global Women Online Sex Toys Market, 2016 – 2026 (K Units)
      Fig.44	Global Online Sex Toys Market Share, by Region, 2020 & 2026 (USD Million)
      Fig.45	Global Online Sex Toys Market Share, by Region, 2020 & 2026 (K Units)
      Fig.46	North America Online Sex Toys Market, 2016 – 2026 (USD Million)
      Fig.47	North America Online Sex Toys Market, 2016 – 2026 (K Units)
      Fig.48	U.S. Online Sex Toys Market, 2016 – 2026 (USD Million)
      Fig.49	U.S. Online Sex Toys  Market, 2016 – 2026 (K Units)
      Fig.50	Canada Online Sex Toys Market, 2016 – 2026 (USD Million)
      Fig.51	Canada Online Sex Toys  Market, 2016 – 2026 (K Units)
      Fig.52	Europe Online Sex Toys Market, 2016 – 2026 (USD Million)
      Fig.53	Europe Online Sex Toys Market, 2016 – 2026 (K Units)
      Fig.54	Germany Online Sex Toys Market, 2016 – 2026 (USD Million)
      Fig.55	Germany Online Sex Toys  Market, 2016 – 2026 (K Units)
      Fig.56	France Online Sex Toys Market, 2016 – 2026 (USD Million)
      Fig.57	France Online Sex Toys  Market, 2016 – 2026 (K Units)
      Fig.58	U.K. Online Sex Toys Market, 2016 – 2026 (USD Million)
      Fig.59	U.K. Online Sex Toys  Market, 2016 – 2026 (K Units)
      Fig.60	Italy Online Sex Toys Market, 2016 – 2026 (USD Million)
      Fig.61	Italy Online Sex Toys  Market, 2016 – 2026 (K Units)
      Fig.62	Spain Online Sex Toys Market, 2016 – 2026 (USD Million)
      Fig.63	Spain Online Sex Toys  Market, 2016 – 2026 (K Units)
      Fig.64	Rest of Europe Online Sex Toys Market, 2016 – 2026 (USD Million)
      Fig.65	Rest of Europe Online Sex Toys  Market, 2016 – 2026 (K Units)
      Fig.66	Asia Pacific Online Sex Toys Market, 2016 – 2026 (USD Million)
      Fig.67	Asia Pacific Online Sex Toys Market, 2016 – 2026 (K Units)
      Fig.68	China Online Sex Toys Market, 2016 – 2026 (USD Million)
      Fig.69	China Online Sex Toys  Market, 2016 – 2026 (K Units)
      Fig.70	Japan Online Sex Toys Market, 2016 – 2026 (USD Million)
      Fig.71	Japan Online Sex Toys  Market, 2016 – 2026 (K Units)
      Fig.72	India Online Sex Toys Market, 2016 – 2026 (USD Million)
      Fig.73	India Online Sex Toys  Market, 2016 – 2026 (K Units)
      Fig.74	South  Korea Online Sex Toys Market, 2016 – 2026 (USD Million)
      Fig.75	South  Korea Online Sex Toys  Market, 2016 – 2026 (K Units)
      Fig.76	South-East Asia Online Sex Toys Market, 2016 – 2026 (USD Million)
      Fig.77	South-East Asia Online Sex Toys  Market, 2016 – 2026 (K Units)
      Fig.78	Rest of Asia Pacific Online Sex Toys Market, 2016 – 2026 (USD Million)
      Fig.79	Rest of Asia Pacific Online Sex Toys  Market, 2016 – 2026 (K Units)
      Fig.80	Latin America Online Sex Toys Market, 2016 – 2026 (USD Million)
      Fig.81	Latin America Online Sex Toys Market, 2016 – 2026 (K Units)
      Fig.82	Brazil Online Sex Toys Market, 2016 – 2026 (USD Million)
      Fig.83	Brazil Online Sex Toys  Market, 2016 – 2026 (K Units)
      Fig.84	Mexico Online Sex Toys Market, 2016 – 2026 (USD Million)
      Fig.85	Mexico Online Sex Toys  Market, 2016 – 2026 (K Units)
      Fig.86	Rest of Latin America Online Sex Toys Market, 2016 – 2026 (USD Million)
      Fig.87	Rest of Latin America Online Sex Toys  Market, 2016 – 2026 (K Units)
      Fig.88	The Middle-East and Africa Online Sex Toys Market, 2016 – 2026 (USD Million)
      Fig.89	The Middle-East and Africa Online Sex Toys Market, 2016 – 2026 (K Units)
      Fig.90	GCC Countries Online Sex Toys Market, 2016 – 2026 (USD Million)
      Fig.91	GCC Countries Online Sex Toys  Market, 2016 – 2026 (K Units)
      Fig.92	South Africa Online Sex Toys Market, 2016 – 2026 (USD Million)
      Fig.93	South Africa Online Sex Toys  Market, 2016 – 2026 (K Units)
      Fig.94	Rest of Middle-East Africa Online Sex Toys Market, 2016 – 2026 (USD Million)
      Fig.95	Rest of Middle-East Africa Online Sex Toys  Market, 2016 – 2026 (K Units)
      Fig.96	Global Online Sex Toys Production and Consumption, 2016 – 2026 (K Units)
      Fig.97	North America Online Sex Toys Production and Consumption, 2016 – 2026 (USD Million) (K Units)
      Fig.98	Europe Online Sex Toys Production and Consumption, 2016 – 2026 (USD Million) (K Units)
      Fig.99	Asia Pacific Online Sex Toys Production and Consumption, 2016 – 2026 (USD Million) (K Units)
      Fig.100	Latin America Online Sex Toys Production and Consumption, 2016 – 2026 (USD Million) (K Units)
      Fig.101	The Middle-East and Africa Online Sex Toys Production and Consumption, 2016 – 2026 (USD Million) (K Units)
      Fig.102	Competitor Market Share – Revenue
      Fig.103	Competitor Market Share – Volume
      Fig.104	California Exotic Novelties, LLC Revenue and Growth Rate
      Fig.105	California Exotic Novelties, LLC Market Share
      Fig.106	Church and Dwight Co. Inc. Revenue and Growth Rate
      Fig.107	Church and Dwight Co. Inc. Market Share
      Fig.108	Doc Johnson Enterprises Revenue and Growth Rate
      Fig.109	Doc Johnson Enterprises Market Share
      Fig.110	FUN FACTORY GmbH Revenue and Growth Rate
      Fig.111	FUN FACTORY GmbH Market Share
      Fig.112	Kanojo Toys Revenue and Growth Rate
      Fig.113	Kanojo Toys Market Share
      Fig.114	LELOi AB Revenue and Growth Rate
      Fig.115	LELOi AB Market Share
      Fig.116	LifeStyles Healthcare Pte Ltd. Revenue and Growth Rate
      Fig.117	LifeStyles Healthcare Pte Ltd. Market Share
      Fig.118	Lovehoney Group Ltd. Revenue and Growth Rate
      Fig.119	Lovehoney Group Ltd. Market Share
      Fig.120	Luvu Brands Inc. Revenue and Growth Rate
      Fig.121	Luvu Brands Inc. Market Share
      Fig.122	Meiki Toys.com Revenue and Growth Rate
      Fig.123	Meiki Toys.com Market Share
      Fig.124	MS Factory Revenue and Growth Rate
      Fig.125	MS Factory Market Share
      Fig.126	Naughty Nights Revenue and Growth Rate
      Fig.127	Naughty Nights Market Share
      Fig.128	PrivyPleasures.com Revenue and Growth Rate
      Fig.129	PrivyPleasures.com Market Share
      Fig.130	Reckitt Benckiser Group Plc Revenue and Growth Rate
      Fig.131	Reckitt Benckiser Group Plc Market Share
      Fig.132	TENGA Co. Ltd. Revenue and Growth Rate
      Fig.133	TENGA Co. Ltd. Market Share
      Fig.134	TOMAX USA Revenue and Growth Rate
      Fig.135	TOMAX USA Market Share
      Fig.136	Others Revenue and Growth Rate
      Fig.137	Others Market Share
      Fig.138	Market Dynamics
      Fig.139	Global Online Sex Toys – Value Chain Analysis
      Fig.140	Key Mandates and Regulations
      Fig.141	Technology Roadmap and Timeline
      Fig.142	Market Attractiveness Analysis – By Product Type
      Fig.143	Market Attractiveness Analysis – By Material
      Fig.144	Market Attractiveness Analysis – By Price Range
      Fig.145	Market Attractiveness Analysis – By End-User
      Fig.146	Market Attractiveness Analysis – By Region
      Fig.147	Manufacturing Cost Structure of Online Sex Toys
      Fig.148	Online Sex Toys Industrial Chain Analysis
      Fig.149	Market Channels
      Fig.150	Marketing Channel Development Trend
      Fig.151	Growth in World Gross Product, 2008-2018
      

      List of Tables

      Table 1	Global Online Sex Toys Market, 2020 & 2026 (USD Million)
      Table 2	Global Online Sex Toys Market, by Product Type, 2016 – 2026 (USD Million)
      Table 3	Global Online Sex Toys Market, by Product Type, 2016 – 2026 (K Units)
      Table 4	Global Online Sex Toys Market, by Material, 2016 – 2026 (USD Million)
      Table 5	Global Online Sex Toys Market, by Material, 2016 – 2026 (K Units)
      Table 6	Global Online Sex Toys Market, by Price Range, 2016 – 2026 (USD Million)
      Table 7	Global Online Sex Toys Market, by Price Range, 2016 – 2026 (K Units)
      Table 8	Global Online Sex Toys Market, by End-User, 2016 – 2026 (USD Million)
      Table 9	Global Online Sex Toys Market, by End-User, 2016 – 2026 (K Units)
      Table 10 Global Online Sex Toys Market, by Region, 2016 – 2026 (USD Million)
      Table 11 Global Online Sex Toys Market, by Region, 2016 – 2026 (K Units)
      Table 12 North America Online Sex Toys Market, by Country, 2016 – 2026 (USD Million)
      Table 13 North America Online Sex Toys Market, by Country, 2016 – 2026 (K Units)
      Table 14 North America Online Sex Toys Market, by Product Type, 2016 – 2026 (USD Million)
      Table 15 North America Online Sex Toys Market, by Product Type, 2016 – 2026 (K Units)
      Table 16 North America Online Sex Toys Market, by Material, 2016 – 2026 (USD Million)
      Table 17 North America Online Sex Toys Market, by Material, 2016 – 2026 (K Units)
      Table 18 North America Online Sex Toys Market, by Price Range, 2016 – 2026 (USD Million)
      Table 19 North America Online Sex Toys Market, by Price Range, 2016 – 2026 (K Units)
      Table 20 North America Online Sex Toys Market, by End-User, 2016 – 2026 (USD Million)
      Table 21 North America Online Sex Toys Market, by End-User, 2016 – 2026 (K Units)
      Table 22 Europe Online Sex Toys Market, by Country, 2016 – 2026 (USD Million)
      Table 23 Europe Online Sex Toys Market, by Country, 2016 – 2026 (K Units)
      Table 24 Europe Online Sex Toys Market, by Product Type, 2016 – 2026 (USD Million)
      Table 25 Europe Online Sex Toys Market, by Product Type, 2016 – 2026 (K Units)
      Table 26 Europe Online Sex Toys Market, by Material, 2016 – 2026 (USD Million)
      Table 27 Europe Online Sex Toys Market, by Material, 2016 – 2026 (K Units)
      Table 28 Europe Online Sex Toys Market, by Price Range, 2016 – 2026 (USD Million)
      Table 29 Europe Online Sex Toys Market, by Price Range, 2016 – 2026 (K Units)
      Table 30 Europe Online Sex Toys Market, by End-User, 2016 – 2026 (USD Million)
      Table 31 Europe Online Sex Toys Market, by End-User, 2016 – 2026 (K Units)
      Table 32 Asia Pacific Online Sex Toys Market, by Country, 2016 – 2026 (USD Million)
      Table 33 Asia Pacific Online Sex Toys Market, by Country, 2016 – 2026 (K Units)
      Table 34 Asia Pacific Online Sex Toys Market, by Product Type, 2016 – 2026 (USD Million)
      Table 35 Asia Pacific Online Sex Toys Market, by Product Type, 2016 – 2026 (K Units)
      Table 36 Asia Pacific Online Sex Toys Market, by Material, 2016 – 2026 (USD Million)
      Table 37 Asia Pacific Online Sex Toys Market, by Material, 2016 – 2026 (K Units)
      Table 38 Asia Pacific Online Sex Toys Market, by Price Range, 2016 – 2026 (USD Million)
      Table 39 Asia Pacific Online Sex Toys Market, by Price Range, 2016 – 2026 (K Units)
      Table 40 Asia Pacific Online Sex Toys Market, by End-User, 2016 – 2026 (USD Million)
      Table 41 Asia Pacific Online Sex Toys Market, by End-User, 2016 – 2026 (K Units)
      Table 42 Latin America Online Sex Toys Market, by Country, 2016 – 2026 (USD Million)
      Table 43 Latin America Online Sex Toys Market, by Country, 2016 – 2026 (K Units)
      Table 44 Latin America Online Sex Toys Market, by Product Type, 2016 – 2026 (USD Million)
      Table 45 Latin America Online Sex Toys Market, by Product Type, 2016 – 2026 (K Units)
      Table 46 Latin America Online Sex Toys Market, by Material, 2016 – 2026 (USD Million)
      Table 47 Latin America Online Sex Toys Market, by Material, 2016 – 2026 (K Units)
      Table 48 Latin America Online Sex Toys Market, by Price Range, 2016 – 2026 (USD Million)
      Table 49 Latin America Online Sex Toys Market, by Price Range, 2016 – 2026 (K Units)
      Table 50 Latin America Online Sex Toys Market, by End-User, 2016 – 2026 (USD Million)
      Table 51 Latin America Online Sex Toys Market, by End-User, 2016 – 2026 (K Units)
      Table 52 The Middle-East and Africa Online Sex Toys Market, by Country, 2016 – 2026 (USD Million)
      Table 53 The Middle-East and Africa Online Sex Toys Market, by Country, 2016 – 2026 (K Units)
      Table 54 The Middle-East and Africa Online Sex Toys Market, by Product Type, 2016 – 2026 (USD Million)
      Table 55 The Middle-East and Africa Online Sex Toys Market, by Product Type, 2016 – 2026 (K Units)
      Table 56 The Middle-East and Africa Online Sex Toys Market, by Material, 2016 – 2026 (USD Million)
      Table 57 The Middle-East and Africa Online Sex Toys Market, by Material, 2016 – 2026 (K Units)
      Table 58 The Middle-East and Africa Online Sex Toys Market, by Price Range, 2016 – 2026 (USD Million)
      Table 59 The Middle-East and Africa Online Sex Toys Market, by Price Range, 2016 – 2026 (K Units)
      Table 60 The Middle-East and Africa Online Sex Toys Market, by End-User, 2016 – 2026 (USD Million)
      Table 61 The Middle-East and Africa Online Sex Toys Market, by End-User, 2016 – 2026 (K Units)
      Table 62 North America Online Sex Toys Production, Consumption, Export, Import, 2016 – 2019
      Table 63 Europe Online Sex Toys Production, Consumption, Export, Import, 2016 – 2019
      Table 64 Asia Pacific Online Sex Toys Production, Consumption, Export, Import, 2016 – 2019
      Table 65 Latin America Online Sex Toys Production, Consumption, Export, Import, 2016 – 2019
      Table 66 The Middle-East and Africa Online Sex Toys Production, Consumption, Export, Import, 2016 – 2019
      Table 67 Global Online Sex Toys Market - Company Revenue Analysis, 2016 – 2019 (USD Million)
      Table 68 Global Online Sex Toys Market - Company Revenue Share Analysis, 2016 – 2019 (%)
      Table 69 Global Online Sex Toys Market - Company Volume Analysis, 2016 – 2019 (K Units)
      Table 70 Global Online Sex Toys Market - Company Volume Share Analysis, 2016 – 2019 (%)
      Table 71 Acquisitions and Mergers
      Table 72 Market Drivers – Impact Analysis
      Table 73 Market Restraints
      Table 74 Market Opportunities
      Table 75 Production Base and Market Concentration Rate of Raw Material
      Table 76 Key Suppliers of Raw Materials
      Table 77 Raw Materials Sources of Online Sex Toys Major Manufacturers
      Table 78 Major Buyers of Online Sex Toys
      Table 79 Distributors/Traders of Online Sex Toys by Region
      

Industry Major Market Players

  • California Exotic Novelties
  • LLC
  • Church and Dwight Co. Inc.
  • Doc Johnson Enterprises
  • FUN FACTORY GmbH
  • Kanojo Toys
  • LELOi AB
  • LifeStyles Healthcare Pte Ltd.
  • Lovehoney Group Ltd.
  • Luvu Brands Inc.
  • Meiki Toys.com
  • MS Factory
  • Naughty Nights
  • PrivyPleasures.com
  • Reckitt Benckiser Group Plc
  • TENGA Co. Ltd.
  • TOMAX USA