Search Market Research Report

Discover Our Latest Reports
Discover Our Featured Reports
Discover Top Selling Reports

Online Presentation Software Market Size, Share Global Analysis Report, , 2020 – 2026

report img

Online Presentation Software Market By Component (Services and Software), By Deployment (Cloud Based and On-Premise), By Software Share (App Based and Web Based), By Role Share (Finance, Marketers, Sates Team, Event, Human Resources, Training and Development, and Others), By Device (Tablet, Smartphones, PC, and Others), By Subscription (Monthly and Annually), By End User (Students, Enterprises, Educators and Bloggers, NGOs, Consultants, and Others): Global Industry Perspective, Comprehensive Analysis and Forecast, 2020 – 2026

Industry Insights

The Online Presentation Software market is anticipated to grow at a rapid rate over the forecast timeframe. With reference to value, the Online Presentation Software market accounted for USD 804 Million in 2019. Furthermore, this market is estimated to reach USD 1483.9 Million by 2026 with growth at a CAGR of 9.4%.

logo Synopsis

The online presentation software basically helps users to tailor the pre-built template as per their requirement and also to share it by creating a link. Currently, there is countless software available using which the online presentation can be prepared. This software permits users to gain access to advanced analytics, such as one can get real-time notifications depending on when one has viewed the presentation and its length. The online presentation software is of great use for the sales and accounts team of companies as it helps save time and cost as well as allows faster sharing of unlimited file sizes. The rising number of start-ups and businesses is anticipated to augment the growth of the online presentation software market. Moreover, the rising adoption of this software in the marketing research industry is projected to fuel market demand.

Global Online Presentation Software Market

To know more about this report | Request Free Sample Copy

logo Growth Dynamics

The online presentation software is expected to gain momentum owing to its time-saving and cost-effective processes that are expected to increase its adoption in the communicating, training, and learning process. This software helps view the presentations in real-time without considering the length of it. For business developments, online presentations can add-on better graphics and diagrams thereby proving to be an innovative technology. The gaining of a better understanding of the topic, problems along clear visual information is projected to increase the adoption of online presentation software. The software help create an interactive presentation that could help sound and visual effect and control playback speed for the better understanding better about the product or service. The rising adoption of digitalization along with the increasing smartphones, tablets, and modern computers user base helps the innovative software make viewing of presentations by the clients within less time. Over the years, people will realize the benefits of online presentation software and this will help boom the market growth. But, the security issues may restrain the market growth as presentations may contain highly secure data of a particular company, and also the rising number of cyber-attacks on the servers may pose a threat. The online presentation software market growth is also hampered due to server infiltration attacks, client-device malware, denial online service attacks, and others. The evolution of digitization is altering the undercurrents of industrial processes and even renovating economies and societies. Despite the positive effect of digitization on the global trade and investment patterns, it increases the apprehensions over cybersecurity. Furthermore, the increasing smartphone and Internet user base stimulates the pace of online presentation software in the upcoming years.

logoSegmentation Analysis

The global Online Presentation Software market can be categorized based on software share, component, deployment, device, role share, end-user, and region. Based on software share, the market is divided into app-based and web-based. The web-based software is popular owing to benefit of not downloading the software and also the ability to connect to multiple servers even when remotely located. By component, the global online presentation software market is categorized into services and software. The services segment shows rapid growth owing to its lucrative outcomes for the industry. Based on deployment, the market is segmented into cloud-based and on-premise. Of which the cloud-based segment showcases high growth due to the demand for software as a service model. On the basis of devices, the online presentation software market is segregated into tablets, smartphones, pc, and others. The rising smartphone user base is projected to help propel the growth of the smartphone category. By role, the market is classified into finance, marketers, sales team, event, human resources, training and development, and others. The marketer's category is expected to dominate a majority of the results are obtained via marketing. Based on subscriptions, the market is fragmented monthly and annually. The annual segment shows rapid growth as all the corporate organizations and educational institutes favor annual subscriptions. On the basis of end-user, the online presentation software market is classified into students, enterprises, educators and bloggers, NGOs, consultants, and others. Of these, the consultant's category holds the largest share of the market.

logoReport Scope

Report Attribute

Details

Market Size in 2019

USD 804 Million

Projected Market Size in 2026

USD 1483.9 Million

CAGR Growth Rate

9.4%

Base Year

2019

Forecast Years

2019-2026

Key Market Players

Canva, CustomShow, Apple Inc. (Keynote), Digideck, Beautiful.ai, Zoho Corporation Pvt. Ltd., FlowVella, Genially, Prezi Inc., GoAnimate, Inc. (Vyond), Powtoon Ltd., Easy WebContent, Inc. (Visme), Slidebean Inc., SlideDog, Slides, Inc., and Haiku Deck, Inc., amongst others.

Key Segment

By Component, By Software Share, By Role Share, By Device, By Subscription, Regional Segmentation

Major Regions Covered

North America, Europe, Asia Pacific, Latin America, and the Middle East & Africa

Purchase Options

Request customized purchase options to meet your research needs. Explore purchase options

logo Regional Analysis

On the basis of the demographic study, the global Online Presentation Software market is categorized into North America, Asia Pacific, Europe, Latin America, and the Middle East and Africa. In 2019, North America had the largest share followed by Europe and the Asia Pacific. The rising inclination toward remote working has affected the online presentation software market. Moreover, all multinational companies have started using online presentation software. Small and medium enterprises have also started using this software to contact the teams situated in remote areas. The up-gradation of the software by adding multi-lingual features is anticipated to escalate its use. Asia Pacific region is projected to experience rapid growth over the forecast timeframe. This growth is primarily due to the rising startups in China and Asia and also the government initiatives for developing investment and investor-friendly atmosphere.

logo Major Players

Some of the major players in the online presentation software market include

  • Canva
  • CustomShow
  • Apple Inc. (Keynote)
  • Digideck
  • Beautiful.ai
  • Zoho Corporation Pvt. Ltd.
  • FlowVella
  • Genially
  • Prezi Inc.
  • GoAnimate Inc. (Vyond)
  • Powtoon Ltd.
  • Easy WebContent Inc. (Visme)
  • Slidebean Inc.
  • SlideDog
  • Slides Inc.
  • Haiku Deck Inc.

The global online presentation software market is segmented as follows:

logoBy Component

  •  Services
  •  Software
  •  By Deployment
  •  Cloud Based
  •  On-Premise

logo By Software Share

  •  App Based
  •  Web Based

logo By Role Share

  •  Finance
  •  Marketers
  •  Sates Team
  •  Event
  •  Human Resources
  •  Training and Development
  •  Others

logoBy Device

  •  Tablet
  •  Smartphones
  •  PC
  •  Others

logoBy Subscription

  •  Monthly
  •  Annually
  •  By End User
  •  Students
  •  Enterprises
  •  Educators
  •  Bloggers
  •  NGOs
  •  Consultants
  •  Others

logo Regional Segmentation

  • North America
    • U.S.
    • Canada
  • Europe
    • U.K.
    • France
    • Germany
  • The Asia Pacific
    • China
    • Japan
    • India
  • Latin America
    • Brazil
    • Mexico
  • The Middle East and Africa

Table of Content

  1. Chapter 1.Preface
    1. 1.1.Report Description
    2. 1.1.Report Scope
  2. Chapter 2.Research Methodology
    1. 2.1.Research Methodology
    2. 2.2.Secondary Research
    3. 2.3.Primary Research
    4. 2.4.Models
      1. 2.4.1.Company Share Analysis Model
      2. 2.4.2.Revenue Based Modeling
    5. 2.5.Research Limitations
  3. Chapter 3.Executive Summary
    1. 3.1.Global Online Presentation Software Market, 2016 – 2026 (USD Million)
    2. 3.2.Global Online Presentation Software Market: Snapshot
  4. Chapter 4.Online Presentation Software Market – Industry Analysis
    1. 4.1.Introduction
    2. 4.2.Market Drivers
      1. 4.2.1.XXXX
      2. 4.2.2.Increasing Demand for the Internet
    3. 4.3.Restraints
      1. 4.3.1.XXXX.
  5. 4.4.Opportunities
    1. 4.4.1.XXXX
  6. 4.5.Porter’s Five Forces Analysis
  • Chapter 5.Investment Proposition Analysis
    1. 5.1.Global Online Presentation Software Market Attractiveness, By Component
    2. 5.2.Global Online Presentation Software Market Attractiveness, By Deployment
    3. 5.3.Global Online Presentation Software Market Attractiveness, By Software
    4. 5.4.Global Online Presentation Software Market Attractiveness, By Role
    5. 5.5.Global Online Presentation Software Market Attractiveness, By Device
    6. 5.6.Global Online Presentation Software Market Attractiveness, By Subscription
    7. 5.7.Global Online Presentation Software Market Attractiveness, By End User
    8. 5.8.Global Online Presentation Software Market Attractiveness, By Region
  • Chapter 6.Competitive Landscape
    1. 6.1.Company Market Share Analysis
      1. 6.1.1.Global Online Presentation Software Market: Company Market Share, 2019
    2. 6.2.Strategic Developments
  • Chapter 7.Online Presentation Software Market – Component Segment Analysis
    1. 7.1.Global Online Presentation Software Market Overview: by Component
      1. 7.1.1.Global Online Presentation Software Market Revenue Share, by Component, 2019 & 2026
    2. 7.2.Software
      1. 7.2.1.Global Online Presentation Software Market for Software, Revenue (USD Million) 2016 – 2026
    3. 7.3.Services
      1. 7.3.1.Global Online Presentation Software Market for Services, Revenue (USD Million) 2016 – 2026
  • Chapter 8.Online Presentation Software Market – Deployment Segment Analysis
    1. 8.1.Global Online Presentation Software Market Overview: by Deployment
      1. 8.1.1.Global Online Presentation Software Market Revenue Share, by Deployment, 2019 & 2026
    2. 8.2.On Premise
      1. 8.2.1.Global Online Presentation Software Market for On Premise, Revenue (USD Million) 2016 – 2026
    3. 8.3.Cloud Based
      1. 8.3.1.Global Online Presentation Software Market for Cloud Based, Revenue (USD Million) 2016 – 2026
  • Chapter 9.Online Presentation Software Market – Software Segment Analysis
    1. 9.1.Global Online Presentation Software Market Overview: by Software
      1. 9.1.1.Global Online Presentation Software Market Revenue Share, by Software, 2019 & 2026
    2. 9.2.Web Based
      1. 9.2.1.Global Online Presentation Software Market for Web Based, Revenue (USD Million) 2016 – 2026
    3. 9.3.App Based
      1. 9.3.1.Global Online Presentation Software Market for App Based, Revenue (USD Million) 2016 – 2026
  • Chapter 10.Online Presentation Software Market – Role Segment Analysis
    1. 10.1.Global Online Presentation Software Market Overview: by Role
      1. 10.1.1.Global Online Presentation Software Market Revenue Share, by Role, 2019 & 2026
    2. 10.2.Marketers
      1. 10.2.1.Global Online Presentation Software Market for Marketers, Revenue (USD Million) 2016 – 2026
    3. 10.3.Finance
      1. 10.3.1.Global Online Presentation Software Market for Finance, Revenue (USD Million) 2016 – 2026
    4. 10.4.Sales Team
      1. 10.4.1.Global Online Presentation Software Market for Sales Team, Revenue (USD Million) 2016 – 2026
    5. 10.5.Human Resources
      1. 10.5.1.Global Online Presentation Software Market for Human Resources, Revenue (USD Million) 2016 – 2026
    6. 10.6.Event
      1. 10.6.1.Global Online Presentation Software Market for Event, Revenue (USD Million) 2016 – 2026
    7. 10.7.Training and Development
      1. 10.7.1.Global Online Presentation Software Market for Training and Development, Revenue (USD Million) 2016 – 2026
    8. 10.8.Others
      1. 10.8.1.Global Online Presentation Software Market for Others, Revenue (USD Million) 2016 – 2026
  • Chapter 11.Online Presentation Software Market – Device Segment Analysis
    1. 11.1.Global Online Presentation Software Market Overview: by Device
      1. 11.1.1.Global Online Presentation Software Market Revenue Share, by Device, 2019 & 2026
    2. 11.2.Smartphones
      1. 11.2.1.Global Online Presentation Software Market for Smartphones, Revenue (USD Million) 2016 – 2026
    3. 11.3.Tablet
      1. 11.3.1.Global Online Presentation Software Market for Tablet, Revenue (USD Million) 2016 – 2026
    4. 11.4.PC
      1. 11.4.1.Global Online Presentation Software Market for PC, Revenue (USD Million) 2016 – 2026
    5. 11.5.Others
      1. 11.5.1.Global Online Presentation Software Market for Others, Revenue (USD Million) 2016 – 2026
  • Chapter 12.Online Presentation Software Market – Subscription Segment Analysis
    1. 12.1.Global Online Presentation Software Market Overview: by Subscription
      1. 12.1.1.Global Online Presentation Software Market Revenue Share, by Subscription, 2019 & 2026
    2. 12.2.Monthly
      1. 12.2.1.Global Online Presentation Software Market for Monthly, Revenue (USD Million) 2016 – 2026
    3. 12.3.Annual
      1. 12.3.1.Global Online Presentation Software Market for Annual, Revenue (USD Million) 2016 – 2026
  • Chapter 13.Online Presentation Software Market – End User Segment Analysis
    1. 13.1.Global Online Presentation Software Market Overview: by End User
      1. 13.1.1.Global Online Presentation Software Market Revenue Share, by End User, 2019 & 2026
    2. 13.2.Enterprises
      1. 13.2.1.Global Online Presentation Software Market for Enterprises, Revenue (USD Million) 2016 – 2026
    3. 13.3.Students
      1. 13.3.1.Global Online Presentation Software Market for Students, Revenue (USD Million) 2016 – 2026
    4. 13.4.Educators and Bloggers
      1. 13.4.1.Global Online Presentation Software Market for Educators and Bloggers, Revenue (USD Million) 2016 – 2026
    5. 13.5.Consultants
      1. 13.5.1.Global Online Presentation Software Market for Consultants, Revenue (USD Million) 2016 – 2026
    6. 13.6.NGO
      1. 13.6.1.Global Online Presentation Software Market for NGO, Revenue (USD Million) 2016 – 2026
    7. 13.7.Others
      1. 13.7.1.Global Online Presentation Software Market for Others, Revenue (USD Million) 2016 – 2026
  • Chapter 14.Online Presentation Software Market – Regional Analysis
    1. 14.1.Global Online Presentation Software Market: Regional Overview
      1. 14.1.1.Global Online Presentation Software Market Revenue Share, by Region, 2019 & 2026
      2. 14.1.2.Global Online Presentation Software Market Revenue, by Region, 2016 – 2026 (USD Million)
    2. 14.2.North America
      1. 14.2.1.North America Online Presentation Software Market Revenue, 2016 – 2026 (USD Million)
      2. 14.2.2.North America Online Presentation Software Market Revenue, by Country, 2016 – 2026 (USD Million)
      3. 14.2.3.North America Online Presentation Software Market Revenue, by Component, 2016 – 2026
      4. 14.2.4.North America Online Presentation Software Market Revenue, by Deployment, 2016 – 2026
      5. 14.2.5.North America Online Presentation Software Market Revenue, by Software, 2016 – 2026
      6. 14.2.6.North America Online Presentation Software Market Revenue, by Role, 2016 – 2026
      7. 14.2.7.North America Online Presentation Software Market Revenue, by Device, 2016 – 2026
      8. 14.2.8.North America Online Presentation Software Market Revenue, by Subscription, 2016 – 2026
      9. 14.2.9.North America Online Presentation Software Market Revenue, by End User, 2016 – 2026
      10. 14.2.10. U.S.
        1. 14.2.10.1. U.S. Online Presentation Software Market Revenue, by Component, 2016 – 2026
        2. 14.2.10.2. U.S. Online Presentation Software Market Revenue, by Deployment, 2016 – 2026
        3. 14.2.10.3. U.S. Online Presentation Software Market Revenue, by Software, 2016 – 2026
        4. 14.2.10.4. U.S. Online Presentation Software Market Revenue, by Role, 2016 – 2026
        5. 14.2.10.5. U.S. Online Presentation Software Market Revenue, by Device, 2016 – 2026
        6. 14.2.10.6. U.S. Online Presentation Software Market Revenue, by Subscription, 2016 – 2026
        7. 14.2.10.7. U.S. Online Presentation Software Market Revenue, by End User, 2016 – 2026
      11. 14.2.11.Canada
        1. 14.2.11.1.Canada Online Presentation Software Market Revenue, by Component, 2016 – 2026
        2. 14.2.11.2.Canada Online Presentation Software Market Revenue, by Deployment, 2016 – 2026
        3. 14.2.11.3.Canada Online Presentation Software Market Revenue, by Software, 2016 – 2026
        4. 14.2.11.4.Canada Online Presentation Software Market Revenue, by Role, 2016 – 2026
        5. 14.2.11.5.Canada Online Presentation Software Market Revenue, by Device, 2016 – 2026
        6. 14.2.11.6.Canada Online Presentation Software Market Revenue, by Subscription, 2016 – 2026
        7. 14.2.11.7.Canada Online Presentation Software Market Revenue, by End User, 2016 – 2026
    3. 14.3.Europe
      1. 14.3.1.Europe Online Presentation Software Market Revenue, 2016 – 2026 (USD Million)
      2. 14.3.2.Europe Online Presentation Software Market Revenue, by Country, 2016 – 2026 (USD Million)
      3. 14.3.3.Europe Online Presentation Software Market Revenue, by Component, 2016 – 2026
      4. 14.3.4.Europe Online Presentation Software Market Revenue, by Deployment, 2016 – 2026
      5. 14.3.5.Europe Online Presentation Software Market Revenue, by Software, 2016 – 2026
      6. 14.3.6.Europe Online Presentation Software Market Revenue, by Role, 2016 – 2026
      7. 14.3.7.Europe Online Presentation Software Market Revenue, by Device, 2016 – 2026
      8. 14.3.8.Europe Online Presentation Software Market Revenue, by Subscription, 2016 – 2026
      9. 14.3.9.Europe Online Presentation Software Market Revenue, by End User, 2016 – 2026
      10. 14.3.10.Germany
        1. 14.3.10.1.Germany Online Presentation Software Market Revenue, by Component, 2016 – 2026
        2. 14.3.10.2.Germany Online Presentation Software Market Revenue, by Deployment, 2016 – 2026
        3. 14.3.10.3.Germany Online Presentation Software Market Revenue, by Software, 2016 – 2026
        4. 14.3.10.4.Germany Online Presentation Software Market Revenue, by Role, 2016 – 2026
        5. 14.3.10.5.Germany Online Presentation Software Market Revenue, by Device, 2016 – 2026
        6. 14.3.10.6.Germany Online Presentation Software Market Revenue, by Subscription, 2016 – 2026
        7. 14.3.10.7.Germany Online Presentation Software Market Revenue, by End User, 2016 – 2026
      11. 14.3.11.France
        1. 14.3.11.1.France Online Presentation Software Market Revenue, by Component, 2016 – 2026
        2. 14.3.11.2.France Online Presentation Software Market Revenue, by Deployment, 2016 – 2026
        3. 14.3.11.3.France Online Presentation Software Market Revenue, by Software, 2016 – 2026
        4. 14.3.11.4.France Online Presentation Software Market Revenue, by Role, 2016 – 2026
        5. 14.3.11.5.France Online Presentation Software Market Revenue, by Device, 2016 – 2026
        6. 14.3.11.6.France Online Presentation Software Market Revenue, by Subscription, 2016 – 2026
        7. 14.3.11.7.France Online Presentation Software Market Revenue, by End User, 2016 – 2026
      12. 14.3.12. U.K.
        1. 14.3.12.1. U.K. Online Presentation Software Market Revenue, by Component, 2016 – 2026
        2. 14.3.12.2. U.K. Online Presentation Software Market Revenue, by Deployment, 2016 – 2026
        3. 14.3.12.3. U.K. Online Presentation Software Market Revenue, by Software, 2016 – 2026
        4. 14.3.12.4. U.K. Online Presentation Software Market Revenue, by Role, 2016 – 2026
        5. 14.3.12.5. U.K. Online Presentation Software Market Revenue, by Device, 2016 – 2026
        6. 14.3.12.6. U.K. Online Presentation Software Market Revenue, by Subscription, 2016 – 2026
        7. 14.3.12.7. U.K. Online Presentation Software Market Revenue, by End User, 2016 – 2026
      13. 14.3.13.Italy
        1. 14.3.13.1.Italy Online Presentation Software Market Revenue, by Component, 2016 – 2026
        2. 14.3.13.2.Italy Online Presentation Software Market Revenue, by Deployment, 2016 – 2026
        3. 14.3.13.3.Italy Online Presentation Software Market Revenue, by Software, 2016 – 2026
        4. 14.3.13.4.Italy Online Presentation Software Market Revenue, by Role, 2016 – 2026
        5. 14.3.13.5.Italy Online Presentation Software Market Revenue, by Device, 2016 – 2026
        6. 14.3.13.6.Italy Online Presentation Software Market Revenue, by Subscription, 2016 – 2026
        7. 14.3.13.7.Italy Online Presentation Software Market Revenue, by End User, 2016 – 2026
      14. 14.3.14.Spain
        1. 14.3.14.1.Spain Online Presentation Software Market Revenue, by Component, 2016 – 2026
        2. 14.3.14.2.Spain Online Presentation Software Market Revenue, by Deployment, 2016 – 2026
        3. 14.3.14.3.Spain Online Presentation Software Market Revenue, by Software, 2016 – 2026
        4. 14.3.14.4.Spain Online Presentation Software Market Revenue, by Role, 2016 – 2026
        5. 14.3.14.5.Spain Online Presentation Software Market Revenue, by Device, 2016 – 2026
        6. 14.3.14.6.Spain Online Presentation Software Market Revenue, by Subscription, 2016 – 2026
        7. 14.3.14.7.Spain Online Presentation Software Market Revenue, by End User, 2016 – 2026
      15. 14.3.15.Rest of Europe
        1. 14.3.15.1.Rest of Europe Online Presentation Software Market Revenue, by Component, 2016 – 2026
        2. 14.3.15.2.Rest of Europe Online Presentation Software Market Revenue, by Deployment, 2016 – 2026
        3. 14.3.15.3.Rest of Europe Online Presentation Software Market Revenue, by Software, 2016 – 2026
        4. 14.3.15.4.Rest of Europe Online Presentation Software Market Revenue, by Role, 2016 – 2026
        5. 14.3.15.5.Rest of Europe Online Presentation Software Market Revenue, by Device, 2016 – 2026
        6. 14.3.15.6.Rest of Europe Online Presentation Software Market Revenue, by Subscription, 2016 – 2026
        7. 14.3.15.7.Rest of Europe Online Presentation Software Market Revenue, by End User, 2016 – 2026
    4. 14.4.Asia Pacific
      1. 14.4.1.Asia Pacific Online Presentation Software Market Revenue, 2016 – 2026 (USD Million)
      2. 14.4.2.Asia Pacific Online Presentation Software Market Revenue, by Country, 2016 – 2026 (USD Million)
      3. 14.4.3.Asia Pacific Online Presentation Software Market Revenue, by Component, 2016 – 2026
      4. 14.4.4.Asia Pacific Online Presentation Software Market Revenue, by Deployment, 2016 – 2026
      5. 14.4.5.Asia Pacific Online Presentation Software Market Revenue, by Software, 2016 – 2026
      6. 14.4.6.Asia Pacific Online Presentation Software Market Revenue, by Role, 2016 – 2026
      7. 14.4.7.Asia Pacific Online Presentation Software Market Revenue, by Device, 2016 – 2026
      8. 14.4.8.Asia Pacific Online Presentation Software Market Revenue, by Subscription, 2016 – 2026
      9. 14.4.9.Asia Pacific Online Presentation Software Market Revenue, by End User, 2016 – 2026
      10. 14.4.10.China
        1. 14.4.10.1.China Online Presentation Software Market Revenue, by Component, 2016 – 2026
        2. 14.4.10.2.China Online Presentation Software Market Revenue, by Deployment, 2016 – 2026
        3. 14.4.10.3.China Online Presentation Software Market Revenue, by Software, 2016 – 2026
        4. 14.4.10.4.China Online Presentation Software Market Revenue, by Role, 2016 – 2026
        5. 14.4.10.5.China Online Presentation Software Market Revenue, by Device, 2016 – 2026
        6. 14.4.10.6.China Online Presentation Software Market Revenue, by Subscription, 2016 – 2026
        7. 14.4.10.7.China Online Presentation Software Market Revenue, by End User, 2016 – 2026
      11. 14.4.11.Japan
        1. 14.4.11.1.Japan Online Presentation Software Market Revenue, by Component, 2016 – 2026
        2. 14.4.11.2.Japan Online Presentation Software Market Revenue, by Deployment, 2016 – 2026
        3. 14.4.11.3.Japan Online Presentation Software Market Revenue, by Software, 2016 – 2026
        4. 14.4.11.4.Japan Online Presentation Software Market Revenue, by Role, 2016 – 2026
        5. 14.4.11.5.Japan Online Presentation Software Market Revenue, by Device, 2016 – 2026
        6. 14.4.11.6.Japan Online Presentation Software Market Revenue, by Subscription, 2016 – 2026
        7. 14.4.11.7.Japan Online Presentation Software Market Revenue, by End User, 2016 – 2026
      12. 14.4.12.India
        1. 14.4.12.1.India Online Presentation Software Market Revenue, by Component, 2016 – 2026
        2. 14.4.12.2.India Online Presentation Software Market Revenue, by Deployment, 2016 – 2026
        3. 14.4.12.3.India Online Presentation Software Market Revenue, by Software, 2016 – 2026
        4. 14.4.12.4.India Online Presentation Software Market Revenue, by Role, 2016 – 2026
        5. 14.4.12.5.India Online Presentation Software Market Revenue, by Device, 2016 – 2026
        6. 14.4.12.6.India Online Presentation Software Market Revenue, by Subscription, 2016 – 2026
        7. 14.4.12.7.India Online Presentation Software Market Revenue, by End User, 2016 – 2026
      13. 14.4.13.South Korea
        1. 14.4.13.1.South Korea Online Presentation Software Market Revenue, by Component, 2016 – 2026
        2. 14.4.13.2.South Korea Online Presentation Software Market Revenue, by Deployment, 2016 – 2026
        3. 14.4.13.3.South Korea Online Presentation Software Market Revenue, by Software, 2016 – 2026
        4. 14.4.13.4.South Korea Online Presentation Software Market Revenue, by Role, 2016 – 2026
        5. 14.4.13.5.South Korea Online Presentation Software Market Revenue, by Device, 2016 – 2026
        6. 14.4.13.6.South Korea Online Presentation Software Market Revenue, by Subscription, 2016 – 2026
        7. 14.4.13.7.South Korea Online Presentation Software Market Revenue, by End User, 2016 – 2026
      14. 14.4.14.South-East Asia
        1. 14.4.14.1.South-East Asia Online Presentation Software Market Revenue, by Component, 2016 – 2026
        2. 14.4.14.2.South-East Asia Online Presentation Software Market Revenue, by Deployment, 2016 – 2026
        3. 14.4.14.3.South-East Asia Online Presentation Software Market Revenue, by Software, 2016 – 2026
        4. 14.4.14.4.South-East Asia Online Presentation Software Market Revenue, by Role, 2016 – 2026
        5. 14.4.14.5.South-East Asia Online Presentation Software Market Revenue, by Device, 2016 – 2026
        6. 14.4.14.6.South-East Asia Online Presentation Software Market Revenue, by Subscription, 2016 – 2026
        7. 14.4.14.7.South-East Asia Online Presentation Software Market Revenue, by End User, 2016 – 2026
      15. 14.4.15.Rest of Asia Pacific
        1. 14.4.15.1.Rest of Asia Pacific Online Presentation Software Market Revenue, by Component, 2016 – 2026
        2. 14.4.15.2.Rest of Asia Pacific Online Presentation Software Market Revenue, by Deployment, 2016 – 2026
        3. 14.4.15.3.Rest of Asia Pacific Online Presentation Software Market Revenue, by Software, 2016 – 2026
        4. 14.4.15.4.Rest of Asia Pacific Online Presentation Software Market Revenue, by Role, 2016 – 2026
        5. 14.4.15.5.Rest of Asia Pacific Online Presentation Software Market Revenue, by Device, 2016 – 2026
        6. 14.4.15.6.Rest of Asia Pacific Online Presentation Software Market Revenue, by Subscription, 2016 – 2026
        7. 14.4.15.7.Rest of Asia Pacific Online Presentation Software Market Revenue, by End User, 2016 – 2026
    5. 14.5.Latin America
      1. 14.5.1.Latin America Online Presentation Software Market Revenue, 2016 – 2026 (USD Million)
      2. 14.5.2.Latin America Online Presentation Software Market Revenue, by Country, 2016 – 2026 (USD Million)
      3. 14.5.3.Latin America Online Presentation Software Market Revenue, by Component, 2016 – 2026
      4. 14.5.4.Latin America Online Presentation Software Market Revenue, by Deployment, 2016 – 2026
      5. 14.5.5.Latin America Online Presentation Software Market Revenue, by Software, 2016 – 2026
      6. 14.5.6.Latin America Online Presentation Software Market Revenue, by Role, 2016 – 2026
      7. 14.5.7.Latin America Online Presentation Software Market Revenue, by Device, 2016 – 2026
      8. 14.5.8.Latin America Online Presentation Software Market Revenue, by Subscription, 2016 – 2026
      9. 14.5.9.Latin America Online Presentation Software Market Revenue, by End User, 2016 – 2026
      10. 14.5.10.Brazil
      11. 14.5.10.1 . Brazil Online Presentation Software Market Revenue, by Component, 2016 – 2026
      12. 14.5.10.2 . Brazil Online Presentation Software Market Revenue, by Deployment, 2016 – 2026
      13. 14.5.10.3 . Brazil Online Presentation Software Market Revenue, by Software, 2016 – 2026
      14. 14.5.10.4 .Brazil Online Presentation Software Market Revenue, by Role, 2016 – 2026
      15. 14.5.10.5 .Brazil Online Presentation Software Market Revenue, by Device, 2016 – 2026
      16. 14.5.10.6 .Brazil Online Presentation Software Market Revenue, by Subscription, 2016 – 2026
      17. 14.5.10.7 .Brazil Online Presentation Software Market Revenue, by End User, 2016 – 2026
      18. 14.5.11.Mexico
      19. 14.5.11.1 .Mexico Online Presentation Software Market Revenue, by Component, 2016 – 2026
      20. 14.5.11.2 . Mexico Online Presentation Software Market Revenue, by Deployment, 2016 – 2026
      21. 14.5.11.3 .Mexico Online Presentation Software Market Revenue, by Software, 2016 – 2026
      22. 14.5.11.4 .Mexico Online Presentation Software Market Revenue, by Role, 2016 – 2026
      23. 14.5.11.5 .Mexico Online Presentation Software Market Revenue, by Device, 2016 – 2026
      24. 14.5.11.6 .Mexico Online Presentation Software Market Revenue, by Subscription, 2016 – 2026
      25. 14.5.11.7 .Mexico Online Presentation Software Market Revenue, by End User, 2016 – 2026
      26. 14.5.12. Rest of Latin America
        1. 14.5.12.1.Rest of Latin America Online Presentation Software Market Revenue, by Component, 2016 – 2026
        2. 14.5.12.2.Rest of Latin America Online Presentation Software Market Revenue, by Deployment, 2016 – 2026
        3. 14.5.12.3.Rest of Latin America Online Presentation Software Market Revenue, by Software, 2016 – 2026
        4. 14.5.12.4.Rest of Latin America Online Presentation Software Market Revenue, by Role, 2016 – 2026
        5. 14.5.12.5.Rest of Latin America Online Presentation Software Market Revenue, by Device, 2016 – 2026
        6. 14.5.12.6.Rest of Latin America Online Presentation Software Market Revenue, by Subscription, 2016 – 2026
        7. 14.5.12.7.Rest of Latin America Online Presentation Software Market Revenue, by End User, 2016 – 2026
    6. 14.6.The Middle-East and Africa
      1. 14.6.1.The Middle-East and Africa Online Presentation Software Market Revenue, 2016 – 2026 (USD Million)
      2. 14.6.2.The Middle-East and Africa Online Presentation Software Market Revenue, by Country, 2016 – 2026 (USD Million)
      3. 14.6.3.The Middle-East and Africa Online Presentation Software Market Revenue, by Component, 2016 – 2026
      4. 14.6.4.The Middle-East and Africa Online Presentation Software Market Revenue, by Deployment, 2016 – 2026
      5. 14.6.5.The Middle-East and Africa Online Presentation Software Market Revenue, by Software, 2016 – 2026
      6. 14.6.6.The Middle-East and Africa Online Presentation Software Market Revenue, by Role, 2016 – 2026
      7. 14.6.7.The Middle-East and Africa Online Presentation Software Market Revenue, by Device, 2016 – 2026
      8. 14.6.8.The Middle-East and Africa Online Presentation Software Market Revenue, by Subscription, 2016 – 2026
      9. 14.6.9.The Middle-East and Africa Online Presentation Software Market Revenue, by End User, 2016 – 2026
      10. 14.6.10.GCC Countries
      11. 14.6.10.1 .GCC Countries Online Presentation Software Market Revenue, by Component, 2016 – 2026
      12. 14.6.10.2 .GCC Countries Online Presentation Software Market Revenue, by Deployment, 2016 – 2026
      13. 14.6.10.3 .GCC Countries Online Presentation Software Market Revenue, by Software, 2016 – 2026
      14. 14.6.10.4 .GCC Countries Online Presentation Software Market Revenue, by Role, 2016 – 2026
      15. 14.6.10.5 .GCC Countries Online Presentation Software Market Revenue, by Device, 2016 – 2026
      16. 14.6.10.6 .GCC Countries Online Presentation Software Market Revenue, by Subscription, 2016 – 2026
      17. 14.6.10.7 .GCC Countries Online Presentation Software Market Revenue, by End User, 2016 – 2026
      18. 14.6.11.South Africa
        1. 14.6.11.1. South Africa Online Presentation Software Market Revenue, by Component, 2016 – 2026
      19. 14.6.11.2 .South Africa Online Presentation Software Market Revenue, by Deployment, 2016 – 2026
      20. 14.6.11.3 .South Africa Online Presentation Software Market Revenue, by Software, 2016 – 2026
      21. 14.6.11.4 .South Africa Online Presentation Software Market Revenue, by Role, 2016 – 2026
        1. 14.6.11.5. South Africa Online Presentation Software Market Revenue, by Device, 2016 – 2026
      22. 14.6.11.6 .South Africa Online Presentation Software Market Revenue, by Subscription, 2016 – 2026
      23. 14.6.11.7 .South Africa Online Presentation Software Market Revenue, by End User, 2016 – 2026
      24. 14.6.12.Rest of Middle-East Africa
      25. 14.6.12.1 .Rest of Middle-East Africa Online Presentation Software Market Revenue, by Component, 2016 – 2026
      26. 14.6.12.2 .Rest of Middle-East Africa Online Presentation Software Market Revenue, by Deployment, 2016 – 2026
      27. 14.6.12.3 .Rest of Middle-East Africa Online Presentation Software Market Revenue, by Software, 2016 – 2026
      28. 14.6.12.4 .Rest of Middle-East Africa Online Presentation Software Market Revenue, by Role, 2016 – 2026
      29. 14.6.12.5 .Rest of Middle-East Africa Online Presentation Software Market Revenue, by Device, 2016 – 2026
      30. 14.6.12.6 .Rest of Middle-East Africa Online Presentation Software Market Revenue, by Subscription, 2016 – 2026
      31. 14.6.12.7 .Rest of Middle-East Africa Online Presentation Software Market Revenue, by End User, 2016 – 2026
  • Chapter 15.Company Profiles
    1. 15.1.Keynote
      1. 15.1.1.Company Overview
      2. 15.1.2.Financial Overview
      3. 15.1.3.Product Portfolio
      4. 15.1.4.Business Strategy
      5. 15.1.5.Recent Developments
    2. 15.2.Canva
    3. 15.3.CustomShow
    4. 15.4.Digideck
    5. 15.5.Easy WebContent
      1. 15.6.Beautiful.ai
    6. 15.7.FlowVella
    7. 15.8.Genially
    8. 15.9.GoAnimate
    9. 15.1.Haiku Deck
    10. 15.11.Powtoon

    List of Figures

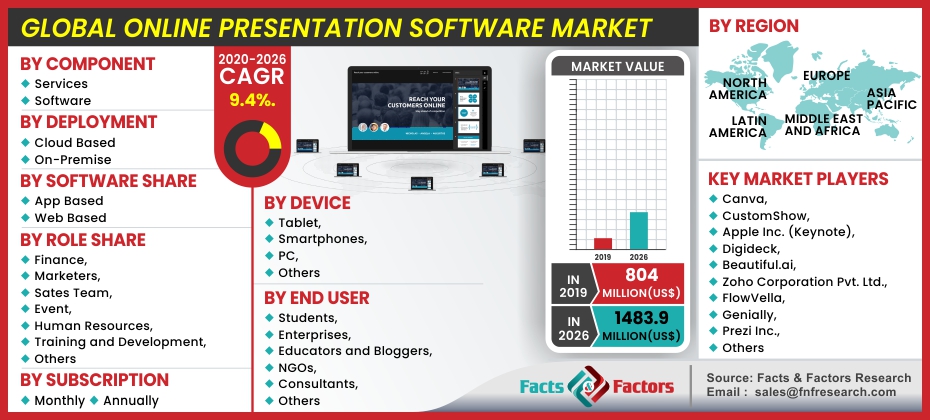
    FIG. 1	Global Online Presentation Software Market Revenue, 2016 – 2026 (USD Million)
    FIG. 2	Porter’s Five Forces Analysis for Global Online Presentation Software Market
    FIG. 3	Global Online Presentation Software Market Attractiveness, By Component
    FIG. 4	Global Online Presentation Software Market Attractiveness, By Deployment
    FIG. 5	Global Online Presentation Software Market Attractiveness, By Software
    FIG. 6	Global Online Presentation Software Market Attractiveness, By Role
    FIG. 7	Global Online Presentation Software Market Attractiveness, By Device
    FIG. 8	Global Online Presentation Software Market Attractiveness, By Subscription
    FIG. 9	Global Online Presentation Software Market Attractiveness, By End User
    FIG. 10	Global Online Presentation Software Market Attractiveness, By End-User
    FIG. 11	Company Share Analysis, 2019
    FIG. 12	Global Online Presentation Software Market Revenue Share, by Component, 2019 & 2026
    FIG. 13	Global Online Presentation Software Market for Type1, Revenue (USD Million) 2016 – 2026
    FIG. 14	Global Online Presentation Software Market for Type1, Revenue (USD Million) 2016 – 2026
    FIG. 15	Global Online Presentation Software Market Revenue Share, by Deployment, 2019 & 2026
    FIG. 16	Global Online Presentation Software Market for Type1, Revenue (USD Million) 2016 – 2026
    FIG. 17	Global Online Presentation Software Market for Type1, Revenue (USD Million) 2016 – 2026
    FIG. 18	Global Online Presentation Software Market Revenue Share, by Software, 2019 & 2026
    FIG. 19	Global Online Presentation Software Market for Type1, Revenue (USD Million) 2016 – 2026
    FIG. 20	Global Online Presentation Software Market for Type1, Revenue (USD Million) 2016 – 2026
    FIG. 21	Global Online Presentation Software Market Revenue Share, by Role, 2019 & 2026
    FIG. 22	Global Online Presentation Software Market for Type1, Revenue (USD Million) 2016 – 2026
    FIG. 23	Global Online Presentation Software Market for Type1, Revenue (USD Million) 2016 – 2026
    FIG. 24	Global Online Presentation Software Market for Type1, Revenue (USD Million) 2016 – 2026
    FIG. 25	Global Online Presentation Software Market for Type1, Revenue (USD Million) 2016 – 2026
    FIG. 26	Global Online Presentation Software Market for Type1, Revenue (USD Million) 2016 – 2026
    FIG. 27	Global Online Presentation Software Market for Type1, Revenue (USD Million) 2016 – 2026
    FIG. 28	Global Online Presentation Software Market for Type1, Revenue (USD Million) 2016 – 2026
    FIG. 29	Global Online Presentation Software Market Revenue Share, by Device, 2019 & 2026
    FIG. 30	Global Online Presentation Software Market for Type1, Revenue (USD Million) 2016 – 2026
    FIG. 31	Global Online Presentation Software Market for Type1, Revenue (USD Million) 2016 – 2026
    FIG. 32	Global Online Presentation Software Market for Type1, Revenue (USD Million) 2016 – 2026
    FIG. 33	Global Online Presentation Software Market for Type1, Revenue (USD Million) 2016 – 2026
    FIG. 34	Global Online Presentation Software Market Revenue Share, by Subscription, 2019 & 2026
    FIG. 35	Global Online Presentation Software Market for Type1, Revenue (USD Million) 2016 – 2026
    FIG. 36	Global Online Presentation Software Market for Type1, Revenue (USD Million) 2016 – 2026
    FIG. 37	Global Online Presentation Software Market Revenue Share, by End User, 2019 & 2026
    FIG. 38	Global Online Presentation Software Market for Type1, Revenue (USD Million) 2016 – 2026
    FIG. 39	Global Online Presentation Software Market for Type1, Revenue (USD Million) 2016 – 2026
    FIG. 40	Global Online Presentation Software Market for Type1, Revenue (USD Million) 2016 – 2026
    FIG. 41	Global Online Presentation Software Market for Type1, Revenue (USD Million) 2016 – 2026
    FIG. 42	Global Online Presentation Software Market for Type1, Revenue (USD Million) 2016 – 2026
    FIG. 43	Global Online Presentation Software Market for Type1, Revenue (USD Million) 2016 – 2026
    FIG. 44	Global Online Presentation Software Market Revenue Share, by Region, 2019 & 2026
    FIG. 45	North America Online Presentation Software Market Revenue, 2016 – 2026(USD Million)
    FIG. 46	Europe Online Presentation Software Market Revenue, 2016 – 2026(USD Million)
    FIG. 47	Asia Pacific Online Presentation Software Market Revenue, 2016 – 2026(USD Million)
    FIG. 48	Latin America Online Presentation Software Market Revenue, 2016 – 2026(USD Million)
    FIG. 49	The Middle-East and Africa Online Presentation Software Market Revenue, 2016 – 2026(USD Million)
    FIG. 50	Keynote Business Segment Revenue Share, 2018 (%)
    FIG. 51	Keynote Geographical Segment Revenue Share, 2018 (%)

    List of Tables

    TABLE 1	Global Online Presentation Software Market: Snapshot
    TABLE 2	Drivers of the Online Presentation Software Market: Impact Analysis
    TABLE 3	Restraints for the Online Presentation Software Market: Impact Analysis
    TABLE 4	Global Online Presentation Software Market Revenue, by Region, 2016 – 2026 (USD Million)
    TABLE 5	North America Online Presentation Software Market Revenue, by Country, 2016 – 2026 (USD Million)
    TABLE 6	North America Online Presentation Software Market Revenue, by Component, 2016 – 2026 (USD Million)
    TABLE 7	North America Online Presentation Software Market Revenue, by Deployment, 2016 – 2026 (USD Million)
    TABLE 8	North America Online Presentation Software Market Revenue, by Software, 2016 – 2026 (USD Million)
    TABLE 9	North America Online Presentation Software Market Revenue, by Role, 2016 – 2026 (USD Million)
    TABLE 10 North America Online Presentation Software Market Revenue, by Device, 2016 – 2026 (USD Million)
    TABLE 11 North America Online Presentation Software Market Revenue, by Subscription, 2016 – 2026 (USD Million)
    TABLE 12 North America Online Presentation Software Market Revenue, by End User, 2016 – 2026 (USD Million)
    TABLE 13 U.S. Online Presentation Software Market Revenue, by Component, 2016 – 2026 (USD Million)
    TABLE 14 U.S. Online Presentation Software Market Revenue, by Deployment, 2016 – 2026 (USD Million)
    TABLE 15 U.S. Online Presentation Software Market Revenue, by Software, 2016 – 2026 (USD Million)
    TABLE 16 U.S. Online Presentation Software Market Revenue, by Role, 2016 – 2026 (USD Million)
    TABLE 17 U.S. Online Presentation Software Market Revenue, by Device, 2016 – 2026 (USD Million)
    TABLE 18 U.S. Online Presentation Software Market Revenue, by Subscription, 2016 – 2026 (USD Million)
    TABLE 19 U.S. Online Presentation Software Market Revenue, by End User, 2016 – 2026 (USD Million)
    TABLE 20 Canada Online Presentation Software Market Revenue, by Component, 2016 – 2026 (USD Million)
    TABLE 21 Canada Online Presentation Software Market Revenue, by Deployment, 2016 – 2026 (USD Million)
    TABLE 22 Canada Online Presentation Software Market Revenue, by Software, 2016 – 2026 (USD Million)
    TABLE 23 Canada Online Presentation Software Market Revenue, by Role, 2016 – 2026 (USD Million)
    TABLE 24 Canada Online Presentation Software Market Revenue, by Device, 2016 – 2026 (USD Million)
    TABLE 25 Canada Online Presentation Software Market Revenue, by Subscription, 2016 – 2026 (USD Million)
    TABLE 26 Canada Online Presentation Software Market Revenue, by End User, 2016 – 2026 (USD Million)
    TABLE 27 Europe Online Presentation Software Market Revenue, by Country, 2016 – 2026 (USD Million)
    TABLE 28 Europe Online Presentation Software Market Revenue, by Component, 2016 – 2026 (USD Million)
    TABLE 29 Europe Online Presentation Software Market Revenue, by Deployment, 2016 – 2026 (USD Million)
    TABLE 30 Europe Online Presentation Software Market Revenue, by Software, 2016 – 2026 (USD Million)
    TABLE 31 Europe Online Presentation Software Market Revenue, by Role, 2016 – 2026 (USD Million)
    TABLE 32 Europe Online Presentation Software Market Revenue, by Device, 2016 – 2026 (USD Million)
    TABLE 33 Europe Online Presentation Software Market Revenue, by Subscription, 2016 – 2026 (USD Million)
    TABLE 34 Europe Online Presentation Software Market Revenue, by End User, 2016 – 2026 (USD Million)
    TABLE 35 Germany Online Presentation Software Market Revenue, by Component, 2016 – 2026 (USD Million)
    TABLE 36 Germany Online Presentation Software Market Revenue, by Deployment, 2016 – 2026 (USD Million)
    TABLE 37 Germany Online Presentation Software Market Revenue, by Software, 2016 – 2026 (USD Million)
    TABLE 38 Germany Online Presentation Software Market Revenue, by Role, 2016 – 2026 (USD Million)
    TABLE 39 Germany Online Presentation Software Market Revenue, by Device, 2016 – 2026 (USD Million)
    TABLE 40 Germany Online Presentation Software Market Revenue, by Subscription, 2016 – 2026 (USD Million)
    TABLE 41 Germany Online Presentation Software Market Revenue, by End User, 2016 – 2026 (USD Million)
    TABLE 42 France Online Presentation Software Market Revenue, by Component, 2016 – 2026 (USD Million)
    TABLE 43 France Online Presentation Software Market Revenue, by Deployment, 2016 – 2026 (USD Million)
    TABLE 44 France Online Presentation Software Market Revenue, by Software, 2016 – 2026 (USD Million)
    TABLE 45 France Online Presentation Software Market Revenue, by Role, 2016 – 2026 (USD Million)
    TABLE 46 France Online Presentation Software Market Revenue, by Device, 2016 – 2026 (USD Million)
    TABLE 47 France Online Presentation Software Market Revenue, by Subscription, 2016 – 2026 (USD Million)
    TABLE 48 France Online Presentation Software Market Revenue, by End User, 2016 – 2026 (USD Million)
    TABLE 49 U.K. Online Presentation Software Market Revenue, by Component, 2016 – 2026 (USD Million)
    TABLE 50 U.K. Online Presentation Software Market Revenue, by Deployment, 2016 – 2026 (USD Million)
    TABLE 51 U.K. Online Presentation Software Market Revenue, by Software, 2016 – 2026 (USD Million)
    TABLE 52 U.K. Online Presentation Software Market Revenue, by Role, 2016 – 2026 (USD Million)
    TABLE 53 U.K. Online Presentation Software Market Revenue, by Device, 2016 – 2026 (USD Million)
    TABLE 54 U.K. Online Presentation Software Market Revenue, by Subscription, 2016 – 2026 (USD Million)
    TABLE 55 U.K. Online Presentation Software Market Revenue, by End User, 2016 – 2026 (USD Million)
    TABLE 56 Italy Online Presentation Software Market Revenue, by Component, 2016 – 2026 (USD Million)
    TABLE 57 Italy Online Presentation Software Market Revenue, by Deployment, 2016 – 2026 (USD Million)
    TABLE 58 Italy Online Presentation Software Market Revenue, by Software, 2016 – 2026 (USD Million)
    TABLE 59 Italy Online Presentation Software Market Revenue, by Role, 2016 – 2026 (USD Million)
    TABLE 60 Italy Online Presentation Software Market Revenue, by Device, 2016 – 2026 (USD Million)
    TABLE 61 Italy Online Presentation Software Market Revenue, by Subscription, 2016 – 2026 (USD Million)
    TABLE 62 Italy Online Presentation Software Market Revenue, by End User, 2016 – 2026 (USD Million)
    TABLE 63 Spain Online Presentation Software Market Revenue, by Component, 2016 – 2026 (USD Million)
    TABLE 64 Spain Online Presentation Software Market Revenue, by Deployment, 2016 – 2026 (USD Million)
    TABLE 65 Spain Online Presentation Software Market Revenue, by Software, 2016 – 2026 (USD Million)
    TABLE 66 Spain Online Presentation Software Market Revenue, by Role, 2016 – 2026 (USD Million)
    TABLE 67 Spain Online Presentation Software Market Revenue, by Device, 2016 – 2026 (USD Million)
    TABLE 68 Spain Online Presentation Software Market Revenue, by Subscription, 2016 – 2026 (USD Million)
    TABLE 69 Spain Online Presentation Software Market Revenue, by End User, 2016 – 2026 (USD Million)
    TABLE 70 Rest of Europe Online Presentation Software Market Revenue, by Component, 2016 – 2026 (USD Million)
    TABLE 71 Rest of Europe Online Presentation Software Market Revenue, by Deployment, 2016 – 2026 (USD Million)
    TABLE 72 Rest of Europe Online Presentation Software Market Revenue, by Software, 2016 – 2026 (USD Million)
    TABLE 73 Rest of Europe Online Presentation Software Market Revenue, by Role, 2016 – 2026 (USD Million)
    TABLE 74 Rest of Europe Online Presentation Software Market Revenue, by Device, 2016 – 2026 (USD Million)
    TABLE 75 Rest of Europe Online Presentation Software Market Revenue, by Subscription, 2016 – 2026 (USD Million)
    TABLE 76 Rest of Europe Online Presentation Software Market Revenue, by End User, 2016 – 2026 (USD Million)
    TABLE 77 Asia Pacific Online Presentation Software Market Revenue, by Country, 2016 – 2026 (USD Million)
    TABLE 78 Asia Pacific Online Presentation Software Market Revenue, by Component, 2016 – 2026 (USD Million)
    TABLE 79 Asia Pacific Online Presentation Software Market Revenue, by Deployment, 2016 – 2026 (USD Million)
    TABLE 80 Asia Pacific Online Presentation Software Market Revenue, by Software, 2016 – 2026 (USD Million)
    TABLE 81 Asia Pacific Online Presentation Software Market Revenue, by Role, 2016 – 2026 (USD Million)
    TABLE 82 Asia Pacific Online Presentation Software Market Revenue, by Device, 2016 – 2026 (USD Million)
    TABLE 83 Asia Pacific Online Presentation Software Market Revenue, by Subscription, 2016 – 2026 (USD Million)
    TABLE 84 Asia Pacific Online Presentation Software Market Revenue, by End User, 2016 – 2026 (USD Million)
    TABLE 85 China Online Presentation Software Market Revenue, by Component, 2016 – 2026 (USD Million)
    TABLE 86 China Online Presentation Software Market Revenue, by Deployment, 2016 – 2026 (USD Million)
    TABLE 87 China Online Presentation Software Market Revenue, by Software, 2016 – 2026 (USD Million)
    TABLE 88 China Online Presentation Software Market Revenue, by Role, 2016 – 2026 (USD Million)
    TABLE 89 China Online Presentation Software Market Revenue, by Device, 2016 – 2026 (USD Million)
    TABLE 90 China Online Presentation Software Market Revenue, by Subscription, 2016 – 2026 (USD Million)
    TABLE 91 China Online Presentation Software Market Revenue, by End User, 2016 – 2026 (USD Million)
    TABLE 92 Japan Online Presentation Software Market Revenue, by Component, 2016 – 2026 (USD Million)
    TABLE 93 Japan Online Presentation Software Market Revenue, by Deployment, 2016 – 2026 (USD Million)
    TABLE 94 Japan Online Presentation Software Market Revenue, by Software, 2016 – 2026 (USD Million)
    TABLE 95 Japan Online Presentation Software Market Revenue, by Role, 2016 – 2026 (USD Million)
    TABLE 96 Japan Online Presentation Software Market Revenue, by Device, 2016 – 2026 (USD Million)
    TABLE 97 Japan Online Presentation Software Market Revenue, by Subscription, 2016 – 2026 (USD Million)
    TABLE 98 Japan Online Presentation Software Market Revenue, by End User, 2016 – 2026 (USD Million)
    TABLE 99 India Online Presentation Software Market Revenue, by Component, 2016 – 2026 (USD Million)
    TABLE 100 India Online Presentation Software Market Revenue, by Deployment, 2016 – 2026 (USD Million)
    TABLE 101 India Online Presentation Software Market Revenue, by Software, 2016 – 2026 (USD Million)
    TABLE 102 India Online Presentation Software Market Revenue, by Role, 2016 – 2026 (USD Million)
    TABLE 103 India Online Presentation Software Market Revenue, by Device, 2016 – 2026 (USD Million)
    TABLE 104 India Online Presentation Software Market Revenue, by Subscription, 2016 – 2026 (USD Million)
    TABLE 105 India Online Presentation Software Market Revenue, by End User, 2016 – 2026 (USD Million)
    TABLE 106 South Korea Online Presentation Software Market Revenue, by Component, 2016 – 2026 (USD Million)
    TABLE 107 South Korea Online Presentation Software Market Revenue, by Deployment, 2016 – 2026 (USD Million)
    TABLE 108 South Korea Online Presentation Software Market Revenue, by Software, 2016 – 2026 (USD Million)
    TABLE 109 South Korea Online Presentation Software Market Revenue, by Role, 2016 – 2026 (USD Million)
    TABLE 110 South Korea Online Presentation Software Market Revenue, by Device, 2016 – 2026 (USD Million)
    TABLE 111 South Korea Online Presentation Software Market Revenue, by Subscription, 2016 – 2026 (USD Million)
    TABLE 112 South Korea Online Presentation Software Market Revenue, by End User, 2016 – 2026 (USD Million)
    TABLE 113 South-East Asia Online Presentation Software Market Revenue, by Component, 2016 – 2026 (USD Million)
    TABLE 114 South-East Asia Online Presentation Software Market Revenue, by Deployment, 2016 – 2026 (USD Million)
    TABLE 115 South-East Asia Online Presentation Software Market Revenue, by Software, 2016 – 2026 (USD Million)
    TABLE 116 South-East Asia Online Presentation Software Market Revenue, by Role, 2016 – 2026 (USD Million)
    TABLE 117 South-East Asia Online Presentation Software Market Revenue, by Device, 2016 – 2026 (USD Million)
    TABLE 118 South-East Asia Online Presentation Software Market Revenue, by Subscription, 2016 – 2026 (USD Million)
    TABLE 119 South-East Asia Online Presentation Software Market Revenue, by End User, 2016 – 2026 (USD Million)
    TABLE 120 Rest of Asia Pacific Online Presentation Software Market Revenue, by Component, 2016 – 2026 (USD Million)
    TABLE 121 Rest of Asia Pacific Online Presentation Software Market Revenue, by Deployment, 2016 – 2026 (USD Million)
    TABLE 122 Rest of Asia Pacific Online Presentation Software Market Revenue, by Software, 2016 – 2026 (USD Million)
    TABLE 123 Rest of Asia Pacific Online Presentation Software Market Revenue, by Role, 2016 – 2026 (USD Million)
    TABLE 124 Rest of Asia Pacific Online Presentation Software Market Revenue, by Device, 2016 – 2026 (USD Million)
    TABLE 125 Rest of Asia Pacific Online Presentation Software Market Revenue, by Subscription, 2016 – 2026 (USD Million)
    TABLE 126 Rest of Asia Pacific Online Presentation Software Market Revenue, by End User, 2016 – 2026 (USD Million)
    TABLE 127 Latin America Online Presentation Software Market Revenue, by Country, 2016 – 2026 (USD Million)
    TABLE 128 Latin America Online Presentation Software Market Revenue, by Component, 2016 – 2026 (USD Million)
    TABLE 129 Latin America Online Presentation Software Market Revenue, by Deployment, 2016 – 2026 (USD Million)
    TABLE 130 Latin America Online Presentation Software Market Revenue, by Software, 2016 – 2026 (USD Million)
    TABLE 131 Latin America Online Presentation Software Market Revenue, by Role, 2016 – 2026 (USD Million)
    TABLE 132 Latin America Online Presentation Software Market Revenue, by Device, 2016 – 2026 (USD Million)
    TABLE 133 Latin America Online Presentation Software Market Revenue, by Subscription, 2016 – 2026 (USD Million)
    TABLE 134 Latin America Online Presentation Software Market Revenue, by End User, 2016 – 2026 (USD Million)
    TABLE 135 Brazil Online Presentation Software Market Revenue, by Component, 2016 – 2026 (USD Million)
    TABLE 136 Brazil Online Presentation Software Market Revenue, by Deployment, 2016 – 2026 (USD Million)
    TABLE 137 Brazil Online Presentation Software Market Revenue, by Software, 2016 – 2026 (USD Million)
    TABLE 138 Brazil Online Presentation Software Market Revenue, by Role, 2016 – 2026 (USD Million)
    TABLE 139 Brazil Online Presentation Software Market Revenue, by Device, 2016 – 2026 (USD Million)
    TABLE 140 Brazil Online Presentation Software Market Revenue, by Subscription, 2016 – 2026 (USD Million)
    TABLE 141 Brazil Online Presentation Software Market Revenue, by End User, 2016 – 2026 (USD Million)
    TABLE 142 Mexico Online Presentation Software Market Revenue, by Component, 2016 – 2026 (USD Million)
    TABLE 143 Mexico Online Presentation Software Market Revenue, by Deployment, 2016 – 2026 (USD Million)
    TABLE 144 Mexico Online Presentation Software Market Revenue, by Software, 2016 – 2026 (USD Million)
    TABLE 145 Mexico Online Presentation Software Market Revenue, by Role, 2016 – 2026 (USD Million)
    TABLE 146 Mexico Online Presentation Software Market Revenue, by Device, 2016 – 2026 (USD Million)
    TABLE 147 Mexico Online Presentation Software Market Revenue, by Subscription, 2016 – 2026 (USD Million)
    TABLE 148 Mexico Online Presentation Software Market Revenue, by End User, 2016 – 2026 (USD Million)
    TABLE 149 Rest of Latin America Online Presentation Software Market Revenue, by Component, 2016 – 2026 (USD Million)
    TABLE 150 Rest of Latin America Online Presentation Software Market Revenue, by Deployment, 2016 – 2026 (USD Million)
    TABLE 151 Rest of Latin America Online Presentation Software Market Revenue, by Software, 2016 – 2026 (USD Million)
    TABLE 152 Rest of Latin America Online Presentation Software Market Revenue, by Role, 2016 – 2026 (USD Million)
    TABLE 153 Rest of Latin America Online Presentation Software Market Revenue, by Device, 2016 – 2026 (USD Million)
    TABLE 154 Rest of Latin America Online Presentation Software Market Revenue, by Subscription, 2016 – 2026 (USD Million)
    TABLE 155 Rest of Latin America Online Presentation Software Market Revenue, by End User, 2016 – 2026 (USD Million)
    TABLE 156 The Middle-East and Africa Online Presentation Software Market Revenue, by Country, 2016 – 2026 (USD Million)
    TABLE 157 The Middle-East and Africa Online Presentation Software Market Revenue, by Component, 2016 – 2026 (USD Million)
    TABLE 158 The Middle-East and Africa Online Presentation Software Market Revenue, by Deployment, 2016 – 2026 (USD Million)
    TABLE 159 The Middle-East and Africa Online Presentation Software Market Revenue, by Software, 2016 – 2026 (USD Million)
    TABLE 160 The Middle-East and Africa Online Presentation Software Market Revenue, by Role, 2016 – 2026 (USD Million)
    TABLE 161 The Middle-East and Africa Online Presentation Software Market Revenue, by Device, 2016 – 2026 (USD Million)
    TABLE 162 The Middle-East and Africa Online Presentation Software Market Revenue, by Subscription, 2016 – 2026 (USD Million)
    TABLE 163 The Middle-East and Africa Online Presentation Software Market Revenue, by End User, 2016 – 2026 (USD Million)
    TABLE 164 GCC Countries Online Presentation Software Market Revenue, by Component, 2016 – 2026 (USD Million)
    TABLE 165 GCC Countries Online Presentation Software Market Revenue, by Deployment, 2016 – 2026 (USD Million)
    TABLE 166 GCC Countries Online Presentation Software Market Revenue, by Software, 2016 – 2026 (USD Million)
    TABLE 167 GCC Countries Online Presentation Software Market Revenue, by Role, 2016 – 2026 (USD Million)
    TABLE 168 GCC Countries Online Presentation Software Market Revenue, by Device, 2016 – 2026 (USD Million)
    TABLE 169 GCC Countries Online Presentation Software Market Revenue, by Subscription, 2016 – 2026 (USD Million)
    TABLE 170 GCC Countries Online Presentation Software Market Revenue, by End User, 2016 – 2026 (USD Million)
    TABLE 171 South Africa Online Presentation Software Market Revenue, by Component, 2016 – 2026 (USD Million)
    TABLE 172 South Africa Online Presentation Software Market Revenue, by Deployment, 2016 – 2026 (USD Million)
    TABLE 173 South Africa Online Presentation Software Market Revenue, by Software, 2016 – 2026 (USD Million)
    TABLE 174 South Africa Online Presentation Software Market Revenue, by Role, 2016 – 2026 (USD Million)
    TABLE 175 South Africa Online Presentation Software Market Revenue, by Device, 2016 – 2026 (USD Million)
    TABLE 176 South Africa Online Presentation Software Market Revenue, by Subscription, 2016 – 2026 (USD Million)
    TABLE 177 South Africa Online Presentation Software Market Revenue, by End User, 2016 – 2026 (USD Million)
    TABLE 178 Rest of Middle-East Africa Online Presentation Software Market Revenue, by Component, 2016 – 2026 (USD Million)
    TABLE 179 Rest of Middle-East Africa Online Presentation Software Market Revenue, by Deployment, 2016 – 2026 (USD Million)
    TABLE 180 Rest of Middle-East Africa Online Presentation Software Market Revenue, by Software, 2016 – 2026 (USD Million)
    TABLE 181 Rest of Middle-East Africa Online Presentation Software Market Revenue, by Role, 2016 – 2026 (USD Million)
    TABLE 182 Rest of Middle-East Africa Online Presentation Software Market Revenue, by Device, 2016 – 2026 (USD Million)
    TABLE 183 Rest of Middle-East Africa Online Presentation Software Market Revenue, by Subscription, 2016 – 2026 (USD Million)
    TABLE 184 Rest of Middle-East Africa Online Presentation Software Market Revenue, by End User, 2016 – 2026 (USD Million)
    

  • Industry Major Market Players

    • Canva
    • CustomShow
    • Apple Inc. (Keynote)
    • Digideck
    • Beautiful.ai
    • Zoho Corporation Pvt. Ltd.
    • FlowVella
    • Genially
    • Prezi Inc.
    • GoAnimate Inc. (Vyond)
    • Powtoon Ltd.
    • Easy WebContent Inc. (Visme)
    • Slidebean Inc.
    • SlideDog
    • Slides Inc.
    • Haiku Deck Inc.