Search Market Research Report

Discover Our Latest Reports
Discover Our Featured Reports
Discover Top Selling Reports

Oilfield Services Market Size, Share Global Analysis Report, 2020–2026

report img

Oilfield Services Market By Service (Pressure Pumping Services, Oil Country Tubular Goods, Wireline Services, Well Completion Equipment & Services, Well Intervention Services, Drilling & Completion Fluid Services, Drilling Waste Management Services, and Coiled Tubing Services) and By Application (Offshore, and Onshore) and Type (Equipment rental, Field operation, and Analytical services): Global Industry Outlook, Market Size, Business Intelligence, Consumer Preferences, Statistical Surveys, Comprehensive Analysis, Historical Developments, Current Trends, and Forecast 2020–2026

Industry Insights

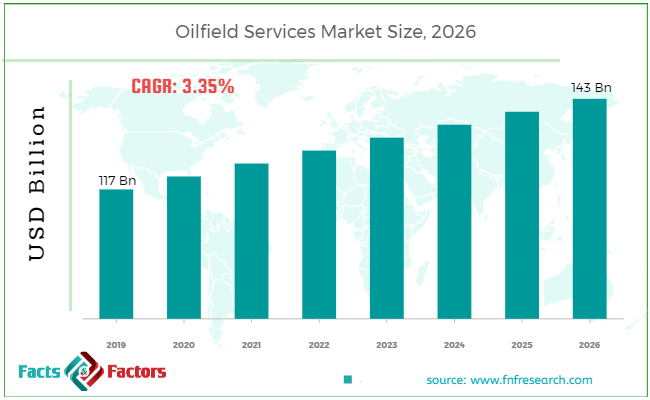
[189+ Pages Report] According to the report published by Facts Factors, the global oilfield services market size was worth around USD 117 billion in 2019 and is predicted to grow to around USD 143 billion by 2026 with a compound annual growth rate (CAGR) of roughly 3.35% between 2020 and 2026. The report analyzes the global oilfield services market drivers, restraints/challenges, and the effect they have on the demands during the projection period. In addition, the report explores emerging opportunities in the oilfield services market.

Oilfield Services Market

To know more about this report | Request Free Sample Copy

The oilfield services market report analyzes and notifies the industry statistics at the global as well as regional and country levels in order to acquire a thorough perspective of the entire oilfield services market. The historical and past insights are provided for FY 2016 to FY 2019 whereas projected trends are delivered for FY 2020 to FY 2026. The quantitative and numerical data is represented in terms of both volume (Units) and value (USD Million) from FY 2016 – 2026.


logoKey Insights from Primary Research

  • As per our primary respondents, the global oilfield services market is set to grow annually at a rate of around 3.35%
  • It was established through primary research that the oilfield services market was valued at around USD 117 Million in 2019
  • Americas was the leading market for oilfield services market in 2019.
  • On basis of the application segment, ‘onshore’ dominated the global oilfield services market in 2019.
  • The global oilfield services market is expected to reach around USD 143 Million by 2026.

logoKey Recommendations from Analysts

  • As per our analysts, the global oilfield services market is expected to grow significantly over the forecast period.
  • The strategic and competitive advantage provided by the technological developments in oilfield services is anticipated to be the key factor driving this market globally.
  • As per analysts, due to the depletion of onshore resources, operators are looking for offshore applications as an alternative.
  • Our team of analysts has identified new exploration and production activities in both onshore and offshore areas that will support the growth of the market.
  • Among regions, the americas is expected to be the fastest-growing market for oilfield services in the years to come.

The quantitative data is further underlined and reinforced by comprehensive qualitative data which comprises various across-the-board market dynamics. The rationales which directly or indirectly impact the oilfield services industry are exemplified through parameters such as growth drivers, restraints, challenges, and opportunities among other impacting factors.

Throughout our research report, we have encompassed all the proven models and tools of industry analysis and extensively illustrated all the key business strategies and business models adopted in the oilfield services industry. The report provides an all-inclusive and detailed competitive landscape prevalent in the oilfield services market.

The report utilizes established industry analysis tools and models such as Porter’s Five Forces framework to analyze and recognize critical business strategies adopted by various stakeholders involved in the entire value chain of the oilfield services industry. The oilfield services market report additionally employs SWOT analysis and PESTLE analysis models for further in-depth analysis.

The report study further includes an in-depth analysis of industry players' market shares and provides an overview of leading players' market positions in the oilfield services sector. Key strategic developments in the oilfield services market competitive landscape such as acquisitions & mergers, inaugurations of different products and services, partnerships & joint ventures, MoU agreements, VC & funding activities, R&D activities, and geographic expansion among other noteworthy activities by key players of the oilfield services market are appropriately highlighted in the report.

The global oil field services market has witnessed significant growth in recent years due to an increase in exploration and production (E&P) activities coupled with the increasing growth in the activities related to offshore areas across the globe. The completion and production services segment is a major part of the global oil field services market. Mostly in the discovery, appraisal, or development phase, the proportion of oil produced from deep water fields is expected to grow significantly during the future years. Deepwater projects are among the riskiest and most technologically complex in the industry.

As a result, they are extremely capital-intensive and typically take five to eight years to bring into production. Although, considerable technological progress has been made oilfield service companies believe that there is still much scope to reach greater depths and make production more cost-effective. Moreover, technological advancement is likely to set new avenues for the market participants operating in the market over the analysis period.

The oilfield services market research report delivers an acute valuation and taxonomy of the oilfield services industry by practically splitting the market on the basis of different types, applications, and regions. Through the analysis of the historical and projected trends, all the segments and sub-segments were evaluated through the bottom-up approach, and different market sizes have been projected for FY 2020 to FY 2026.

logoReport Scope

Report Attribute

Details

Market Size in 2019

USD 117 Billion

Projected Market Size in 2026

USD 143 Billion

CAGR Growth Rate

3.35% CAGR

Base Year

2019

Forecast Years

2020-2026

Key Market Players

Baker Hughes Incorporated, Halliburton Company, Schlumberger Limited, Weatherford International PLC, National Oilwell Varco, Inc., China Oilfield Services Limited (COSL), Superior Energy Services, Inc., Technipfmc.PLC, Trican Well Service, Ltd., Welltec International APS, Nabors Industries, Ltd., and Nordic Well Services, LLC, and Others

Key Segment

By Service, Application, Type, and Region

Major Regions Covered

North America, Europe, Asia Pacific, Latin America, and the Middle East & Africa

Purchase Options

Request customized purchase options to meet your research needs. Explore purchase options

The regional segmentation of the oilfield services industry includes the complete classification of all the major continents including North America, Latin America, Europe, Asia Pacific, and the Middle East & Africa. Further, country-wise data for the oilfield services industry is provided for the leading economies of the world.

The oilfield services market is segmented based on service, type, and application. On the basis of service, the market has been fragmented into pressure pumping services, oil country tubular goods, wireline services, well completion equipment & services, well intervention services, drilling & completion fluid services, drilling waste management services, and coiled tubing services. In terms of application, it has been classified into offshore, and onshore. On the basis of type, the market is divided into equipment rental, field operation, and analytical services.

logoSome of the essential players operating in the oilfield services market, but not restricted include:

  • Baker Hughes Incorporated
  • Halliburton Company
  • Schlumberger Limited
  • Weatherford International PLC
  • National Oilwell Varco Inc.
  • China Oilfield Services Limited (COSL)
  • Superior Energy Services Inc.
  • Technipfmc.PLC
  • Trican Well Service Ltd.
  • Welltec International APS
  • Nabors Industries Ltd.,
  • Nordic Well Services LLC

The taxonomy of the oilfield services industry by its scope and segmentation is as follows:

logo By Service Segmentation Analysis

  • Pressure Pumping Services
  • Oil Country Tubular Goods
  • Wireline Services
  • Well Completion Equipment & Services
  • Well Intervention Services
  • Drilling & Completion Fluid Services
  • Drilling Waste Management Services
  • Coiled Tubing Services

logo By Application Segmentation Analysis

  • Offshore
  • Onshore

logo By Type Segmentation Analysis

  • Equipment rental
  • Field operation
  • Analytical services

logo Regional Segmentation Analysis (Customizable)

  • North America
    • The U.S.
    • Canada
  • Europe
    • Germany
    • The UK
    • France
    • Spain
    • Italy
    • Rest of Europe
  • Asia Pacific
    • China
    • Japan
    • India
    • South Korea
    • Southeast Asia
    • Rest of Asia Pacific
  • Latin America
    • Brazil
    • Mexico
    • Rest of Latin America
  • Middle East & Africa
    • GCC
    • South Africa
    • Rest of Middle East & Africa

Table of Content

  1. CHAPTER 1. Executive Summary
  2. CHAPTER 2. Oilfield Services market – Service Analysis
    1. 2.1. Global Oilfield Services Market – Service Overview
    2. 2.2. Global Oilfield Services Market Share, by Service, 2018 & 2025 (USD Million)
    3. 2.3. Pressure Pumping Services
      1. 2.3.1. Global Pressure Pumping Services Oilfield Services Market, 2016-2026 (USD Million)
    4. 2.4. Oil Country Tubular Goods
      1. 2.4.1. Global Oil Country Tubular Goods Oilfield Services Market, 2016-2026 (USD Million)
    5. 2.5. Wireline Services
      1. 2.5.1. Global Wireline Services Oilfield Services Market, 2016-2026 (USD Million)
    6. 2.6. Well Completion Equipment & Services
      1. 2.6.1. Global Well Completion Equipment & Services Oilfield Services Market, 2016-2026 (USD Million)
    7. 2.7. Well Intervention Services
      1. 2.7.1. Global Well Intervention Services Oilfield Services Market, 2016-2026 (USD Million)
    8. 2.8. Drilling & Completion Fluid Services
      1. 2.8.1. Global Drilling & Completion Fluid Services Oilfield Services Market, 2016-2026 (USD Million)
    9. 2.9. Drilling Waste Management Services
      1. 2.9.1. Global Drilling Waste Management Services Oilfield Services Market, 2016-2026 (USD Million)
    10. 2.10. Coiled Tubing Services
      1. 2.10.1. Global Coiled Tubing Services Oilfield Services Market, 2016-2026 (USD Million)
  3. CHAPTER 3. Oilfield Services market – Application Analysis
    1. 3.1. Global Oilfield Services Market – Application Overview
    2. 3.2. Global Oilfield Services Market Share, by Application, 2018 & 2025 (USD Million)
    3. 3.3. Offshore
      1. 3.3.1. Global Offshore Oilfield Services Market, 2016-2026 (USD Million)
    4. 3.4. Onshore
      1. 3.4.1. Global Onshore Oilfield Services Market, 2016-2026 (USD Million)
  4. CHAPTER 4. Oilfield Services market – Type Analysis
    1. 4.1. Global Oilfield Services Market – Type Overview
    2. 4.2. Global Oilfield Services Market Share, by Type, 2018 & 2025 (USD Million)
    3. 4.3. Equipment Rental
      1. 4.3.1. Global Equipment Rental Oilfield Services Market, 2016-2026 (USD Million)
    4. 4.4. Field operation
      1. 4.4.1. Global Field operation Oilfield Services Market, 2016-2026 (USD Million)
    5. 4.5. Analytical services
      1. 4.5.1. Global Analytical services Oilfield Services Market, 2016-2026 (USD Million)
  5. CHAPTER 5. Oilfield Services market – Regional Analysis
    1. 5.1. Global Oilfield Services Market Regional Overview
    2. 5.2. Global Oilfield Services Market Share, by Region, 2018 & 2025 (Value)
    3. 5.3. North America
      1. 5.3.1. North America Oilfield Services Market size and forecast, 2016-2026
      2. 5.3.2. North America Oilfield Services Market, by Country, 2018 & 2025 (USD Million)
      3. 5.3.3. North America Oilfield Services Market, by Service, 2016-2026
        1. 5.3.3.1. North America Oilfield Services Market, by Service, 2016-2026 (USD Million)
      4. 5.3.4. North America Oilfield Services Market, by Application, 2016-2026
        1. 5.3.4.1. North America Oilfield Services Market, by Application, 2016-2026 (USD Million)
      5. 5.3.5. North America Oilfield Services Market, by Type, 2016-2026
        1. 5.3.5.1. North America Oilfield Services Market, by Type, 2016-2026 (USD Million)
      6. 5.3.6. U.S.
        1. 5.3.6.1. U.S. Market size and forecast, 2016-2026 (USD Million)
      7. 5.3.7. Canada
        1. 5.3.7.1. Canada Market size and forecast, 2016-2026 (USD Million)
    4. 5.4. Europe
      1. 5.4.1. Europe Oilfield Services Market size and forecast, 2016-2026
      2. 5.4.2. Europe Oilfield Services Market, by Country, 2018 & 2025 (USD Million)
      3. 5.4.3. Europe Oilfield Services Market, by Service, 2016-2026
        1. 5.4.3.1. Europe Oilfield Services Market, by Service, 2016-2026 (USD Million)
      4. 5.4.4. Europe Oilfield Services Market, by Application, 2016-2026
        1. 5.4.4.1. Europe Oilfield Services Market, by Application, 2016-2026 (USD Million)
      5. 5.4.5. Europe Oilfield Services Market, by Type, 2016-2026
        1. 5.4.5.1. Europe Oilfield Services Market, by Type, 2016-2026 (USD Million)
      6. 5.4.6. Germany
        1. 5.4.6.1. Germany Market size and forecast, 2016-2026 (USD Million)
      7. 5.4.7. France
        1. 5.4.7.1. France Market size and forecast, 2016-2026 (USD Million)
      8. 5.4.8. U.K.
        1. 5.4.8.1. U.K. Market size and forecast, 2016-2026 (USD Million)
      9. 5.4.9. Italy
        1. 5.4.9.1. Italy Market size and forecast, 2016-2026 (USD Million)
      10. 5.4.10. Spain
        1. 5.4.10.1. Spain Market size and forecast, 2016-2026 (USD Million)
      11. 5.4.11. Rest of Europe
        1. 5.4.11.1. Rest of Europe Market size and forecast, 2016-2026 (USD Million)
    5. 5.5. Asia Pacific
      1. 5.5.1. Asia Pacific Oilfield Services Market size and forecast, 2016-2026
      2. 5.5.2. Asia Pacific Oilfield Services Market, by Country, 2018 & 2025 (USD Million)
      3. 5.5.3. Asia Pacific Oilfield Services Market, by Service, 2016-2026
        1. 5.5.3.1. Asia Pacific Oilfield Services Market, by Service, 2016-2026 (USD Million)
      4. 5.5.4. Asia Pacific Oilfield Services Market, by Application, 2016-2026
        1. 5.5.4.1. Asia Pacific Oilfield Services Market, by Application, 2016-2026 (USD Million)
      5. 5.5.5. Asia Pacific Oilfield Services Market, by Type, 2016-2026
        1. 5.5.5.1. Asia Pacific Oilfield Services Market, by Type, 2016-2026 (USD Million)
      6. 5.5.6. China
        1. 5.5.6.1. China Market size and forecast, 2016-2026 (USD Million)
      7. 5.5.7. Japan
        1. 5.5.7.1. Japan Market size and forecast, 2016-2026 (USD Million)
      8. 5.5.8. India
        1. 5.5.8.1. India Market size and forecast, 2016-2026 (USD Million)
      9. 5.5.9. South Korea
        1. 5.5.9.1. South Korea Market size and forecast, 2016-2026 (USD Million)
      10. 5.5.10. South-East Asia
        1. 5.5.10.1. South-East Asia Market size and forecast, 2016-2026 (USD Million)
      11. 5.5.11. Rest of Asia Pacific
        1. 5.5.11.1. Rest of Asia Pacific Market size and forecast, 2016-2026 (USD Million)
    6. 5.6. Latin America
      1. 5.6.1. Latin America Oilfield Services Market size and forecast, 2016-2026
      2. 5.6.2. Latin America Oilfield Services Market, by Country, 2018 & 2025 (USD Million)
      3. 5.6.3. Latin America Oilfield Services Market, by Service, 2016-2026
        1. 5.6.3.1. Latin America Oilfield Services Market, by Service, 2016-2026 (USD Million)
      4. 5.6.4. Latin America Oilfield Services Market, by Application, 2016-2026
        1. 5.6.4.1. Latin America Oilfield Services Market, by Application, 2016-2026 (USD Million)
      5. 5.6.5. Latin America Oilfield Services Market, by Type, 2016-2026
        1. 5.6.5.1. Latin America Oilfield Services Market, by Type, 2016-2026 (USD Million)
      6. 5.6.6. Brazil
        1. 5.6.6.1. Brazil Market size and forecast, 2016-2026 (USD Million)
      7. 5.6.7. Mexico
        1. 5.6.7.1. Mexico Market size and forecast, 2016-2026 (USD Million)
      8. 5.6.8. Rest of Latin America
        1. 5.6.8.1. Rest of Latin America Market size and forecast, 2016-2026 (USD Million)
    7. 5.7. The Middle-East and Africa
      1. 5.7.1. The Middle-East and Africa Oilfield Services Market size and forecast, 2016-2026
      2. 5.7.2. The Middle-East and Africa Oilfield Services Market, by Country, 2018 & 2025 (USD Million)
      3. 5.7.3. The Middle-East and Africa Oilfield Services Market, by Service, 2016-2026
        1. 5.7.3.1. The Middle-East and Africa Oilfield Services Market, by Service, 2016-2026 (USD Million)
      4. 5.7.4. The Middle-East and Africa Oilfield Services Market, by Application, 2016-2026
        1. 5.7.4.1. The Middle-East and Africa Oilfield Services Market, by Application, 2016-2026 (USD Million)
      5. 5.7.5. The Middle-East and Africa Oilfield Services Market, by Type, 2016-2026
        1. 5.7.5.1. The Middle-East and Africa Oilfield Services Market, by Type, 2016-2026 (USD Million)
      6. 5.7.6. GCC Countries
        1. 5.7.6.1. GCC Countries Market size and forecast, 2016-2026 (USD Million)
      7. 5.7.7. South Africa
        1. 5.7.7.1. South Africa Market size and forecast, 2016-2026 (USD Million)
      8. 5.7.8. Rest of Middle-East Africa
        1. 5.7.8.1. Rest of Middle-East Africa Market size and forecast, 2016-2026 (USD Million)
  6. CHAPTER 6. Oilfield Services market – Competitive Landscape
    1. 6.1. Competitor Market Share – Revenue
    2. 6.2. Market Concentration Rate Analysis, Top 3 and Top 5 Players
    3. 6.3. Strategic Development
      1. 6.3.1. Acquisitions and Mergers
      2. 6.3.2. New Products
      3. 6.3.3. Research & Development Activities
  7. CHAPTER 7. Company Profiles
    1. 7.1. Baker Hughes Incorporated
      1. 7.1.1. Company Overview
      2. 7.1.2. Baker Hughes Incorporated Revenue and Gross Margin
      3. 7.1.3. Product portfolio
      4. 7.1.4. Recent initiatives
    2. 7.2. Halliburton Company
      1. 7.2.1. Company Overview
      2. 7.2.2. Halliburton Company Revenue and Gross Margin
      3. 7.2.3. Product portfolio
      4. 7.2.4. Recent initiatives
    3. 7.3. Schlumberger Limited
      1. 7.3.1. Company Overview
      2. 7.3.2. Schlumberger Limited Revenue and Gross Margin
      3. 7.3.3. Product portfolio
      4. 7.3.4. Recent initiatives
    4. 7.4. Weatherford International PLC
      1. 7.4.1. Company Overview
      2. 7.4.2. Weatherford International PLC Revenue and Gross Margin
      3. 7.4.3. Product portfolio
      4. 7.4.4. Recent initiatives
    5. 7.5. National Oilwell Varco, Inc.
      1. 7.5.1. Company Overview
      2. 7.5.2. National Oilwell Varco, Inc. Revenue and Gross Margin
      3. 7.5.3. Product portfolio
      4. 7.5.4. Recent initiatives
    6. 7.6. China Oilfield Services Limited (COSL)
      1. 7.6.1. Company Overview
      2. 7.6.2. China Oilfield Services Limited (COSL) Revenue and Gross Margin
      3. 7.6.3. Product portfolio
      4. 7.6.4. Recent initiatives
    7. 7.7. Superior Energy Services, Inc.
      1. 7.7.1. Company Overview
      2. 7.7.2. Superior Energy Services, Inc. Revenue and Gross Margin
      3. 7.7.3. Product portfolio
      4. 7.7.4. Recent initiatives
    8. 7.8. Technipfmc.PLC
      1. 7.8.1. Company Overview
      2. 7.8.2. Technipfmc.PLC Revenue and Gross Margin
      3. 7.8.3. Product portfolio
      4. 7.8.4. Recent initiatives
    9. 7.9. Trican Well Service, Ltd.
      1. 7.9.1. Company Overview
      2. 7.9.2. Trican Well Service, Ltd. Revenue and Gross Margin
      3. 7.9.3. Product portfolio
      4. 7.9.4. Recent initiatives
    10. 7.10. Welltec International APS
      1. 7.10.1. Company Overview
      2. 7.10.2. Welltec International APS Revenue and Gross Margin
      3. 7.10.3. Product portfolio
      4. 7.10.4. Recent initiatives
    11. 7.11. Nabors Industries, Ltd.
      1. 7.11.1. Company Overview
      2. 7.11.2. Nabors Industries, Ltd. Revenue and Gross Margin
      3. 7.11.3. Product portfolio
      4. 7.11.4. Recent initiatives
    12. 7.12. Nordic Well Services, LLC
      1. 7.12.1. Company Overview
      2. 7.12.2. Nordic Well Services, LLC Revenue and Gross Margin
      3. 7.12.3. Product portfolio
      4. 7.12.4. Recent initiatives
  8. CHAPTER 8. Oilfield Services — Industry Analysis
    1. 8.1. Oilfield Services Market – Key Trends
      1. 8.1.1. Market Drivers
      2. 8.1.2. Market Restraints
      3. 8.1.3. Market Opportunities
    2. 8.2. Value Chain Analysis
    3. 8.3. Technology Roadmap and Timeline
    4. 8.4. Oilfield Services Market – Attractiveness Analysis
      1. 8.4.1. By Service
      2. 8.4.2. By Application
      3. 8.4.3. By Type
      4. 8.4.4. By Region
  9. CHAPTER 9. Marketing Strategy Analysis, Distributors
    1. 9.1. Marketing Channel
    2. 9.2. Direct Marketing
    3. 9.3. Indirect Marketing
    4. 9.4. Marketing Channel Development Trend
    5. 9.5. Economic/Political Environmental Change
  10. CHAPTER 10. Report Conclusion
  11. CHAPTER 11. Research Approach & Methodology
    1. 11.1. Report Description
    2. 11.2. Research Scope
    3. 11.3. Research Methodology
      1. 11.3.1. Secondary Research
      2. 11.3.2. Primary Research
      3. 11.3.3. Models
        1. 11.3.3.1. Company Share Analysis Model
        2. 11.3.3.2. Revenue Based Modeling
        3. 11.3.3.3. Research Limitations

        List of Figures

        FIG. 1 Global Oilfield Services Market, 2016-2026 (USD Million)
        FIG. 2 Global Oilfield Services Market Share, by Service, 2018 & 2025 (USD Million)
        FIG. 3 Global Pressure Pumping Services Oilfield Services Market, 2016-2026 (USD Million)
        FIG. 4 Global Oil Country Tubular Goods Oilfield Services Market, 2016-2026 (USD Million)
        FIG. 5 Global Wireline Services Oilfield Services Market, 2016-2026 (USD Million)
        FIG. 6 Global Well Completion Equipment & Services Oilfield Services Market, 2016-2026 (USD Million)
        FIG. 7 Global Well Intervention Services Oilfield Services Market, 2016-2026 (USD Million)
        FIG. 8 Global Drilling & Completion Fluid Services Oilfield Services Market, 2016-2026 (USD Million)
        FIG. 9 Global Drilling Waste Management Services Oilfield Services Market, 2016-2026 (USD Million)
        FIG. 10 Global Coiled Tubing Services Oilfield Services Market, 2016-2026 (USD Million)
        FIG. 11 Global Oilfield Services Market Share, by Application, 2018 & 2025 (USD Million)
        FIG. 12 Global Offshore Oilfield Services Market, 2016-2026 (USD Million)
        FIG. 13 Global Onshore Oilfield Services Market, 2016-2026 (USD Million)
        FIG. 14 Global Oilfield Services Market Share, by Type, 2018 & 2025 (USD Million)
        FIG. 15 Global Equipment Rental Oilfield Services Market, 2016-2026 (USD Million)
        FIG. 16 Global Field operation Oilfield Services Market, 2016-2026 (USD Million)
        FIG. 17 Global Analytical services Oilfield Services Market, 2016-2026 (USD Million)
        FIG. 18 Global Oilfield Services Market Share, by Region, 2018 & 2025
        FIG. 19 North America Oilfield Services Market, 2016-2026
        FIG. 20 U.S. Oilfield Services Market, 2016-2026
        FIG. 21 Canada Oilfield Services Market, 2016-2026
        FIG. 22 Europe Oilfield Services Market, 2016-2026
        FIG. 23 Germany Oilfield Services Market, 2016-2026
        FIG. 24 France Oilfield Services Market, 2016-2026
        FIG. 25 U.K. Oilfield Services Market, 2016-2026
        FIG. 26 Italy Oilfield Services Market, 2016-2026
        FIG. 27 Spain Oilfield Services Market, 2016-2026
        FIG. 28 Rest of Europe Oilfield Services Market, 2016-2026
        FIG. 29 Asia Pacific Oilfield Services Market, 2016-2026
        FIG. 30 China Oilfield Services Market, 2016-2026
        FIG. 31 Japan Oilfield Services Market, 2016-2026
        FIG. 32 India Oilfield Services Market, 2016-2026
        FIG. 33 South  Korea Oilfield Services Market, 2016-2026
        FIG. 34 South-East Asia Oilfield Services Market, 2016-2026
        FIG. 35 Rest of Asia Pacific Oilfield Services Market, 2016-2026
        FIG. 36 Latin America Oilfield Services Market, 2016-2026
        FIG. 37 Brazil Oilfield Services Market, 2016-2026
        FIG. 38 Mexico Oilfield Services Market, 2016-2026
        FIG. 39 Rest of Latin America Oilfield Services Market, 2016-2026
        FIG. 40 The Middle-East and Africa Oilfield Services Market, 2016-2026
        FIG. 41 GCC Countries Oilfield Services Market, 2016-2026
        FIG. 42 South Africa Oilfield Services Market, 2016-2026
        FIG. 43 Rest of Middle-East Africa Oilfield Services Market, 2016-2026
        FIG. 44 Competitor Market Share – Revenue
        FIG. 45 Baker Hughes Incorporated Revenue and Growth Rate
        FIG. 46 Baker Hughes Incorporated Market Share
        FIG. 47 Halliburton Company Revenue and Growth Rate
        FIG. 48 Halliburton Company Market Share
        FIG. 49 Schlumberger Limited Revenue and Growth Rate
        FIG. 50 Schlumberger Limited Market Share
        FIG. 51 Weatherford International PLC Revenue and Growth Rate
        FIG. 52 Weatherford International PLC Market Share
        FIG. 53 National Oilwell Varco, Inc. Revenue and Growth Rate
        FIG. 54 National Oilwell Varco, Inc. Market Share
        FIG. 55 China Oilfield Services Limited (COSL) Revenue and Growth Rate
        FIG. 56 China Oilfield Services Limited (COSL) Market Share
        FIG. 57 Superior Energy Services, Inc. Revenue and Growth Rate
        FIG. 58 Superior Energy Services, Inc. Market Share
        FIG. 59 Technipfmc.PLC Revenue and Growth Rate
        FIG. 60 Technipfmc.PLC Market Share
        FIG. 61 Trican Well Service, Ltd. Revenue and Growth Rate
        FIG. 62 Trican Well Service, Ltd. Market Share
        FIG. 63 Welltec International APS Revenue and Growth Rate
        FIG. 64 Welltec International APS Market Share
        FIG. 65 Nabors Industries, Ltd. Revenue and Growth Rate
        FIG. 66 Nabors Industries, Ltd. Market Share
        FIG. 67 Nordic Well Services, LLC Revenue and Growth Rate
        FIG. 68 Nordic Well Services, LLC Market Share
        FIG. 69 Market Dynamics
        FIG. 70 Global Oilfield Services – Value Chain Analysis
        FIG. 71 Technology Roadmap and Timeline
        FIG. 72 Market Attractiveness Analysis – By Service
        FIG. 73 Market Attractiveness Analysis – By Application
        FIG. 74 Market Attractiveness Analysis – By Type
        FIG. 75 Market Attractiveness Analysis – By Region
        FIG. 76 Market Channel
        FIG. 77 Marketing Channel Development Trend
        FIG. 78 Growth in World Gross Product, 2008-2018

        List of Tables

        TABLE 1 Global Oilfield Services Market, 2018 & 2025 (USD Million)
        TABLE 2 Global Oilfield Services market, by Service, 2016-2026 (USD Million)
        TABLE 3 Global Oilfield Services market, by Application, 2016-2026 (USD Million)
        TABLE 4 Global Oilfield Services market, by Type, 2016-2026 (USD Million)
        TABLE 5 Global Oilfield Services market, by Region, 2016-2026 (USD Million)
        TABLE 6 North America Oilfield Services Market, by Service, 2016-2026 (USD Million)
        TABLE 7 North America Oilfield Services Market, by Application, 2016-2026 (USD Million)
        TABLE 8 North America Oilfield Services Market, by Type, 2016-2026 (USD Million)
        TABLE 9 Europe Oilfield Services Market, by Service, 2016-2026 (USD Million)
        TABLE 10 Europe Oilfield Services Market, by Application, 2016-2026 (USD Million)
        TABLE 11 Europe Oilfield Services Market, by Type, 2016-2026 (USD Million)
        TABLE 12 Asia Pacific Oilfield Services Market, by Service, 2016-2026 (USD Million)
        TABLE 13 Asia Pacific Oilfield Services Market, by Application, 2016-2026 (USD Million)
        TABLE 14 Asia Pacific Oilfield Services Market, by Type, 2016-2026 (USD Million)
        TABLE 15 Latin America Oilfield Services Market, by Service, 2016-2026 (USD Million)
        TABLE 16 Latin America Oilfield Services Market, by Application, 2016-2026 (USD Million)
        TABLE 17 Latin America Oilfield Services Market, by Type, 2016-2026 (USD Million)
        TABLE 18 The Middle-East and Africa Oilfield Services Market, by Service, 2016-2026 (USD Million)
        TABLE 19 The Middle-East and Africa Oilfield Services Market, by Application, 2016-2026 (USD Million)
        TABLE 20 The Middle-East and Africa Oilfield Services Market, by Type, 2016-2026 (USD Million)
        TABLE 21 Global Oilfield Services Market - Company Revenue Analysis 2016-2019 (USD Million)
        TABLE 22 Global Oilfield Services Market - Company Revenue Share Analysis 2016-2019(%)
        TABLE 23 Acquisitions and Mergers
        TABLE 24 New Product/Service Launch
        TABLE 25 Research & Development Activities
        TABLE 26 Market Drivers
        TABLE 27 Market Restraints
        TABLE 28 Market Opportunities

Industry Major Market Players

  • Baker Hughes Incorporated
  • Halliburton Company
  • Schlumberger Limited
  • Weatherford International PLC
  • National Oilwell Varco Inc.
  • China Oilfield Services Limited (COSL)
  • Superior Energy Services Inc.
  • Technipfmc.PLC
  • Trican Well Service Ltd.
  • Welltec International APS
  • Nabors Industries Ltd.,
  • Nordic Well Services LLC