Search Market Research Report

Discover Our Latest Reports
Discover Our Featured Reports
Discover Top Selling Reports

Nutraceuticals Aluminum Bottle Market Size, Share Global Analysis Report, 2016–2026

report img

Nutraceuticals Aluminum Bottle Market By Application (Functional Beverages, Functional Food, and Dietary Supplements) and By Sales Channel (Indirect Channel and Direct Channel): Global Industry Perspective, Market Size, Statistical Research, Market Intelligence, Comprehensive Analysis, Historical Trends, and Forecast 2016–2026

Industry Insights

This professional and specialized report study examines the technical and business perspective of the Nutraceuticals Aluminum Bottle industry. The report provides a historical analysis of the industry as well as the projected trends expected to be witnessed in the Nutraceuticals Aluminum Bottle market. The report study analyzes the market statistics at the global as well as the regional levels to gain an in-depth perspective of the overall Nutraceuticals Aluminum Bottle market. The historical insights are provided from 2016 to 2019 as well as projected trends are provided from 2020 to 2026. The quantitative data is provided in terms of both volume (Units) and value (USD Million) for 2016 – 2026. The qualitative data is reinforced by analyzing and providing numerous market dynamics (directly or indirectly affecting the industry) such as growth drivers, restraints, challenges, and opportunities.

Nutraceuticals Aluminum Bottle Market Size

To know more about this report | Request Free Sample Copy

Various industry analysis models have been included in our report and extensively demonstrated the key business strategies and competitive landscape of the Nutraceuticals Aluminum Bottle market in our study.


logoKey Insights from Primary Research

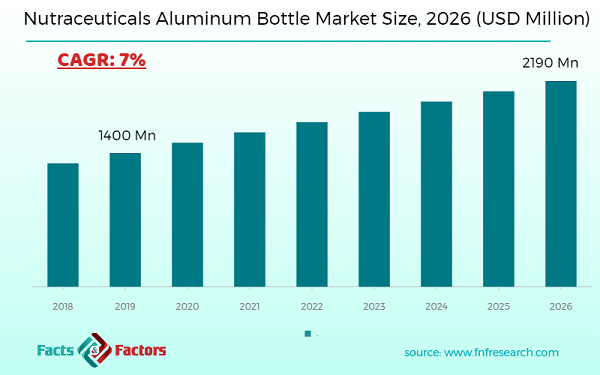
  • As per our primary respondents, the Nutraceutical Aluminium Bottle market is set to grow annually at rate of around 7%
  • It was established through primary research that the Nutraceutical Aluminium Bottle market was valued at around USD 1,300 Million in 2018
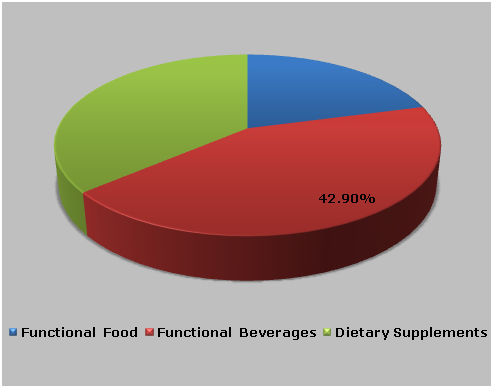
  • The “functional beverages” category, on the basis of application segmentation, was the leading category generating revenue around USD 560 Million revenue, in 2018
  • On the basis of sales channel segmentation, the “direct channel”category generating revenue about USD 760 Million, in 2018
  • Asia Pacific was the leading region associated with target market in terms of revenue generation in 2018.

logoKey Recommendations from Analysts

  • As per our analysts, inclination of individuals towards fitness and healthy lifestyle has compelled individuals in adopting the nutraceuticals which has augmented the global nutraceutical aluminium bottle market.
  • Growing at a CAGR around 7%, Nutraceutical Aluminium Bottle market provides numerous opportunities for all of the involved stakeholders across the entire value chain
  • Our analysts have identified “functional beverages” and “direct channel” categories as the leading investment pockets for Nutraceutical Aluminium Bottle market in terms of application and sales channel segmentations respectively
  • The global nutraceutical aluminium bottle market is expected to generate revenue around USD 2,190 Million in 2026
  • Asia Pacific is expected to continue its dominance in 2026 with revenue generation of around USD 1,037 Million.

logoMarket Value Share, By Application

Nutraceuticals Aluminum Bottle Market

To know more about this report | Request Free Sample Copy


Our study also includes an analysis of Porter’s Five Forces framework for understanding the competitive strategies of several stakeholders involved in the whole value chain of the Nutraceuticals Aluminum Bottle market. It also includes PESTLE analysis and SWOT analysis.

The report also offers an in-depth analysis of the market shares of each industry player and gives an outline of the market position of key players in the Nutraceuticals Aluminum Bottle market. Moreover, the study offers wide coverage of key strategic advances witnessed in the market such as new product launches, acquisitions & mergers, collaborations & joint ventures, funding & VC activities, agreements, partnerships, R&D activities, and regional expansion of key players of the Nutraceuticals Aluminum Bottle market.

The research study provides a critical assessment of the Nutraceuticals Aluminum Bottle industry by logically segmenting the market on the basis of Application, Application, and regions. Based on the past, present, and future trends, all the segments were analyzed from the bottom up, and the market sizes have been estimated from 2020 to 2026. The regional segmentation of the Nutraceuticals Aluminum Bottle industry includes the holistic bifurcation of all the five major continents including North America, Europe, Asia Pacific, Latin America, and Middle East & Africa.

Governments, as well as international food and beverage companies of developing economies, have been investing in the target market; this factor is anticipated to create lucrative opportunities for the global nutraceutical aluminum bottle market. Additionally, individuals, nowadays are more inclined towards a healthy lifestyle to show off, hence they are preferring nutraceutical products coupled with nutraceutical aluminum bottles.

The nutraceutical companies or target market key players are producing innovative nutraceutical aluminum bottles. These bottles are cheaper and lightweight. In addition, key players are using flexible packaging to attract target potential customers in the market. This could boost the target market growth.

The Nutraceuticals Aluminum Bottle market is segmented based on application and sales channels.  On the basis of application segmentation, the market is classified into functional beverages, functional food, and dietary supplements. In terms of sales channel segmentation, the market is bifurcated into indirect channels and direct channels.

logoReport Scope

Report Attribute

Details

Market Size in 2019

USD 1,400 Million

Projected Market Size in 2026

USD 2,190 Million

CAGR Growth Rate

7% CAGR

Base Year

2019

Forecast Years

2020-2026

Key Market Players

Nutraceuticals Aluminum Bottle market include CCL Container, MJS Packaging Inc., Shining Aluminum Packaging, Al-can Exports Pvt. Ltd., Exal Corporation, TecnocapS.p.A, and others.

Key Segment

By Application, By Sales Channel, By Region

Major Regions Covered

North America, Europe, Asia Pacific, Latin America, and the Middle East & Africa

Purchase Options

Request customized purchase options to meet your research needs. Explore purchase options

logoSome of the essential players operating in the Nutraceuticals Aluminum Bottle market include

  • CCL Container
  • MJS Packaging Inc.
  • Shining Aluminum Packaging
  • Al-can Exports Pvt. Ltd.
  • Exal Corporation
  • Tecnocap S.p.A

The taxonomy of the Nutraceuticals Aluminum Bottle Market by its scope and segmentation is as follows:

logo By ApplicationSegmentation Analysis

  • Functional Beverages
  • Functional Food
  • Dietary Supplements

logo By Sales Channel Segmentation Analysis

  • Indirect Channel
  • Direct Channel

logo Regional Segmentation Analysis

  • North America
    • The U.S.
    • Canada
  • Europe
    • France
    • The UK
    • Spain
    • Germany
    • Italy
    • Rest of Europe
  • Asia Pacific
    • China
    • Japan
    • India
    • South Korea
    • Southeast Asia
    • Rest of Asia Pacific
  • Latin America
    • Brazil
    • Mexico
    • Rest of Latin America
  • Middle East & Africa
    • GCC
    • South Africa
    • Rest of Middle East & Africa

logoKEY BUSINESS POINTERS ADDRESSED & FOREMOST REASONS TO PROCURE THE REPORT:

  • Statistical Analysis of the Past, Current, and Future Trends of the Industry with Validated Market Sizes Data
  • Direct and Indirect Rationales Impacting the Industry
  • In-depth and Micro Analysis of Viable Segments and Sub-segments
  • Companies and Vendors Market Share, Competitive Landscape, and Player Positioning Analysis
  • Demand Side (Consumption) and Supply Side (Production) Perspective and Analysis wherever applicable
  • Key Buyers and End-Users Analysis
  • Value Chain and Manufacturing Cost Structure Analysis wherever relevant
  • Key Marketing Strategies as well as Key Sales Channels adopted in the market
  • Investment Opportunity Analysis & Patents Analysis wherever feasible
  • Technological Road Map & Technical Analysis
  • Robust Research Methodology comprising dynamic mix (65%~35%) of Extensive Primary Research (primary interviews, ad-hoc surveys, questionnaires) and Protracted Secondary Research (proprietary in-house database, paid external databases, publically available validated sources)

Table of Content

  1. CHAPTER 1. Executive Summary
  2. CHAPTER 2. Nutraceuticals Aluminum Bottle market – Application Analysis
    1. 2.1. Global Nutraceuticals Aluminum Bottle Market – Application Overview
    2. 2.2. Global Nutraceuticals Aluminum Bottle Market Share, by Application, 2018 & 2025 (USD Million)
    3. 2.3. Global Nutraceuticals Aluminum Bottle Market share, by Application, 2018 & 2025 (Million Units)
    4. 2.4. Functional Beverages
      1. 2.4.1. Global Functional Beverages Nutraceuticals Aluminum Bottle Market, 2016-2026 (USD Million)
      2. 2.4.2. Global Functional Beverages Nutraceuticals Aluminum Bottle Market, 2016-2026 (Million Units)
    5. 2.5. Functional Food
      1. 2.5.1. Global Functional Food Nutraceuticals Aluminum Bottle Market, 2016-2026 (USD Million)
      2. 2.5.2. Global Functional Food Nutraceuticals Aluminum Bottle Market, 2016-2026 (Million Units)
    6. 2.6. Dietary Supplements
      1. 2.6.1. Global Dietary Supplements Nutraceuticals Aluminum Bottle Market, 2016-2026 (USD Million)
      2. 2.6.2. Global Dietary Supplements Nutraceuticals Aluminum Bottle Market, 2016-2026 (Million Units)
  3. CHAPTER 3. Nutraceuticals Aluminum Bottle market – Sales Channel Analysis
    1. 3.1. Global Nutraceuticals Aluminum Bottle Market – Sales Channel Overview
    2. 3.2. Global Nutraceuticals Aluminum Bottle Market Share, by Sales Channel, 2018 & 2025 (USD Million)
    3. 3.3. Global Nutraceuticals Aluminum Bottle Market share, by Sales Channel, 2018 & 2025 (Million Units)
    4. 3.4. Indirect Channel
      1. 3.4.1. Global Indirect Channel Nutraceuticals Aluminum Bottle Market, 2016-2026 (USD Million)
      2. 3.4.2. Global Indirect Channel Nutraceuticals Aluminum Bottle Market, 2016-2026 (Million Units)
    5. 3.5. Direct Channel
      1. 3.5.1. Global Direct Channel Nutraceuticals Aluminum Bottle Market, 2016-2026 (USD Million)
      2. 3.5.2. Global Direct Channel Nutraceuticals Aluminum Bottle Market, 2016-2026 (Million Units)
  4. CHAPTER 4. Nutraceuticals Aluminum Bottle market – Regional Analysis
    1. 4.1. Global Nutraceuticals Aluminum Bottle Market Regional Overview
    2. 4.2. Global Nutraceuticals Aluminum Bottle Market Share, by Region, 2018 & 2025 (Value)
    3. 4.3. Global Nutraceuticals Aluminum Bottle Market Share, by Region, 2018 & 2025 (Volume)
    4. 4.4. North America
      1. 4.4.1. North America Nutraceuticals Aluminum Bottle Market size and forecast, 2016-2026
      2. 4.4.2. North America Nutraceuticals Aluminum Bottle Market, by Country, 2018 - 2025 (USD Million)
      3. 4.4.3. North America Market size and forecast, 2016-2026 (Million Units)
      4. 4.4.4. North America Nutraceuticals Aluminum Bottle Market, by Country, 2018 - 2025 (Million Units)
      5. 4.4.5. North America Nutraceuticals Aluminum Bottle Market, by Application, 2016-2026
        1. 4.4.5.1. North America Nutraceuticals Aluminum Bottle Market, by Application, 2016-2026 (USD Million)
        2. 4.4.5.2. North America Nutraceuticals Aluminum Bottle Market, by Application, 2016-2026 (Million Units)
      6. 4.4.6. North America Nutraceuticals Aluminum Bottle Market, by Sales Channel, 2016-2026
        1. 4.4.6.1. North America Nutraceuticals Aluminum Bottle Market, by Sales Channel, 2016-2026 (USD Million)
        2. 4.4.6.2. North America Nutraceuticals Aluminum Bottle Market, by Sales Channel, 2016-2026 (Million Units)
      7. 4.4.7. U.S.
        1. 4.4.7.1. U.S. Market size and forecast, 2016-2026 (USD Million)
        2. 4.4.7.2. U.S. Market size and forecast, 2016-2026 (Million Units)
      8. 4.4.8. Canada
        1. 4.4.8.1. Canada Market size and forecast, 2016-2026 (USD Million)
        2. 4.4.8.2. Canada Market size and forecast, 2016-2026 (Million Units)
    5. 4.5. Europe
      1. 4.5.1. Europe Nutraceuticals Aluminum Bottle Market size and forecast, 2016-2026
      2. 4.5.2. Europe Nutraceuticals Aluminum Bottle Market, by Country, 2018 - 2025 (USD Million)
      3. 4.5.3. Europe Market size and forecast, 2016-2026 (Million Units)
      4. 4.5.4. Europe Nutraceuticals Aluminum Bottle Market, by Country, 2018 - 2025 (Million Units)
      5. 4.5.5. Europe Nutraceuticals Aluminum Bottle Market, by Application, 2016-2026
        1. 4.5.5.1. Europe Nutraceuticals Aluminum Bottle Market, by Application, 2016-2026 (USD Million)
        2. 4.5.5.2. Europe Nutraceuticals Aluminum Bottle Market, by Application, 2016-2026 (Million Units)
      6. 4.5.6. Europe Nutraceuticals Aluminum Bottle Market, by Sales Channel, 2016-2026
        1. 4.5.6.1. Europe Nutraceuticals Aluminum Bottle Market, by Sales Channel, 2016-2026 (USD Million)
        2. 4.5.6.2. Europe Nutraceuticals Aluminum Bottle Market, by Sales Channel, 2016-2026 (Million Units)
      7. 4.5.7. Germany
        1. 4.5.7.1. Germany Market size and forecast, 2016-2026 (USD Million)
        2. 4.5.7.2. Germany Market size and forecast, 2016-2026 (Million Units)
      8. 4.5.8. France
        1. 4.5.8.1. France Market size and forecast, 2016-2026 (USD Million)
        2. 4.5.8.2. France Market size and forecast, 2016-2026 (Million Units)
      9. 4.5.9. U.K.
        1. 4.5.9.1. U.K. Market size and forecast, 2016-2026 (USD Million)
        2. 4.5.9.2. U.K. Market size and forecast, 2016-2026 (Million Units)
      10. 4.5.10. Italy
        1. 4.5.10.1. Italy Market size and forecast, 2016-2026 (USD Million)
        2. 4.5.10.2. Italy Market size and forecast, 2016-2026 (Million Units)
      11. 4.5.11. Spain
        1. 4.5.11.1. Spain Market size and forecast, 2016-2026 (USD Million)
        2. 4.5.11.2. Spain Market size and forecast, 2016-2026 (Million Units)
      12. 4.5.12. Rest of Europe
        1. 4.5.12.1. Rest of Europe Market size and forecast, 2016-2026 (USD Million)
        2. 4.5.12.2. Rest of Europe Market size and forecast, 2016-2026 (Million Units)
    6. 4.6. Asia Pacific
      1. 4.6.1. Asia Pacific Nutraceuticals Aluminum Bottle Market size and forecast, 2016-2026
      2. 4.6.2. Asia Pacific Nutraceuticals Aluminum Bottle Market, by Country, 2018 - 2025 (USD Million)
      3. 4.6.3. Asia Pacific Market size and forecast, 2016-2026 (Million Units)
      4. 4.6.4. Asia Pacific Nutraceuticals Aluminum Bottle Market, by Country, 2018 - 2025 (Million Units)
      5. 4.6.5. Asia Pacific Nutraceuticals Aluminum Bottle Market, by Application, 2016-2026
        1. 4.6.5.1. Asia Pacific Nutraceuticals Aluminum Bottle Market, by Application, 2016-2026 (USD Million)
        2. 4.6.5.2. Asia Pacific Nutraceuticals Aluminum Bottle Market, by Application, 2016-2026 (Million Units)
      6. 4.6.6. Asia Pacific Nutraceuticals Aluminum Bottle Market, by Sales Channel, 2016-2026
        1. 4.6.6.1. Asia Pacific Nutraceuticals Aluminum Bottle Market, by Sales Channel, 2016-2026 (USD Million)
        2. 4.6.6.2. Asia Pacific Nutraceuticals Aluminum Bottle Market, by Sales Channel, 2016-2026 (Million Units)
      7. 4.6.7. China
        1. 4.6.7.1. China Market size and forecast, 2016-2026 (USD Million)
        2. 4.6.7.2. China Market size and forecast, 2016-2026 (Million Units)
      8. 4.6.8. Japan
        1. 4.6.8.1. Japan Market size and forecast, 2016-2026 (USD Million)
        2. 4.6.8.2. Japan Market size and forecast, 2016-2026 (Million Units)
      9. 4.6.9. India
        1. 4.6.9.1. India Market size and forecast, 2016-2026 (USD Million)
        2. 4.6.9.2. India Market size and forecast, 2016-2026 (Million Units)
      10. 4.6.10. South Korea
        1. 4.6.10.1. South Korea Market size and forecast, 2016-2026 (USD Million)
        2. 4.6.10.2. South Korea Market size and forecast, 2016-2026 (Million Units)
      11. 4.6.11. South-East Asia
        1. 4.6.11.1. South-East Asia Market size and forecast, 2016-2026 (USD Million)
        2. 4.6.11.2. South-East Asia Market size and forecast, 2016-2026 (Million Units)
      12. 4.6.12. Rest of Asia Pacific
        1. 4.6.12.1. Rest of Asia Pacific Market size and forecast, 2016-2026 (USD Million)
        2. 4.6.12.2. Rest of Asia Pacific Market size and forecast, 2016-2026 (Million Units)
    7. 4.7. Latin America
      1. 4.7.1. Latin America Nutraceuticals Aluminum Bottle Market size and forecast, 2016-2026
      2. 4.7.2. Latin America Nutraceuticals Aluminum Bottle Market, by Country, 2018 - 2025 (USD Million)
      3. 4.7.3. Latin America Market size and forecast, 2016-2026 (Million Units)
      4. 4.7.4. Latin America Nutraceuticals Aluminum Bottle Market, by Country, 2018 - 2025 (Million Units)
      5. 4.7.5. Latin America Nutraceuticals Aluminum Bottle Market, by Application, 2016-2026
        1. 4.7.5.1. Latin America Nutraceuticals Aluminum Bottle Market, by Application, 2016-2026 (USD Million)
        2. 4.7.5.2. Latin America Nutraceuticals Aluminum Bottle Market, by Application, 2016-2026 (Million Units)
      6. 4.7.6. Latin America Nutraceuticals Aluminum Bottle Market, by Sales Channel, 2016-2026
        1. 4.7.6.1. Latin America Nutraceuticals Aluminum Bottle Market, by Sales Channel, 2016-2026 (USD Million)
        2. 4.7.6.2. Latin America Nutraceuticals Aluminum Bottle Market, by Sales Channel, 2016-2026 (Million Units)
      7. 4.7.7. Brazil
        1. 4.7.7.1. Brazil Market size and forecast, 2016-2026 (USD Million)
        2. 4.7.7.2. Brazil Market size and forecast, 2016-2026 (Million Units)
      8. 4.7.8. Mexico
        1. 4.7.8.1. Mexico Market size and forecast, 2016-2026 (USD Million)
        2. 4.7.8.2. Mexico Market size and forecast, 2016-2026 (Million Units)
      9. 4.7.9. Rest of Latin America
        1. 4.7.9.1. Rest of Latin America Market size and forecast, 2016-2026 (USD Million)
        2. 4.7.9.2. Rest of Latin America Market size and forecast, 2016-2026 (Million Units)
    8. 4.8. The Middle-East and Africa
      1. 4.8.1. The Middle-East and Africa Nutraceuticals Aluminum Bottle Market size and forecast, 2016-2026
      2. 4.8.2. The Middle-East and Africa Nutraceuticals Aluminum Bottle Market, by Country, 2018 - 2025 (USD Million)
      3. 4.8.3. The Middle-East and Africa Market size and forecast, 2016-2026 (Million Units)
      4. 4.8.4. The Middle-East and Africa Nutraceuticals Aluminum Bottle Market, by Country, 2018 - 2025 (Million Units)
      5. 4.8.5. The Middle-East and Africa Nutraceuticals Aluminum Bottle Market, by Application, 2016-2026
        1. 4.8.5.1. The Middle-East and Africa Nutraceuticals Aluminum Bottle Market, by Application, 2016-2026 (USD Million)
        2. 4.8.5.2. The Middle-East and Africa Nutraceuticals Aluminum Bottle Market, by Application, 2016-2026 (Million Units)
      6. 4.8.6. The Middle-East and Africa Nutraceuticals Aluminum Bottle Market, by Sales Channel, 2016-2026
        1. 4.8.6.1. The Middle-East and Africa Nutraceuticals Aluminum Bottle Market, by Sales Channel, 2016-2026 (USD Million)
        2. 4.8.6.2. The Middle-East and Africa Nutraceuticals Aluminum Bottle Market, by Sales Channel, 2016-2026 (Million Units)
      7. 4.8.7. GCC Countries
        1. 4.8.7.1. GCC Countries Market size and forecast, 2016-2026 (USD Million)
        2. 4.8.7.2. GCC Countries Market size and forecast, 2016-2026 (Million Units)
      8. 4.8.8. South Africa
        1. 4.8.8.1. South Africa Market size and forecast, 2016-2026 (USD Million)
        2. 4.8.8.2. South Africa Market size and forecast, 2016-2026 (Million Units)
      9. 4.8.9. Rest of Middle-East Africa
        1. 4.8.9.1. Rest of Middle-East Africa Market size and forecast, 2016-2026 (USD Million)
        2. 4.8.9.2. Rest of Middle-East Africa Market size and forecast, 2016-2026 (Million Units)
  5. CHAPTER 5. Nutraceuticals Aluminum Bottle Production, Consumption, Export, Import by Regions
    1. 5.1. Global Nutraceuticals Aluminum Bottle production and revenue, 2015-2025 (USD Million) (Million Units)
    2. 5.2. Global Import and Export Analysis, by Region
  6. CHAPTER 6. Nutraceuticals Aluminum Bottle market – Competitive Landscape
    1. 6.1. Competitor Market Share – Revenue
    2. 6.2. Market Concentration Rate Analysis, Top 3 and Top 5 Players
    3. 6.3. Competitor Market Share – Volume
    4. 6.4. Strategic Development
      1. 6.4.1. Acquisitions and Mergers
      2. 6.4.2. New Products
      3. 6.4.3. Research & Development Activities
  7. CHAPTER 7. Company Profiles
    1. 7.1. CCL Container
      1. 7.1.1. Company Overview
      2. 7.1.2. CCL Container Sales, Revenue, Price, and Gross Margin
      3. 7.1.3. Product portfolio
      4. 7.1.4. Recent initiatives
    2. 7.2. MJS Packaging Inc.
      1. 7.2.1. Company Overview
      2. 7.2.2. MJS Packaging Inc. Sales, Revenue, Price, and Gross Margin
      3. 7.2.3. Product portfolio
      4. 7.2.4. Recent initiatives
    3. 7.3. Shining Aluminum Packaging
      1. 7.3.1. Company Overview
      2. 7.3.2. Shining Aluminum Packaging Sales, Revenue, Price, and Gross Margin
      3. 7.3.3. Product portfolio
      4. 7.3.4. Recent initiatives
    4. 7.4. Al-can Exports Pvt. Ltd.
      1. 7.4.1. Company Overview
      2. 7.4.2. Al-can Exports Pvt. Ltd. Sales, Revenue, Price, and Gross Margin
      3. 7.4.3. Product portfolio
      4. 7.4.4. Recent initiatives
    5. 7.5. Exal Corporation
      1. 7.5.1. Company Overview
      2. 7.5.2. Exal Corporation Sales, Revenue, Price, and Gross Margin
      3. 7.5.3. Product portfolio
      4. 7.5.4. Recent initiatives
    6. 7.6. Tecnocap S.p.A
      1. 7.6.1. Company Overview
      2. 7.6.2. Tecnocap S.p.A Sales, Revenue, Price, and Gross Margin
      3. 7.6.3. Product portfolio
      4. 7.6.4. Recent initiatives
    7. 7.7. Others
      1. 7.7.1. Company Overview
      2. 7.7.2. Others Sales, Revenue, Price, and Gross Margin
      3. 7.7.3. Product portfolio
      4. 7.7.4. Recent initiatives
  8. CHAPTER 8. Nutraceuticals Aluminum Bottle — Industry Analysis
    1. 8.1. Introduction and Taxonomy
    2. 8.2. Nutraceuticals Aluminum Bottle Market – Key Trends
      1. 8.2.1. Market Drivers
      2. 8.2.2. Market Restraints
      3. 8.2.3. Market Opportunities
    3. 8.3. Value Chain Analysis
    4. 8.4. Key Mandates and Regulations
    5. 8.5. Technology Roadmap and Timeline
    6. 8.6. Nutraceuticals Aluminum Bottle market – Attractiveness Analysis
      1. 8.6.1. By Application
      2. 8.6.2. By Sales Channel
      3. 8.6.3. By Region
  9. CHAPTER 9. Raw Material analysis
    1. 9.1. Nutraceuticals Aluminum Bottle Key Raw Material Analysis
      1. 9.1.1. Key Raw Materials
      2. 9.1.2. Price Trend of Key Raw Materials
    2. 9.2. Key Suppliers of Raw Materials
    3. 9.3. Proportion of Manufacturing Cost Structure
      1. 9.3.1. Raw Materials
      2. 9.3.2. Labor Cost
    4. 9.4. Manufacturing Expenses Analysis of Nutraceuticals Aluminum Bottle
  10. CHAPTER 10. Industrial Chain, Sourcing Strategy and Downstream Buyers
    1. 10.1. Nutraceuticals Aluminum Bottle Industrial Chain Analysis
    2. 10.2. Upstream Raw Materials Sourcing
      1. 10.2.1. Risk Mitigation:
      2. 10.2.2. Supplier Relationships:
      3. 10.2.3. Business Processes:
      4. 10.2.4. Securing the Product:
    3. 10.3. Raw Materials Sources of Nutraceuticals Aluminum Bottle Major Manufacturers in 2016
    4. 10.4. Downstream Buyers
    5. 10.5. Distributors/Traders List
  11. CHAPTER 11. Marketing Strategy Analysis, Distributors
    1. 11.1. Marketing Channel
    2. 11.2. Direct Marketing
    3. 11.3. Indirect Marketing
    4. 11.4. Marketing Channel Development Trend
    5. 11.5. Economic/Political Environmental Change
  12. CHAPTER 12. Report Conclusion
  13. CHAPTER 13. Research Approach & Methodology
    1. 13.1. Report Description
    2. 13.2. Research Scope
    3. 13.3. Research Methodology
      1. 13.3.1. Secondary Research
      2. 13.3.2. Primary Research
      3. 13.3.3. Models
        1. 13.3.3.1. Company Share Analysis Model
        2. 13.3.3.2. Revenue Based Modeling
        3. 13.3.3.3. Research Limitations

        List of Figures

        FIG. 1    Global Nutraceuticals Aluminum Bottle Market, 2016-2026 (USD Million)
        FIG. 2    Global Nutraceuticals Aluminum Bottle Market Share, by Application, 2018 & 2025 (USD Million)
        FIG. 3    Global Nutraceuticals Aluminum Bottle Market share, by Application, 2018 & 2025 (Million Units)
        FIG. 4    Global Functional Beverages Nutraceuticals Aluminum Bottle Market, 2016-2026 (USD Million)
        FIG. 5    Global Functional Beverages Nutraceuticals Aluminum Bottle  Market, 2016-2026 (Million Units)
        FIG. 6    Global Functional Food Nutraceuticals Aluminum Bottle Market, 2016-2026 (USD Million)
        FIG. 7    Global Functional Food Nutraceuticals Aluminum Bottle  Market, 2016-2026 (Million Units)
        FIG. 8    Global Dietary Supplements Nutraceuticals Aluminum Bottle Market, 2016-2026 (USD Million)
        FIG. 9    Global Dietary Supplements Nutraceuticals Aluminum Bottle  Market, 2016-2026 (Million Units)
        FIG. 10    Global Nutraceuticals Aluminum Bottle Market Share, by Sales Channel, 2018 & 2025 (USD Million)
        FIG. 11    Global Nutraceuticals Aluminum Bottle Market share, by Sales Channel, 2018 & 2025 (Million Units)
        FIG. 12    Global Indirect Channel Nutraceuticals Aluminum Bottle Market, 2016-2026 (USD Million)
        FIG. 13    Global Indirect Channel Nutraceuticals Aluminum Bottle  Market, 2016-2026 (Million Units)
        FIG. 14    Global Direct Channel Nutraceuticals Aluminum Bottle Market, 2016-2026 (USD Million)
        FIG. 15    Global Direct Channel Nutraceuticals Aluminum Bottle  Market, 2016-2026 (Million Units)
        FIG. 16    Global Nutraceuticals Aluminum Bottle Market Share, by Region, 2018 & 2025
        FIG. 17    Global Nutraceuticals Aluminum Bottle Market Share, by Region, 2018 & 2025
        FIG. 18    North America Nutraceuticals Aluminum Bottle Market, 2016-2026
        FIG. 19    North America Nutraceuticals Aluminum Bottle  Market, 2016-2026 (Million Units)
        FIG. 20    U.S. Nutraceuticals Aluminum Bottle Market, 2016-2026
        FIG. 21    U.S. Nutraceuticals Aluminum Bottle  Market, 2016-2026 (Million Units)
        FIG. 22    Canada Nutraceuticals Aluminum Bottle Market, 2016-2026
        FIG. 23    Canada Nutraceuticals Aluminum Bottle  Market, 2016-2026 (Million Units)
        FIG. 24    Europe Nutraceuticals Aluminum Bottle Market, 2016-2026
        FIG. 25    Europe Nutraceuticals Aluminum Bottle  Market, 2016-2026 (Million Units)
        FIG. 26    Germany Nutraceuticals Aluminum Bottle Market, 2016-2026
        FIG. 27    Germany Nutraceuticals Aluminum Bottle  Market, 2016-2026 (Million Units)
        FIG. 28    France Nutraceuticals Aluminum Bottle Market, 2016-2026
        FIG. 29    France Nutraceuticals Aluminum Bottle  Market, 2016-2026 (Million Units)
        FIG. 30    U.K. Nutraceuticals Aluminum Bottle Market, 2016-2026
        FIG. 31    U.K. Nutraceuticals Aluminum Bottle  Market, 2016-2026 (Million Units)
        FIG. 32    Italy Nutraceuticals Aluminum Bottle Market, 2016-2026
        FIG. 33    Italy Nutraceuticals Aluminum Bottle  Market, 2016-2026 (Million Units)
        FIG. 34    Spain Nutraceuticals Aluminum Bottle Market, 2016-2026
        FIG. 35    Spain Nutraceuticals Aluminum Bottle  Market, 2016-2026 (Million Units)
        FIG. 36    Rest of Europe Nutraceuticals Aluminum Bottle Market, 2016-2026
        FIG. 37    Rest of Europe Nutraceuticals Aluminum Bottle  Market, 2016-2026 (Million Units)
        FIG. 38    Asia Pacific Nutraceuticals Aluminum Bottle Market, 2016-2026
        FIG. 39    Asia Pacific Nutraceuticals Aluminum Bottle  Market, 2016-2026 (Million Units)
        FIG. 40    China Nutraceuticals Aluminum Bottle Market, 2016-2026
        FIG. 41    China Nutraceuticals Aluminum Bottle  Market, 2016-2026 (Million Units)
        FIG. 42    Japan Nutraceuticals Aluminum Bottle Market, 2016-2026
        FIG. 43    Japan Nutraceuticals Aluminum Bottle  Market, 2016-2026 (Million Units)
        FIG. 44    India Nutraceuticals Aluminum Bottle Market, 2016-2026
        FIG. 45    India Nutraceuticals Aluminum Bottle  Market, 2016-2026 (Million Units)
        FIG. 46    South  Korea Nutraceuticals Aluminum Bottle Market, 2016-2026
        FIG. 47    South  Korea Nutraceuticals Aluminum Bottle  Market, 2016-2026 (Million Units)
        FIG. 48    South-East Asia Nutraceuticals Aluminum Bottle Market, 2016-2026
        FIG. 49    South-East Asia Nutraceuticals Aluminum Bottle  Market, 2016-2026 (Million Units)
        FIG. 50    Rest of Asia Pacific Nutraceuticals Aluminum Bottle Market, 2016-2026
        FIG. 51    Rest of Asia Pacific Nutraceuticals Aluminum Bottle  Market, 2016-2026 (Million Units)
        FIG. 52    Latin America Nutraceuticals Aluminum Bottle Market, 2016-2026
        FIG. 53    Latin America Nutraceuticals Aluminum Bottle  Market, 2016-2026 (Million Units)
        FIG. 54    Brazil Nutraceuticals Aluminum Bottle Market, 2016-2026
        FIG. 55    Brazil Nutraceuticals Aluminum Bottle  Market, 2016-2026 (Million Units)
        FIG. 56    Mexico Nutraceuticals Aluminum Bottle Market, 2016-2026
        FIG. 57    Mexico Nutraceuticals Aluminum Bottle  Market, 2016-2026 (Million Units)
        FIG. 58    Rest of Latin America Nutraceuticals Aluminum Bottle Market, 2016-2026
        FIG. 59    Rest of Latin America Nutraceuticals Aluminum Bottle  Market, 2016-2026 (Million Units)
        FIG. 60    The Middle-East and Africa Nutraceuticals Aluminum Bottle Market, 2016-2026
        FIG. 61    The Middle-East and Africa Nutraceuticals Aluminum Bottle  Market, 2016-2026 (Million Units)
        FIG. 62    GCC Countries Nutraceuticals Aluminum Bottle Market, 2016-2026
        FIG. 63    GCC Countries Nutraceuticals Aluminum Bottle  Market, 2016-2026 (Million Units)
        FIG. 64    South Africa Nutraceuticals Aluminum Bottle Market, 2016-2026
        FIG. 65    South Africa Nutraceuticals Aluminum Bottle  Market, 2016-2026 (Million Units)
        FIG. 66    Rest of Middle-East Africa Nutraceuticals Aluminum Bottle Market, 2016-2026
        FIG. 67    Rest of Middle-East Africa Nutraceuticals Aluminum Bottle  Market, 2016-2026 (Million Units)
        FIG. 68    Global Nutraceuticals Aluminum Bottle production and revenue, 2015-2025 (USD Million) (Million Units)
        FIG. 69    North America Nutraceuticals Aluminum Bottle production and revenue, 2015-2025 (USD Million) (Million Units)
        FIG. 70    Europe Nutraceuticals Aluminum Bottle production and revenue, 2015-2025 (USD Million) (Million Units)
        FIG. 71    Asia Pacific Nutraceuticals Aluminum Bottle production and revenue, 2015-2025 (USD Million) (Million Units)
        FIG. 72    Latin America Nutraceuticals Aluminum Bottle production and revenue, 2015-2025 (USD Million) (Million Units)
        FIG. 73    Middle East and Africa Nutraceuticals Aluminum Bottle production and revenue, 2015-2025 (USD Million) (Million Units)
        FIG. 74    Competitor Market Share – Revenue
        FIG. 75    Competitor Market Share – Volume
        FIG. 76    CCL Container Revenue and Growth Rate
        FIG. 77    CCL Container Market Share
        FIG. 78    MJS Packaging Inc. Revenue and Growth Rate
        FIG. 79    MJS Packaging Inc. Market Share
        FIG. 80    Shining Aluminum Packaging Revenue and Growth Rate
        FIG. 81    Shining Aluminum Packaging Market Share
        FIG. 82    Al-can Exports Pvt. Ltd. Revenue and Growth Rate
        FIG. 83    Al-can Exports Pvt. Ltd. Market Share
        FIG. 84    Exal Corporation Revenue and Growth Rate
        FIG. 85    Exal Corporation Market Share
        FIG. 86    Tecnocap S.p.A Revenue and Growth Rate
        FIG. 87    Tecnocap S.p.A Market Share
        FIG. 88    Others Revenue and Growth Rate
        FIG. 89    Others Market Share
        FIG. 90    Market Dynamics
        FIG. 91    Global Nutraceuticals Aluminum Bottle – Value Chain Analysis
        FIG. 92    Key Mandates and Regulations
        FIG. 93    Technology Roadmap and Timeline
        FIG. 94    Market Attractiveness Analysis – By Application
        FIG. 95    Market Attractiveness Analysis – By Sales Channel
        FIG. 96    Market Attractiveness Analysis – By Region
        FIG. 97    Manufacturing Cost Structure of Nutraceuticals Aluminum Bottle
        FIG. 98    Nutraceuticals Aluminum Bottle Industrial Chain Analysis
        FIG. 99    Market Channel
        FIG. 100 Marketing Channel Development Trend
        FIG. 101 Growth in World Gross Product, 2008-2018


        List of Tables

        TABLE 1 Global Nutraceuticals Aluminum Bottle market, 2018 & 2025 (USD Million)
        TABLE 2 Global Nutraceuticals Aluminum Bottle market, by Application, 2016-2026 (USD Million)
        TABLE 3 Global Nutraceuticals Aluminum Bottle market, by Application, 2016-2026 (Million Units)
        TABLE 4 Global Nutraceuticals Aluminum Bottle market, by Sales Channel, 2016-2026 (USD Million)
        TABLE 5 Global Nutraceuticals Aluminum Bottle market, by Sales Channel, 2016-2026 (Million Units)
        TABLE 6 Global Nutraceuticals Aluminum Bottle market, by region, 2016-2026 (USD Million)
        TABLE 7 Global Nutraceuticals Aluminum Bottle market, by region, 2016-2026 (Million Units)
        TABLE 8 North America Nutraceuticals Aluminum Bottle Market, by Application, 2016-2026 (USD Million)
        TABLE 9 North America Nutraceuticals Aluminum Bottle Market, by Application, 2016-2026 (Million Units)
        TABLE 10 North America Nutraceuticals Aluminum Bottle Market, by Sales Channel, 2016-2026 (USD Million)
        TABLE 11 North America Nutraceuticals Aluminum Bottle Market, by Sales Channel, 2016-2026 (Million Units)
        TABLE 12 Europe Nutraceuticals Aluminum Bottle Market, by Application, 2016-2026 (USD Million)
        TABLE 13 Europe Nutraceuticals Aluminum Bottle Market, by Application, 2016-2026 (Million Units)
        TABLE 14 Europe Nutraceuticals Aluminum Bottle Market, by Sales Channel, 2016-2026 (USD Million)
        TABLE 15 Europe Nutraceuticals Aluminum Bottle Market, by Sales Channel, 2016-2026 (Million Units)
        TABLE 16 Asia Pacific Nutraceuticals Aluminum Bottle Market, by Application, 2016-2026 (USD Million)
        TABLE 17 Asia Pacific Nutraceuticals Aluminum Bottle Market, by Application, 2016-2026 (Million Units)
        TABLE 18 Asia Pacific Nutraceuticals Aluminum Bottle Market, by Sales Channel, 2016-2026 (USD Million)
        TABLE 19 Asia Pacific Nutraceuticals Aluminum Bottle Market, by Sales Channel, 2016-2026 (Million Units)
        TABLE 20 Latin America Nutraceuticals Aluminum Bottle Market, by Application, 2016-2026 (USD Million)
        TABLE 21 Latin America Nutraceuticals Aluminum Bottle Market, by Application, 2016-2026 (Million Units)
        TABLE 22 Latin America Nutraceuticals Aluminum Bottle Market, by Sales Channel, 2016-2026 (USD Million)
        TABLE 23 Latin America Nutraceuticals Aluminum Bottle Market, by Sales Channel, 2016-2026 (Million Units)
        TABLE 24 The Middle-East and Africa Nutraceuticals Aluminum Bottle Market, by Application, 2016-2026 (USD Million)
        TABLE 25 The Middle-East and Africa Nutraceuticals Aluminum Bottle Market, by Application, 2016-2026 (Million Units)
        TABLE 26 The Middle-East and Africa Nutraceuticals Aluminum Bottle Market, by Sales Channel, 2016-2026 (USD Million)
        TABLE 27 The Middle-East and Africa Nutraceuticals Aluminum Bottle Market, by Sales Channel, 2016-2026 (Million Units)
        TABLE 28 North America Nutraceuticals Aluminum Bottle Production, Consumption, Export, Import, 2016-2019
        TABLE 29 Europe Nutraceuticals Aluminum Bottle Production, Consumption, Export, Import, 2016-2019
        TABLE 30 Asia Pacific Nutraceuticals Aluminum Bottle Production, Consumption, Export, Import, 2016-2019
        TABLE 31 Latin America Nutraceuticals Aluminum Bottle Production, Consumption, Export, Import, 2016-2019
        TABLE 32 Middle East & Africa Nutraceuticals Aluminum Bottle Production, Consumption, Export, Import, 2016-2019
        TABLE 33 Global Nutraceuticals Aluminum Bottle Market - Company Revenue Analysis 2016-2019 (USD Million)
        TABLE 34 Global Nutraceuticals Aluminum Bottle Market - Company Revenue Share Analysis 2016-2019(%)
        TABLE 35 Global Nutraceuticals Aluminum Bottle Market - Company Volume Analysis 2016-2019 (Million Units)
        TABLE 36 Global Nutraceuticals Aluminum Bottle Market - Company Volume Share Analysis 2016-2019(%)
        TABLE 37 Acquisitions and Mergers
        TABLE 38 New Product/Service Launch
        TABLE 39 Research & Development Activities
        TABLE 40 Market Drivers
        TABLE 41 Market Restraints
        TABLE 42 Market Opportunities
        TABLE 43 Production Base and Market Concentration Rate of Raw Material
        TABLE 44 Key Suppliers of Raw Materials
        TABLE 45 Raw Materials Sources of Nutraceuticals Aluminum Bottle Major Manufacturers in 2016
        TABLE 46 Major Buyers of Nutraceuticals Aluminum Bottle
        TABLE 47 Distributors/Traders of Nutraceuticals Aluminum Bottle by Region

Industry Major Market Players

  • CCL Container
  • MJS Packaging Inc.
  • Shining Aluminum Packaging
  • Al-can Exports Pvt. Ltd.
  • Exal Corporation
  • Tecnocap S.p.A