Search Market Research Report

Discover Our Latest Reports
Discover Our Featured Reports
Discover Top Selling Reports

North America and Europe Visual Search Market Size, Share Global Analysis Report, 2019–2027

report img

North America and Europe Visual Search Market By Offering (Image Search and Search Recommendation) and By Vertical (Consumer Goods, Retail, Automotive, Healthcare, and Others): Industry Perspective, Comprehensive Analysis, and Forecast 2019–2027

Industry Insights

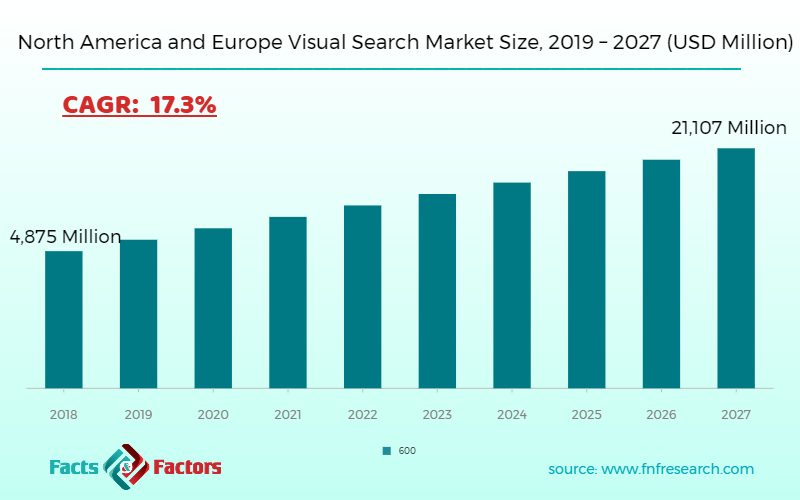
The report covers a forecast and an analysis of the North America and Europe visual search market. The study provides historical data from 2013 to 2018 and a forecast from 2019 to 2027 based on revenue (USD Million). The study includes drivers and restraints of the North America and Europe visual search market along with their impact on the demand over the forecast period. Additionally, the report includes the study of opportunities available in North America and Europe visual search market.

North America and Europe Visual Search Market Size

To know more about this report | Request Free Sample Copy

In order to give the users of this report a comprehensive view of the North America and Europe visual search market, we have included a competitive landscape and an analysis of Porter’s Five Forces model for the market. The study encompasses a market attractiveness analysis, wherein all the segments are benchmarked based on their market size, growth rate, and general attractiveness.

The report provides company market share analysis to give a broader overview of the key market players. In addition, the report also covers key strategic developments of the market including acquisitions & mergers, new launches, agreements, partnerships, collaborations & joint ventures, research & development, and regional expansion of major participants involved in the market North America and Europe.

The study provides a decisive view of North America and Europe visual search market by segmenting it based on offering, vertical, and region. All the segments have been analyzed based on present and future trends and the market is estimated from 2019 to 2027. The regional segment includes the current and forecast demand for North America and Europe.

The rising use of machine learning in visual search is the major growth driver of North America and Europe visual search market in the years ahead. Deep machine learning draws its inspiration from the way biological neural networks in the human brain obtain information from the various senses of the body. Deep machine learning has various applications, particularly when it comes to analyzing, understanding, and discovering new patterns and new knowledge that is hidden in huge data volumes and needs to be segregated systematically.

logoReport Scope

Report Attribute

Details

Market Size in 2018

USD 4,875 million

Projected Market Size in 2027

USD 21,107 million

Growth Rate

CAGR 17.3%

Base Year

2018

Forecast Years

2019-2027

Key Market Players

Turing Analytics, Amazon.com, Snap Inc., Slyce Acquisition, Blippar Clarifai, ViSenze, Shopagon, Pinterest, Goxip.com, Veritone, Syte.ai, TinEye, Cortexica Vision Systems, Wide Eyes Technologies, Microsoft, and Alphabet, among others.

Key Segment

By Offering, By Vertical

Major Regions Covered

North America, Europe, Asia Pacific, Latin America, and the Middle East & Africa

Purchase Options

Request customized purchase options to meet your research needs. Explore purchase options

Undeniably, in the age of big data and the flourishing internet of things, deep machine learning is the key technology that enables businesses to extract value from their huge volumes of data, overcome the challenges of the fourth industrial revolution, and support business success.

By offering, the market is bifurcated into search recommendation and image search. The vertical segment includes consumer goods, automotive, healthcare, retail, and others.

This report segments North America and Europe visual search market into:

logoCompetitive Landscape

  • Amazon.com, 
  • Snap Inc., 
  • Slyce Acquisition, 
  • Blippar Clarifai, 
  • ViSenze, 
  • Shopagon, 
  • Pinterest, 
  • Goxip.com, 
  • Veritone, 
  • Syte.ai, 
  • TinEye, 
  • Cortexica Vision Systems, 
  • Wide Eyes Technologies, 
  • Microsoft, 
  • Alphabet, 
  • among.

To know more about this report | Request Free Sample Copy

logo By Offering

  • Image Search
  • Search Recommendation

logo By Vertical

  • Consumer Goods
  • Retail
  • Automotive
  • Healthcare
  • Others

logo By Region

  • North America
    • U.S.
  • Europe
    • UK
    • France
    • Germany
  • Asia Pacific
    • China
    • Japan
    • India
  • Latin America
    • Brazil
  • Middle East and Africa

Table of Content

  • Chapter 1. Executive Summary 18
  • Chapter 2. North America and Europe Visual Search market – Offering Analysis 21
    • 2.1.  North America and Europe Visual Search Market – Offering Overview 21
    • 2.2.  North America and Europe Visual Search Market Share, by Offering, 2018 & 2025 (USD Million) 21
    • 2.3. Image Search 23
      • 2.3.1.  Image Search North America and Europe Visual Search Market, 2015-2025 (USD Million) 23
    • 2.4. Search Recommendation 24
      • 2.4.1.  Search Recommendation North America and Europe Visual Search Market, 2015-2025 (USD Million) 24
  • Chapter 3. North America and Europe Visual Search market – Vertical Analysis 24
    • 3.1.  North America and Europe Visual Search Market – Vertical Overview 24
    • 3.2.  North America and Europe Visual Search Market Share, by Vertical, 2018 & 2025 (USD Million) 25
    • 3.3. Consumer Goods 26
      • 3.3.1.  Consumer Goods North America and Europe Visual Search Market, 2015-2025 (USD Million) 26
    • 3.4. Retail 27
      • 3.4.1.  Retail North America and Europe Visual Search Market, 2015-2025 (USD Million) 27
    • 3.5. Automotive 28
      • 3.5.1.  Automotive North America and Europe Visual Search Market, 2015-2025 (USD Million) 28
    • 3.6. Healthcare 29
      • 3.6.1.  Healthcare North America and Europe Visual Search Market, 2015-2025 (USD Million) 29
    • 3.7. Others 30
      • 3.7.1.  Others North America and Europe Visual Search Market, 2015-2025 (USD Million) 30
  • Chapter 4. North America and Europe Visual Search market – Regional Analysis 31
    • 4.1.  North America and Europe Visual Search Market Regional Overview 31
    • 4.2.  North America and Europe Visual Search Market Share, by Region, 2018 & 2025 (Value) 31
    • 4.3. North America 33
      • 4.3.1. North America North America and Europe Visual Search Market size and forecast, 2015-2025 33
      • 4.3.2. North America North America and Europe Visual Search Market, by Country, 2018 & 2025 (USD Million) 33
      • 4.3.3. North America North America and Europe Visual Search Market, by Offering, 2015-2025 35
        • 4.3.3.1. North America North America and Europe Visual Search Market, by Offering, 2015-2025 (USD Million) 35
      • 4.3.4. North America North America and Europe Visual Search Market, by Vertical, 2015-2025 36
        • 4.3.4.1. North America North America and Europe Visual Search Market, by Vertical, 2015-2025 (USD Million) 36
      • 4.3.5. U.S. 37
        • 4.3.5.1. U.S. Market size and forecast, 2015-2025 (USD Million) 37
      • 4.3.6. Canada 38
        • 4.3.6.1. Canada Market size and forecast, 2015-2025 (USD Million) 38
      • 4.3.7. Mexico 39
        • 4.3.7.1. Mexico Market size and forecast, 2015-2025 (USD Million) 39
    • 4.4. Europe 40
      • 4.4.1. Europe North America and Europe Visual Search Market size and forecast, 2015-2025 40
      • 4.4.2. Europe North America and Europe Visual Search Market, by Country, 2018 & 2025 (USD Million) 40
      • 4.4.3. Europe North America and Europe Visual Search Market, by Offering, 2015-2025 42
        • 4.4.3.1. Europe North America and Europe Visual Search Market, by Offering, 2015-2025 (USD Million) 42
      • 4.4.4. Europe North America and Europe Visual Search Market, by Vertical, 2015-2025 43
        • 4.4.4.1. Europe North America and Europe Visual Search Market, by Vertical, 2015-2025 (USD Million) 43
      • 4.4.5. Germany 44
        • 4.4.5.1. Germany Market size and forecast, 2015-2025 (USD Million) 44
      • 4.4.6. France 45
        • 4.4.6.1. France Market size and forecast, 2015-2025 (USD Million) 45
      • 4.4.7. U.K. 46
        • 4.4.7.1. U.K. Market size and forecast, 2015-2025 (USD Million) 46
      • 4.4.8. Italy 47
        • 4.4.8.1. Italy Market size and forecast, 2015-2025 (USD Million) 47
      • 4.4.9. Spain 48
        • 4.4.9.1. Spain Market size and forecast, 2015-2025 (USD Million) 48
      • 4.4.10. Nordic Countries 49
        • 4.4.10.1. Nordic Countries Market size and forecast, 2015-2025 (USD Million) 49
      • 4.4.11. Benelux Union 50
        • 4.4.11.1. Benelux Union Market size and forecast, 2015-2025 (USD Million) 50
      • 4.4.12. Rest of Europe 51
        • 4.4.12.1. Rest of Europe Market size and forecast, 2015-2025 (USD Million) 51
  • Chapter 5. North America and Europe Visual Search market – Competitive Landscape 52
    • 5.1. Competitor Market Share – Revenue 52
    • 5.2. Market Concentration Rate Analysis, Top 3 and Top 5 Players 54
    • 5.3. Strategic Development 55
      • 5.3.1. Acquisitions and Mergers 55
      • 5.3.2. New Products 55
      • 5.3.3. Research & Development Activities 55
  • Chapter 6. Company Profiles 56
    • 6.1. Turing Analytics 56
      • 6.1.1. Company Overview 56
      • 6.1.2. Turing Analytics Revenue and Gross Margin 56
      • 6.1.3. Product portfolio 57
      • 6.1.4. Recent initiatives 58
    • 6.2. Amazon.com 58
      • 6.2.1. Company Overview 58
      • 6.2.2. Amazon.com Revenue and Gross Margin 58
      • 6.2.3. Product portfolio 59
      • 6.2.4. Recent initiatives 60
    • 6.3. Snap Inc. 60
      • 6.3.1. Company Overview 60
      • 6.3.2. Snap Inc. Revenue and Gross Margin 60
      • 6.3.3. Product portfolio 61
      • 6.3.4. Recent initiatives 62
    • 6.4. Slyce Acquisition 62
      • 6.4.1. Company Overview 62
      • 6.4.2. Slyce Acquisition Revenue and Gross Margin 62
      • 6.4.3. Product portfolio 63
      • 6.4.4. Recent initiatives 64
    • 6.5. Blippar Clarifai 64
      • 6.5.1. Company Overview 64
      • 6.5.2. Blippar Clarifai Revenue and Gross Margin 64
      • 6.5.3. Product portfolio 65
      • 6.5.4. Recent initiatives 66
    • 6.6. ViSenze 66
      • 6.6.1. Company Overview 66
      • 6.6.2. ViSenze Revenue and Gross Margin 66
      • 6.6.3. Product portfolio 67
      • 6.6.4. Recent initiatives 68
    • 6.7. Shopagon 68
      • 6.7.1. Company Overview 68
      • 6.7.2. Shopagon Revenue and Gross Margin 68
      • 6.7.3. Product portfolio 69
      • 6.7.4. Recent initiatives 70
    • 6.8. Pinterest 70
      • 6.8.1. Company Overview 70
      • 6.8.2. Pinterest Revenue and Gross Margin 70
      • 6.8.3. Product portfolio 71
      • 6.8.4. Recent initiatives 72
    • 6.9. Goxip.com 72
      • 6.9.1. Company Overview 72
      • 6.9.2. Goxip.com Revenue and Gross Margin 72
      • 6.9.3. Product portfolio 73
      • 6.9.4. Recent initiatives 74
    • 6.10. Veritone 74
      • 6.10.1. Company Overview 74
      • 6.10.2. Veritone Revenue and Gross Margin 74
      • 6.10.3. Product portfolio 75
      • 6.10.4. Recent initiatives 76
    • 6.11. Syte.ai 76
      • 6.11.1. Company Overview 76
      • 6.11.2. Syte.ai Revenue and Gross Margin 76
      • 6.11.3. Product portfolio 77
      • 6.11.4. Recent initiatives 78
    • 6.12. TinEye 78
      • 6.12.1. Company Overview 78
      • 6.12.2. TinEye Revenue and Gross Margin 78
      • 6.12.3. Product portfolio 79
      • 6.12.4. Recent initiatives 80
    • 6.13. Cortexica Vision Systems 80
      • 6.13.1. Company Overview 80
      • 6.13.2. Cortexica Vision Systems Revenue and Gross Margin 80
      • 6.13.3. Product portfolio 81
      • 6.13.4. Recent initiatives 82
    • 6.14. Wide Eyes Technologies 82
      • 6.14.1. Company Overview 82
      • 6.14.2. Wide Eyes Technologies Revenue and Gross Margin 82
      • 6.14.3. Product portfolio 83
      • 6.14.4. Recent initiatives 84
    • 6.15. Microsoft 84
      • 6.15.1. Company Overview 84
      • 6.15.2. Microsoft Revenue and Gross Margin 84
      • 6.15.3. Product portfolio 85
      • 6.15.4. Recent initiatives 86
    • 6.16. Alphabet 86
      • 6.16.1. Company Overview 86
      • 6.16.2. Alphabet Revenue and Gross Margin 86
      • 6.16.3. Product portfolio 87
      • 6.16.4. Recent initiatives 88
  • Chapter 7. North America and Europe Visual Search — Industry Analysis 89
    • 7.1. North America and Europe Visual Search Market – Key Trends 89
      • 7.1.1. Market Drivers 90
      • 7.1.2. Market Restraints 90
      • 7.1.3. Market Opportunities 91
    • 7.2. Value Chain Analysis 92
    • 7.3. Technology Roadmap and Timeline 93
    • 7.4. North America and Europe Visual Search Market – Attractiveness Analysis 94
      • 7.4.1. By Offering 94
      • 7.4.2. By Vertical 94
      • 7.4.3. By Region 96
  • Chapter 8. Marketing Strategy Analysis, Distributors 97
    • 8.1. Marketing Channel 97
    • 8.2. Direct Marketing 98
    • 8.3. Indirect Marketing 98
    • 8.4. Marketing Channel Development Trend 98
    • 8.5. Economic/Political Environmental Change 99
  • Chapter 9. Report Conclusion 100
  • Chapter 10. Research Approach & Methodology 101
    • 10.1. Report Description 101
    • 10.2. Research Scope 102
    • 10.3. Research Methodology 102
      • 10.3.1. Secondary Research 103
      • 10.3.2. Primary Research 104
      • 10.3.3. Models 105
        • 10.3.3.1. Company Share Analysis Model 105
        • 10.3.3.2. Revenue Based Modeling 106
        • 10.3.3.3. Research Limitations 106

List of Figures

FIG. 1  North America and Europe Visual Search Market, 2015-2025 (USD Million) 20
FIG. 2  North America and Europe Visual Search Market Share, by Offering, 2018 & 2025 (USD Million) 21
FIG. 3  Image Search North America and Europe Visual Search Market, 2015-2025 (USD Million) 23
FIG. 4  Search Recommendation North America and Europe Visual Search Market, 2015-2025 (USD Million) 24
FIG. 5  North America and Europe Visual Search Market Share, by Vertical, 2018 & 2025 (USD Million) 25
FIG. 6  Consumer Goods North America and Europe Visual Search Market, 2015-2025 (USD Million) 26
FIG. 7  Retail North America and Europe Visual Search Market, 2015-2025 (USD Million) 27
FIG. 8  Automotive North America and Europe Visual Search Market, 2015-2025 (USD Million) 28
FIG. 9  Healthcare North America and Europe Visual Search Market, 2015-2025 (USD Million) 29
FIG. 10  Others North America and Europe Visual Search Market, 2015-2025 (USD Million) 30
FIG. 11  North America and Europe Visual Search Market Share, by Region, 2018 & 2025 31
FIG. 12 North America North America and Europe Visual Search Market, 2015-2025 33
FIG. 13 U.S. North America and Europe Visual Search Market, 2015-2025 37
FIG. 14 Canada North America and Europe Visual Search Market, 2015-2025 38
FIG. 15 Mexico North America and Europe Visual Search Market, 2015-2025 39
FIG. 16 Europe North America and Europe Visual Search Market, 2015-2025 40
FIG. 17 Germany North America and Europe Visual Search Market, 2015-2025 44
FIG. 18 France North America and Europe Visual Search Market, 2015-2025 45
FIG. 19 U.K. North America and Europe Visual Search Market, 2015-2025 46
FIG. 20 Italy North America and Europe Visual Search Market, 2015-2025 47
FIG. 21 Spain North America and Europe Visual Search Market, 2015-2025 48
FIG. 22 Nordic Countries North America and Europe Visual Search Market, 2015-2025 49
FIG. 23 Benelux Union North America and Europe Visual Search Market, 2015-2025 50
FIG. 24 Rest of Europe North America and Europe Visual Search Market, 2015-2025 51
FIG. 25 Competitor Market Share – Revenue 52
FIG. 26 Turing Analytics Revenue and Growth Rate 57
FIG. 27 Turing Analytics Market Share 57
FIG. 28 Amazon.com Revenue and Growth Rate 59
FIG. 29 Amazon.com Market Share 59
FIG. 30 Snap Inc. Revenue and Growth Rate 61
FIG. 31 Snap Inc. Market Share 61
FIG. 32 Slyce Acquisition Revenue and Growth Rate 63
FIG. 33 Slyce Acquisition Market Share 63
FIG. 34 Blippar Clarifai Revenue and Growth Rate 65
FIG. 35 Blippar Clarifai Market Share 65
FIG. 36 ViSenze Revenue and Growth Rate 67
FIG. 37 ViSenze Market Share 67
FIG. 38 Shopagon Revenue and Growth Rate 69
FIG. 39 Shopagon Market Share 69
FIG. 40 Pinterest Revenue and Growth Rate 71
FIG. 41 Pinterest Market Share 71
FIG. 42 Goxip.com Revenue and Growth Rate 73
FIG. 43 Goxip.com Market Share 73
FIG. 44 Veritone Revenue and Growth Rate 75
FIG. 45 Veritone Market Share 75
FIG. 46 Syte.ai Revenue and Growth Rate 77
FIG. 47 Syte.ai Market Share 77
FIG. 48 TinEye Revenue and Growth Rate 79
FIG. 49 TinEye Market Share 79
FIG. 50 Cortexica Vision Systems Revenue and Growth Rate 81
FIG. 51 Cortexica Vision Systems Market Share 81
FIG. 52 Wide Eyes Technologies Revenue and Growth Rate 83
FIG. 53 Wide Eyes Technologies Market Share 83
FIG. 54 Microsoft Revenue and Growth Rate 85
FIG. 55 Microsoft Market Share 85
FIG. 56 Alphabet Revenue and Growth Rate 87
FIG. 57 Alphabet Market Share 87
FIG. 58 Market Dynamics 89
FIG. 59  North America and Europe Visual Search – Value Chain Analysis 92
FIG. 60 Technology Roadmap and Timeline 93
FIG. 61 Market Attractiveness Analysis – By Offering 94
FIG. 62 Market Attractiveness Analysis – By Vertical 95
FIG. 63 Market Attractiveness Analysis – By Region 96
FIG. 64 Market Channel 97
FIG. 65 Marketing Channel Development Trend 98
FIG. 66 Growth in World Gross Product, 2008-2018 99


List of Tables

TABLE 1  North America and Europe Visual Search Market, 2018 & 2025 (USD Million) 19
TABLE 2  North America and Europe Visual Search market, by Offering, 2015-2025 (USD Million) 21
TABLE 3  North America and Europe Visual Search market, by Vertical, 2015-2025 (USD Million) 25
TABLE 4  North America and Europe Visual Search market, by Region, 2015-2025 (USD Million) 31
TABLE 5 North America North America and Europe Visual Search Market, by Offering, 2015-2025 (USD Million) 35
TABLE 6 North America North America and Europe Visual Search Market, by Vertical, 2015-2025 (USD Million) 36
TABLE 7 Europe North America and Europe Visual Search Market, by Offering, 2015-2025 (USD Million) 42
TABLE 8 Europe North America and Europe Visual Search Market, by Vertical, 2015-2025 (USD Million) 43
TABLE 9  North America and Europe Visual Search Market - Company Revenue Analysis 2015-2018 (USD Million) 52
TABLE 10  North America and Europe Visual Search Market - Company Revenue Share Analysis 2015-2018 (%) 54
TABLE 11 Acquisitions and Mergers 55
TABLE 12 New Product/Service Launch 55
TABLE 13 Research & Development Activities 55
TABLE 14 Market Drivers 90
TABLE 15 Market Restraints 90
TABLE 16 Market Opportunities 91


Industry Major Market Players

  • Amazon.com, 
  • Snap Inc., 
  • Slyce Acquisition, 
  • Blippar Clarifai, 
  • ViSenze, 
  • Shopagon, 
  • Pinterest, 
  • Goxip.com, 
  • Veritone, 
  • Syte.ai, 
  • TinEye, 
  • Cortexica Vision Systems, 
  • Wide Eyes Technologies, 
  • Microsoft, 
  • Alphabet, 
  • among.