Search Market Research Report

Discover Our Latest Reports
Discover Our Featured Reports
Discover Top Selling Reports

Legal Marijuana Market Size, Share Global Analysis Report, 2021 - 2026

report img

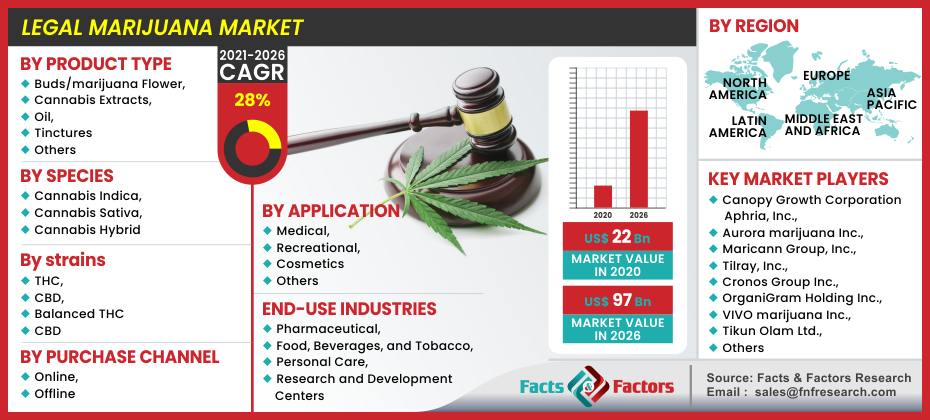
Legal Marijuana Market by Product Type (Buds/marijuana Flower, Cannabis Extracts, Oil, Tinctures) & Others, Species (Cannabis Indica, Cannabis Sativa, Cannabis Hybrid), Strains (THC, CBD, Balanced THC and CBD), Purchase Channel (Online, Offline), Application (Medical, Recreational, Cosmetics) & Others, End-Use Industries (Pharmaceutical, Food, Beverages, and Tobacco, Personal Care, Research and Development Centers), and Geography - Global & Regional Industry Perspectives, Comprehensive Industry Analysis, and Forecast 2021 - 2026

Industry Insights

[223+ Pages Report] According to Facts & Factors, the global legal marijuana market was assessed at around USD 22 Billion in 2020 and is anticipated to generate revenue worth over USD 97 Billion by the end of 2026, representing a CAGR of around 28% between 2021 and 2026.

logoMarket Overview

Marijuana is made up of dried cannabis flowers and leaves, which are also known as hemp, weed, dope, or cannabis. Tetrahydrocannabinol (THC) is a psychoactive (mind-altering) compound found in marijuana, as well as non-psychoactive active compounds like cannabidiol (CBD). Marijuana is one of the most heavily abused drugs on the planet. Marijuana is derived from the hemp plant, and the “drug” is most commonly produced in the flowers (also known as “buds”), with much less being produced in the seeds, leaves, and stems. Marijuana is a mixture of dried hemp plant leaves, stems, flowers, and seeds that is sold. Its color is typically green, brown, or grey. Marijuana, like alcohol, cocaine, and ecstasy, is a psychoactive substance. Like these types of other medications, marijuana has potentially adverse side effects.

Legal Marijuana Market

To know more about this report | Request Free Sample Copy

logoIndustry Growth Factors

The demand for legalized marijuana is rapidly increasing, especially in countries where marijuana for medicinal purposes and for food & beverages is legal. CBD isolates will see even more development in the coming year's thanks to a recent novel food ruling in Europe. Furthermore, children who consume cannabis are only prescribed oil because it has proven to be effective in the treatment of conditions such as epilepsy. Owing to shifts in government policy, the market for legal marijuana is expected to skyrocket. Several new cannabis start-ups are pursuing R&D, research, and manufacturing. The privatization of cannabis retail stores is anticipated in several provinces. Several provinces that previously selected a single supplier are now encouraging several suppliers to submit bids. Over the forecast period, these factors are expected to drive the market. The increasing legalization of cannabis in several countries is a major factor driving market development. Marijuana's efficacy for medicinal purposes is gaining traction around the world as a result of recent legalizations in several countries. Medicinal hemp is used to treat chronic diseases like cancer, arthropathy, and neurological conditions like depression, panic attacks, Alzheimer's disease, and Parkinson's disease. The high prevalence of cancer is expected to be a critical factor driving the need for marijuana legalization. However, the various contradictory conclusions about smoking cannabis, such as mucus composition, persistent cough, and respiratory infections like COPD, will serve as a market restriction. The wide legalization of marijuana in this manner will have a variety of consequences for the economy and culture of the countries where it is legalized. Legalization requires policymakers to apply application-based regulations to marijuana production and distribution, meaning that it contributes to the country's GDP. Legalization also aids in the eradication of gangs and black-market traffickers, as well as the reduction of related crime rates.

logoSegmentation Analysis

The legal marijuana market is segmented based on product type, species, strain, purchase channel, application, and end-user.

As per product type segmentation, the market is divided into Buds/marijuana flower, cannabis extracts(oil, tinctures), others. Based on species type segmentation, the market is classified into Cannabis Indica, Cannabis Sativa, Cannabis Hybrid. Based on strain type segmentation, the market is classified into THC-dominant, CBD-dominant, Balanced THC, and CBD. Based on purchase channel segmentation, the market is classified into online, offline. In terms of application, the market is split into Medical (Chronic Pain, Mental Disorders, Cancer), Recreational, Cosmetics & Others. As per the end-user type, the market is bifurcated into pharmaceutical, food, beverages, and Tobacco, personal care, research, and development centers. The use of medical marijuana is critical for a variety of reasons. Medical marijuana is provided to patients with chronic illnesses including Parkinson's, cancer, Alzheimer's, and a variety of neurological disorders. The demand for cannabis oil is rapidly increasing, especially in countries where medical marijuana is legal. CBD isolates will see even more development in the coming year's thanks to a recent novel food ruling in Europe. Furthermore, children who consume cannabis are only prescribed oil because it has proven to be effective in the treatment of conditions such as epilepsy. The adoption of new and advanced technologies, which has made them more multifunctional, has provided the industry with many lucrative growth opportunities in the coming years.

logo Regional Analysis

North America dominated the global legal marijuana industry, with Latin America, the Middle East, and Africa, Europe, and Asia-Pacific following closely behind. The largest share of this area is due to technological advances in marijuana cultivation and processing, a broad base of marijuana users, shifting attitudes about marijuana which is legal use for both medicinal and recreational purposes, and increased investments from leading players. Furthermore, recreational use of the cannabis herb, tension, and government restrictions or allowances to use and employ it for health-beneficial purposes have all led to the region's market dominance.

logo Covid 19 Analysis

The World Health Organization declared the year 2019 to be the Year of Healthcare Emergence. To combat the spread of the coronavirus, the government declared it a pandemic, and many countries implemented lockdowns and airline bans. Marijuana could help manage Covid-19's minor effects. As a result, during the epidemic in research and development efforts, demand for marijuana, which is often employed in medical applications, has surged. The quick increase in significant research and development operations to better understand the application spectrum of legalized marijuana mainly used for medicinal purposes, not just for treating COVID-19 but also for a variety of other conditions, should bode well for market expansion in the next years. In the coming years, the number of nations that have legalized marijuana may increase, broadening the spectrum of its therapeutic applications. These products have been utilized to produce a vaccination to treat Covid-19, and the results have been promising. By 2021, market shares are likely to return to normal levels. According to the World Health Organization (WHO), marijuana or cannabis is used for medical purposes by 80% of the world's population. As a result, the increased acceptability, cultivation, and production of cannabis in developing countries is helping to drive the medical cannabis market forward.

logoReport Scope

Report Attribute

Details

Market Size in 2020

USD 22 Billion

Projected Market Size in 2026

USD 97 Billion

Growth Rate

CAGR 28%

Base Year

2020

Forecast Years

2021-2026

Key Market Players

Canopy Growth Corporation Aphria, Inc., Aurora marijuana Inc., Maricann Group, Inc., Tilray, Inc., Cronos Group Inc., OrganiGram Holding Inc., VIVO marijuana Inc., Tikun Olam Ltd., The Green Organic Dutchman Holdings Ltd., Terra Tech Corp., Medical Cannabis, Inc., Stenocare A/S, Cannabis Science, Inc., HEXO Corp and amongst others.

Key Segment

By Product Type, By Species, By Strain, By Purchase Channel, By Application, By End-User and By Region

Major Regions Covered

North America, Europe, Asia Pacific, Latin America, and the Middle East & Africa

Purchase Options

Request customized purchase options to meet your research needs. Explore purchase options

logo Competitive Players

Some of the essential players operating in the legal marijuana market are :

  • Canopy Growth Corporation Aphria Inc.
  • Aurora marijuana Inc.
  • Maricann Group Inc.
  • Tilray Inc.
  • Cronos Group Inc.
  • OrganiGram Holding Inc.
  • VIVO marijuana Inc.
  • Tikun Olam Ltd.
  • The Green Organic Dutchman Holdings Ltd.
  • Terra Tech Corp.
  • Medical Cannabis Inc.
  • Stenocare A/S
  • Cannabis Science Inc.
  • HEXO Corp

logoLegal Marijuana Market: Regional Segment Analysis

  • North America
  • U.S.
  • Canada
  • Europe
  • Germany
  • U.K.
  • France
  • Italy
  • The Netherlands
  • Rest of Europe
  • Asia-Pacific
  • Australia
  • South Korea
  • Rest of Asia-Pacific
  • Latin America
  • Argentina
  • Colombia
  • Uruguay
  • Rest of Latin America
  • The Middle East and Africa
  • South Africa
  • Israel

Table of Content

  1. Chapter 1 Executive Summary
    1. 1.1. Introduction of Legal Marijuana
    2. 1.2. Global Legal Marijuana Market, 2020 & 2026 (USD Billion)
    3. 1.3. Global Legal Marijuana Market, 2016 – 2026 (USD Billion) (Kilo Tons)
    4. 1.4. Global Legal Marijuana Market Absolute Revenue Opportunity, 2016 – 2026 (USD Billion)
    5. 1.5. Global Legal Marijuana Market Incremental Revenue Opportunity, 2020 – 2026 (USD Billion)
  2. Chapter 2 Legal Marijuana Market – Product Type Analysis
    1. 2.1. Global Legal Marijuana Market – Product Type Overview
    2. 2.2. Global Legal Marijuana Market Share, by Product Type, 2020 & 2026 (USD Billion)
    3. 2.3. Global Legal Marijuana Market share, by Product Type, 2020 & 2026 (Kilo Tons)
    4. 2.4. Buds / marijuana Flower
      1. 2.4.1. Global Buds / marijuana Flower Legal Marijuana Market, 2016 – 2026 (USD Billion)
      2. 2.4.2. Global Buds / marijuana Flower Legal Marijuana Market, 2016 – 2026 (Kilo Tons)
    5. 2.5. Cannabis Extracts
      1. 2.5.1. Global Cannabis Extracts Legal Marijuana Market, 2016 – 2026 (USD Billion)
      2. 2.5.2. Global Cannabis Extracts Legal Marijuana Market, 2016 – 2026 (Kilo Tons)
    6. 2.6. Others
      1. 2.6.1. Global Others Legal Marijuana Market, 2016 – 2026 (USD Billion)
      2. 2.6.2. Global Others Legal Marijuana Market, 2016 – 2026 (Kilo Tons)
  3. Chapter 3 Legal Marijuana Market – Species Analysis
    1. 3.1. Global Legal Marijuana Market – Species Overview
    2. 3.2. Global Legal Marijuana Market Share, by Species, 2020 & 2026 (USD Billion)
    3. 3.3. Global Legal Marijuana Market share, by Species, 2020 & 2026 (Kilo Tons)
    4. 3.4. Cannabis Indica
      1. 3.4.1. Global Cannabis Indica Legal Marijuana Market, 2016 – 2026 (USD Billion)
      2. 3.4.2. Global Cannabis Indica Legal Marijuana Market, 2016 – 2026 (Kilo Tons)
    5. 3.5. Cannabis Sativa
      1. 3.5.1. Global Cannabis Sativa Legal Marijuana Market, 2016 – 2026 (USD Billion)
      2. 3.5.2. Global Cannabis Sativa Legal Marijuana Market, 2016 – 2026 (Kilo Tons)
    6. 3.6. Cannabis Hybrid
      1. 3.6.1. Global Cannabis Hybrid Legal Marijuana Market, 2016 – 2026 (USD Billion)
      2. 3.6.2. Global Cannabis Hybrid Legal Marijuana Market, 2016 – 2026 (Kilo Tons)
  4. Chapter 4 Legal Marijuana Market – Strain Analysis
    1. 4.1. Global Legal Marijuana Market – Strain Overview
    2. 4.2. Global Legal Marijuana Market Share, by Strain, 2020 & 2026 (USD Billion)
    3. 4.3. Global Legal Marijuana Market share, by Strain, 2020 & 2026 (Kilo Tons)
    4. 4.4. THC-dominant
      1. 4.4.1. Global THC-dominant Legal Marijuana Market, 2016 – 2026 (USD Billion)
      2. 4.4.2. Global THC-dominant Legal Marijuana Market, 2016 – 2026 (Kilo Tons)
    5. 4.5. CBD-dominant
      1. 4.5.1. Global CBD-dominant Legal Marijuana Market, 2016 – 2026 (USD Billion)
      2. 4.5.2. Global CBD-dominant Legal Marijuana Market, 2016 – 2026 (Kilo Tons)
    6. 4.6. Balanced THC and CBD
      1. 4.6.1. Global Balanced THC and CBD Legal Marijuana Market, 2016 – 2026 (USD Billion)
      2. 4.6.2. Global Balanced THC and CBD Legal Marijuana Market, 2016 – 2026 (Kilo Tons)
  5. Chapter 5 Legal Marijuana Market – Purchase Channel Analysis
    1. 5.1. Global Legal Marijuana Market – Purchase Channel Overview
    2. 5.2. Global Legal Marijuana Market Share, by Purchase Channel, 2020 & 2026 (USD Billion)
    3. 5.3. Global Legal Marijuana Market share, by Purchase Channel, 2020 & 2026 (Kilo Tons)
    4. 5.4. Online
      1. 5.4.1. Global Online Legal Marijuana Market, 2016 – 2026 (USD Billion)
      2. 5.4.2. Global Online Legal Marijuana Market, 2016 – 2026 (Kilo Tons)
    5. 5.5. Offline
      1. 5.5.1. Global Offline Legal Marijuana Market, 2016 – 2026 (USD Billion)
      2. 5.5.2. Global Offline Legal Marijuana Market, 2016 – 2026 (Kilo Tons)
  6. Chapter 6 Legal Marijuana Market – Application Analysis
    1. 6.1. Global Legal Marijuana Market – Application Overview
    2. 6.2. Global Legal Marijuana Market Share, by Application, 2020 & 2026 (USD Billion)
    3. 6.3. Global Legal Marijuana Market share, by Application, 2020 & 2026 (Kilo Tons)
    4. 6.4. Medical
      1. 6.4.1. Global Medical Legal Marijuana Market, 2016 – 2026 (USD Billion)
      2. 6.4.2. Global Medical Legal Marijuana Market, 2016 – 2026 (Kilo Tons)
    5. 6.5. Recreational
      1. 6.5.1. Global Recreational Legal Marijuana Market, 2016 – 2026 (USD Billion)
      2. 6.5.2. Global Recreational Legal Marijuana Market, 2016 – 2026 (Kilo Tons)
    6. 6.6. Cosmetics
      1. 6.6.1. Global Cosmetics Legal Marijuana Market, 2016 – 2026 (USD Billion)
      2. 6.6.2. Global Cosmetics Legal Marijuana Market, 2016 – 2026 (Kilo Tons)
    7. 6.7. Others
      1. 6.7.1. Global Others Legal Marijuana Market, 2016 – 2026 (USD Billion)
      2. 6.7.2. Global Others Legal Marijuana Market, 2016 – 2026 (Kilo Tons)
  7. Chapter 7 Legal Marijuana Market – End-User Analysis
    1. 7.1. Global Legal Marijuana Market – End-User Overview
    2. 7.2. Global Legal Marijuana Market Share, by End-User, 2020 & 2026 (USD Billion)
    3. 7.3. Global Legal Marijuana Market share, by End-User, 2020 & 2026 (Kilo Tons)
    4. 7.4. Pharmaceutical
      1. 7.4.1. Global Pharmaceutical Legal Marijuana Market, 2016 – 2026 (USD Billion)
      2. 7.4.2. Global Pharmaceutical Legal Marijuana Market, 2016 – 2026 (Kilo Tons)
    5. 7.5. Food, Beverages, and Tobacco
      1. 7.5.1. Global Food, Beverages, and Tobacco Legal Marijuana Market, 2016 – 2026 (USD Billion)
      2. 7.5.2. Global Food, Beverages, and Tobacco Legal Marijuana Market, 2016 – 2026 (Kilo Tons)
    6. 7.6. Personal Care
      1. 7.6.1. Global Personal Care Legal Marijuana Market, 2016 – 2026 (USD Billion)
      2. 7.6.2. Global Personal Care Legal Marijuana Market, 2016 – 2026 (Kilo Tons)
    7. 7.7. Research and Development Centers
      1. 7.7.1. Global Research and Development Centers Legal Marijuana Market, 2016 – 2026 (USD Billion)
      2. 7.7.2. Global Research and Development Centers Legal Marijuana Market, 2016 – 2026 (Kilo Tons)
  8. Chapter 8 Legal Marijuana Market – Regional Analysis
    1. 8.1. Global Legal Marijuana Market Regional Overview
    2. 8.2. Global Legal Marijuana Market Share, by Region, 2020 & 2026 (USD Billion)
    3. 8.3. Global Legal Marijuana Market Share, by Region, 2020 & 2026 (Kilo Tons)
    4. 8.4. North America
      1. 8.4.1. North America Legal Marijuana Market, 2016 – 2026 (USD Billion)
        1. 8.4.1.1. North America Legal Marijuana Market, by Country, 2016 – 2026 (USD Billion)
      2. 8.4.2. North America Market, 2016 – 2026 (Kilo Tons)
        1. 8.4.2.1. North America Legal Marijuana Market, by Country, 2016 – 2026 (Kilo Tons)
      3. 8.4.3. North America Legal Marijuana Market, by Product Type, 2016 – 2026
        1. 8.4.3.1. North America Legal Marijuana Market, by Product Type, 2016 – 2026 (USD Billion)
        2. 8.4.3.2. North America Legal Marijuana Market, by Product Type, 2016 – 2026 (Kilo Tons)
      4. 8.4.4. North America Legal Marijuana Market, by Species, 2016 – 2026
        1. 8.4.4.1. North America Legal Marijuana Market, by Species, 2016 – 2026 (USD Billion)
        2. 8.4.4.2. North America Legal Marijuana Market, by Species, 2016 – 2026 (Kilo Tons)
      5. 8.4.5. North America Legal Marijuana Market, by Strain, 2016 – 2026
        1. 8.4.5.1. North America Legal Marijuana Market, by Strain, 2016 – 2026 (USD Billion)
        2. 8.4.5.2. North America Legal Marijuana Market, by Strain, 2016 – 2026 (Kilo Tons)
      6. 8.4.6. North America Legal Marijuana Market, by Purchase Channel, 2016 – 2026
        1. 8.4.6.1. North America Legal Marijuana Market, by Purchase Channel, 2016 – 2026 (USD Billion)
        2. 8.4.6.2. North America Legal Marijuana Market, by Purchase Channel, 2016 – 2026 (Kilo Tons)
      7. 8.4.7. North America Legal Marijuana Market, by Application, 2016 – 2026
        1. 8.4.7.1. North America Legal Marijuana Market, by Application, 2016 – 2026 (USD Billion)
        2. 8.4.7.2. North America Legal Marijuana Market, by Application, 2016 – 2026 (Kilo Tons)
      8. 8.4.8. North America Legal Marijuana Market, by End-User, 2016 – 2026
        1. 8.4.8.1. North America Legal Marijuana Market, by End-User, 2016 – 2026 (USD Billion)
        2. 8.4.8.2. North America Legal Marijuana Market, by End-User, 2016 – 2026 (Kilo Tons)
      9. 8.4.9. U.S.
        1. 8.4.9.1. U.S. Legal Marijuana Market, 2016 – 2026 (USD Billion)
        2. 8.4.9.2. U.S. Legal Marijuana Market, 2016 – 2026 (Kilo Tons)
      10. 8.4.10. Canada
        1. 8.4.10.1. Canada Legal Marijuana Market, 2016 – 2026 (USD Billion)
        2. 8.4.10.2. Canada Legal Marijuana Market, 2016 – 2026 (Kilo Tons)
    5. 8.5. Europe
      1. 8.5.1. Europe Legal Marijuana Market, 2016 – 2026 (USD Billion)
        1. 8.5.1.1. Europe Legal Marijuana Market, by Country, 2016 – 2026 (USD Billion)
      2. 8.5.2. Europe Market, 2016 – 2026 (Kilo Tons)
        1. 8.5.2.1. Europe Legal Marijuana Market, by Country, 2016 – 2026 (Kilo Tons)
      3. 8.5.3. Europe Legal Marijuana Market, by Product Type, 2016 – 2026
        1. 8.5.3.1. Europe Legal Marijuana Market, by Product Type, 2016 – 2026 (USD Billion)
        2. 8.5.3.2. Europe Legal Marijuana Market, by Product Type, 2016 – 2026 (Kilo Tons)
      4. 8.5.4. Europe Legal Marijuana Market, by Species, 2016 – 2026
        1. 8.5.4.1. Europe Legal Marijuana Market, by Species, 2016 – 2026 (USD Billion)
        2. 8.5.4.2. Europe Legal Marijuana Market, by Species, 2016 – 2026 (Kilo Tons)
      5. 8.5.5. Europe Legal Marijuana Market, by Strain, 2016 – 2026
        1. 8.5.5.1. Europe Legal Marijuana Market, by Strain, 2016 – 2026 (USD Billion)
        2. 8.5.5.2. Europe Legal Marijuana Market, by Strain, 2016 – 2026 (Kilo Tons)
      6. 8.5.6. Europe Legal Marijuana Market, by Purchase Channel, 2016 – 2026
        1. 8.5.6.1. Europe Legal Marijuana Market, by Purchase Channel, 2016 – 2026 (USD Billion)
        2. 8.5.6.2. Europe Legal Marijuana Market, by Purchase Channel, 2016 – 2026 (Kilo Tons)
      7. 8.5.7. Europe Legal Marijuana Market, by Application, 2016 – 2026
        1. 8.5.7.1. Europe Legal Marijuana Market, by Application, 2016 – 2026 (USD Billion)
        2. 8.5.7.2. Europe Legal Marijuana Market, by Application, 2016 – 2026 (Kilo Tons)
      8. 8.5.8. Europe Legal Marijuana Market, by End-User, 2016 – 2026
        1. 8.5.8.1. Europe Legal Marijuana Market, by End-User, 2016 – 2026 (USD Billion)
        2. 8.5.8.2. Europe Legal Marijuana Market, by End-User, 2016 – 2026 (Kilo Tons)
      9. 8.5.9. Germany
        1. 8.5.9.1. Germany Legal Marijuana Market, 2016 – 2026 (USD Billion)
        2. 8.5.9.2. Germany Legal Marijuana Market, 2016 – 2026 (Kilo Tons)
      10. 8.5.10. France
        1. 8.5.10.1. France Legal Marijuana Market, 2016 – 2026 (USD Billion)
        2. 8.5.10.2. France Legal Marijuana Market, 2016 – 2026 (Kilo Tons)
      11. 8.5.11. U.K.
        1. 8.5.11.1. U.K. Legal Marijuana Market, 2016 – 2026 (USD Billion)
        2. 8.5.11.2. U.K. Legal Marijuana Market, 2016 – 2026 (Kilo Tons)
      12. 8.5.12. Italy
        1. 8.5.12.1. Italy Legal Marijuana Market, 2016 – 2026 (USD Billion)
        2. 8.5.12.2. Italy Legal Marijuana Market, 2016 – 2026 (Kilo Tons)
      13. 8.5.13. Spain
        1. 8.5.13.1. Spain Legal Marijuana Market, 2016 – 2026 (USD Billion)
        2. 8.5.13.2. Spain Legal Marijuana Market, 2016 – 2026 (Kilo Tons)
      14. 8.5.14. Rest of Europe
        1. 8.5.14.1. Rest of Europe Legal Marijuana Market, 2016 – 2026 (USD Billion)
        2. 8.5.14.2. Rest of Europe Legal Marijuana Market, 2016 – 2026 (Kilo Tons)
    6. 8.6. Asia Pacific
      1. 8.6.1. Asia Pacific Legal Marijuana Market, 2016 – 2026 (USD Billion)
        1. 8.6.1.1. Asia Pacific Legal Marijuana Market, by Country, 2016 – 2026 (USD Billion)
      2. 8.6.2. Asia Pacific Market, 2016 – 2026 (Kilo Tons)
        1. 8.6.2.1. Asia Pacific Legal Marijuana Market, by Country, 2016 – 2026 (Kilo Tons)
      3. 8.6.3. Asia Pacific Legal Marijuana Market, by Product Type, 2016 – 2026
        1. 8.6.3.1. Asia Pacific Legal Marijuana Market, by Product Type, 2016 – 2026 (USD Billion)
        2. 8.6.3.2. Asia Pacific Legal Marijuana Market, by Product Type, 2016 – 2026 (Kilo Tons)
      4. 8.6.4. Asia Pacific Legal Marijuana Market, by Species, 2016 – 2026
        1. 8.6.4.1. Asia Pacific Legal Marijuana Market, by Species, 2016 – 2026 (USD Billion)
        2. 8.6.4.2. Asia Pacific Legal Marijuana Market, by Species, 2016 – 2026 (Kilo Tons)
      5. 8.6.5. Asia Pacific Legal Marijuana Market, by Strain, 2016 – 2026
        1. 8.6.5.1. Asia Pacific Legal Marijuana Market, by Strain, 2016 – 2026 (USD Billion)
        2. 8.6.5.2. Asia Pacific Legal Marijuana Market, by Strain, 2016 – 2026 (Kilo Tons)
      6. 8.6.6. Asia Pacific Legal Marijuana Market, by Purchase Channel, 2016 – 2026
        1. 8.6.6.1. Asia Pacific Legal Marijuana Market, by Purchase Channel, 2016 – 2026 (USD Billion)
        2. 8.6.6.2. Asia Pacific Legal Marijuana Market, by Purchase Channel, 2016 – 2026 (Kilo Tons)
      7. 8.6.7. Asia Pacific Legal Marijuana Market, by Application, 2016 – 2026
        1. 8.6.7.1. Asia Pacific Legal Marijuana Market, by Application, 2016 – 2026 (USD Billion)
        2. 8.6.7.2. Asia Pacific Legal Marijuana Market, by Application, 2016 – 2026 (Kilo Tons)
      8. 8.6.8. Asia Pacific Legal Marijuana Market, by End-User, 2016 – 2026
        1. 8.6.8.1. Asia Pacific Legal Marijuana Market, by End-User, 2016 – 2026 (USD Billion)
        2. 8.6.8.2. Asia Pacific Legal Marijuana Market, by End-User, 2016 – 2026 (Kilo Tons)
      9. 8.6.9. China
        1. 8.6.9.1. China Legal Marijuana Market, 2016 – 2026 (USD Billion)
        2. 8.6.9.2. China Legal Marijuana Market, 2016 – 2026 (Kilo Tons)
      10. 8.6.10. Japan
        1. 8.6.10.1. Japan Legal Marijuana Market, 2016 – 2026 (USD Billion)
        2. 8.6.10.2. Japan Legal Marijuana Market, 2016 – 2026 (Kilo Tons)
      11. 8.6.11. India
        1. 8.6.11.1. India Legal Marijuana Market, 2016 – 2026 (USD Billion)
        2. 8.6.11.2. India Legal Marijuana Market, 2016 – 2026 (Kilo Tons)
      12. 8.6.12. South Korea
        1. 8.6.12.1. South Korea Legal Marijuana Market, 2016 – 2026 (USD Billion)
        2. 8.6.12.2. South Korea Legal Marijuana Market, 2016 – 2026 (Kilo Tons)
      13. 8.6.13. South-East Asia
        1. 8.6.13.1. South-East Asia Legal Marijuana Market, 2016 – 2026 (USD Billion)
        2. 8.6.13.2. South-East Asia Legal Marijuana Market, 2016 – 2026 (Kilo Tons)
      14. 8.6.14. Rest of Asia Pacific
        1. 8.6.14.1. Rest of Asia Pacific Legal Marijuana Market, 2016 – 2026 (USD Billion)
        2. 8.6.14.2. Rest of Asia Pacific Legal Marijuana Market, 2016 – 2026 (Kilo Tons)
    7. 8.7. Latin America
      1. 8.7.1. Latin America Legal Marijuana Market, 2016 – 2026 (USD Billion)
        1. 8.7.1.1. Latin America Legal Marijuana Market, by Country, 2016 – 2026 (USD Billion)
      2. 8.7.2. Latin America Market, 2016 – 2026 (Kilo Tons)
        1. 8.7.2.1. Latin America Legal Marijuana Market, by Country, 2016 – 2026 (Kilo Tons)
      3. 8.7.3. Latin America Legal Marijuana Market, by Product Type, 2016 – 2026
        1. 8.7.3.1. Latin America Legal Marijuana Market, by Product Type, 2016 – 2026 (USD Billion)
        2. 8.7.3.2. Latin America Legal Marijuana Market, by Product Type, 2016 – 2026 (Kilo Tons)
      4. 8.7.4. Latin America Legal Marijuana Market, by Species, 2016 – 2026
        1. 8.7.4.1. Latin America Legal Marijuana Market, by Species, 2016 – 2026 (USD Billion)
        2. 8.7.4.2. Latin America Legal Marijuana Market, by Species, 2016 – 2026 (Kilo Tons)
      5. 8.7.5. Latin America Legal Marijuana Market, by Strain, 2016 – 2026
        1. 8.7.5.1. Latin America Legal Marijuana Market, by Strain, 2016 – 2026 (USD Billion)
        2. 8.7.5.2. Latin America Legal Marijuana Market, by Strain, 2016 – 2026 (Kilo Tons)
      6. 8.7.6. Latin America Legal Marijuana Market, by Purchase Channel, 2016 – 2026
        1. 8.7.6.1. Latin America Legal Marijuana Market, by Purchase Channel, 2016 – 2026 (USD Billion)
        2. 8.7.6.2. Latin America Legal Marijuana Market, by Purchase Channel, 2016 – 2026 (Kilo Tons)
      7. 8.7.7. Latin America Legal Marijuana Market, by Application, 2016 – 2026
        1. 8.7.7.1. Latin America Legal Marijuana Market, by Application, 2016 – 2026 (USD Billion)
        2. 8.7.7.2. Latin America Legal Marijuana Market, by Application, 2016 – 2026 (Kilo Tons)
      8. 8.7.8. Latin America Legal Marijuana Market, by End-User, 2016 – 2026
        1. 8.7.8.1. Latin America Legal Marijuana Market, by End-User, 2016 – 2026 (USD Billion)
        2. 8.7.8.2. Latin America Legal Marijuana Market, by End-User, 2016 – 2026 (Kilo Tons)
      9. 8.7.9. Brazil
        1. 8.7.9.1. Brazil Legal Marijuana Market, 2016 – 2026 (USD Billion)
        2. 8.7.9.2. Brazil Legal Marijuana Market, 2016 – 2026 (Kilo Tons)
      10. 8.7.10. Mexico
        1. 8.7.10.1. Mexico Legal Marijuana Market, 2016 – 2026 (USD Billion)
        2. 8.7.10.2. Mexico Legal Marijuana Market, 2016 – 2026 (Kilo Tons)
      11. 8.7.11. Rest of Latin America
        1. 8.7.11.1. Rest of Latin America Legal Marijuana Market, 2016 – 2026 (USD Billion)
        2. 8.7.11.2. Rest of Latin America Legal Marijuana Market, 2016 – 2026 (Kilo Tons)
    8. 8.8. The Middle-East and Africa
      1. 8.8.1. The Middle-East and Africa Legal Marijuana Market, 2016 – 2026 (USD Billion)
        1. 8.8.1.1. The Middle-East and Africa Legal Marijuana Market, by Country, 2016 – 2026 (USD Billion)
      2. 8.8.2. The Middle-East and Africa Market, 2016 – 2026 (Kilo Tons)
        1. 8.8.2.1. The Middle-East and Africa Legal Marijuana Market, by Country, 2016 – 2026 (Kilo Tons)
      3. 8.8.3. The Middle-East and Africa Legal Marijuana Market, by Product Type, 2016 – 2026
        1. 8.8.3.1. The Middle-East and Africa Legal Marijuana Market, by Product Type, 2016 – 2026 (USD Billion)
        2. 8.8.3.2. The Middle-East and Africa Legal Marijuana Market, by Product Type, 2016 – 2026 (Kilo Tons)
      4. 8.8.4. The Middle-East and Africa Legal Marijuana Market, by Species, 2016 – 2026
        1. 8.8.4.1. The Middle-East and Africa Legal Marijuana Market, by Species, 2016 – 2026 (USD Billion)
        2. 8.8.4.2. The Middle-East and Africa Legal Marijuana Market, by Species, 2016 – 2026 (Kilo Tons)
      5. 8.8.5. The Middle-East and Africa Legal Marijuana Market, by Strain, 2016 – 2026
        1. 8.8.5.1. The Middle-East and Africa Legal Marijuana Market, by Strain, 2016 – 2026 (USD Billion)
        2. 8.8.5.2. The Middle-East and Africa Legal Marijuana Market, by Strain, 2016 – 2026 (Kilo Tons)
      6. 8.8.6. The Middle-East and Africa Legal Marijuana Market, by Purchase Channel, 2016 – 2026
        1. 8.8.6.1. The Middle-East and Africa Legal Marijuana Market, by Purchase Channel, 2016 – 2026 (USD Billion)
        2. 8.8.6.2. The Middle-East and Africa Legal Marijuana Market, by Purchase Channel, 2016 – 2026 (Kilo Tons)
      7. 8.8.7. The Middle-East and Africa Legal Marijuana Market, by Application, 2016 – 2026
        1. 8.8.7.1. The Middle-East and Africa Legal Marijuana Market, by Application, 2016 – 2026 (USD Billion)
        2. 8.8.7.2. The Middle-East and Africa Legal Marijuana Market, by Application, 2016 – 2026 (Kilo Tons)
      8. 8.8.8. The Middle-East and Africa Legal Marijuana Market, by End-User, 2016 – 2026
        1. 8.8.8.1. The Middle-East and Africa Legal Marijuana Market, by End-User, 2016 – 2026 (USD Billion)
        2. 8.8.8.2. The Middle-East and Africa Legal Marijuana Market, by End-User, 2016 – 2026 (Kilo Tons)
      9. 8.8.9. GCC Countries
        1. 8.8.9.1. GCC Countries Legal Marijuana Market, 2016 – 2026 (USD Billion)
        2. 8.8.9.2. GCC Countries Legal Marijuana Market, 2016 – 2026 (Kilo Tons)
      10. 8.8.10. South Africa
        1. 8.8.10.1. South Africa Legal Marijuana Market, 2016 – 2026 (USD Billion)
        2. 8.8.10.2. South Africa Legal Marijuana Market, 2016 – 2026 (Kilo Tons)
      11. 8.8.11. Rest of Middle-East Africa
        1. 8.8.11.1. Rest of Middle-East Africa Legal Marijuana Market, 2016 – 2026 (USD Billion)
        2. 8.8.11.2. Rest of Middle-East Africa Legal Marijuana Market, 2016 – 2026 (Kilo Tons)
  9. Chapter 9 Legal Marijuana Production, Consumption, Export, Import by Regions
    1. 9.1. Global Legal Marijuana Production and Consumption, 2016 – 2026 (Kilo Tons)
    2. 9.2. Global Import and Export Analysis, by Region
  10. Chapter 10 Legal Marijuana Market – Competitive Landscape
    1. 10.1. Competitor Market Share – Revenue
    2. 10.2. Market Concentration Rate Analysis, Top 3 and Top 5 Players
    3. 10.3. Competitor Market Share – Volume
    4. 10.4. Strategic Developments
      1. 10.4.1. Acquisitions and Mergers
      2. 10.4.2. New Products
      3. 10.4.3. Research & Development Activities
  11. Chapter 11 Company Profiles
    1. 11.1. Canopy Growth Corporation
      1. 11.1.1. Company Overview
      2. 11.1.2. Product/Service Portfolio
      3. 11.1.3. Canopy Growth Corporation Sales, Revenue, Price, and Gross Margin
      4. 11.1.4. Canopy Growth Corporation Revenue and Growth Rate
      5. 11.1.5. Canopy Growth Corporation Market Share
      6. 11.1.6. Recent Initiatives, Funding/VC Activities, and Technological Innovations
    2. 11.2. Aphria, Inc.
      1. 11.2.1. Company Overview
      2. 11.2.2. Product/Service Portfolio
      3. 11.2.3. Aphria, Inc. Sales, Revenue, Price, and Gross Margin
      4. 11.2.4. Aphria, Inc. Revenue and Growth Rate
      5. 11.2.5. Aphria, Inc. Market Share
      6. 11.2.6. Recent Initiatives, Funding/VC Activities, and Technological Innovations
    3. 11.3. Aurora marijuana Inc.
      1. 11.3.1. Company Overview
      2. 11.3.2. Product/Service Portfolio
      3. 11.3.3. Aurora marijuana Inc. Sales, Revenue, Price, and Gross Margin
      4. 11.3.4. Aurora marijuana Inc. Revenue and Growth Rate
      5. 11.3.5. Aurora marijuana Inc. Market Share
      6. 11.3.6. Recent Initiatives, Funding/VC Activities, and Technological Innovations
    4. 11.4. Maricann Group, Inc.
      1. 11.4.1. Company Overview
      2. 11.4.2. Product/Service Portfolio
      3. 11.4.3. Maricann Group, Inc. Sales, Revenue, Price, and Gross Margin
      4. 11.4.4. Maricann Group, Inc. Revenue and Growth Rate
      5. 11.4.5. Maricann Group, Inc. Market Share
      6. 11.4.6. Recent Initiatives, Funding/VC Activities, and Technological Innovations
    5. 11.5. Tilray, Inc.
      1. 11.5.1. Company Overview
      2. 11.5.2. Product/Service Portfolio
      3. 11.5.3. Tilray, Inc. Sales, Revenue, Price, and Gross Margin
      4. 11.5.4. Tilray, Inc. Revenue and Growth Rate
      5. 11.5.5. Tilray, Inc. Market Share
      6. 11.5.6. Recent Initiatives, Funding/VC Activities, and Technological Innovations
    6. 11.6. Cronos Group Inc.
      1. 11.6.1. Company Overview
      2. 11.6.2. Product/Service Portfolio
      3. 11.6.3. Cronos Group Inc. Sales, Revenue, Price, and Gross Margin
      4. 11.6.4. Cronos Group Inc. Revenue and Growth Rate
      5. 11.6.5. Cronos Group Inc. Market Share
      6. 11.6.6. Recent Initiatives, Funding/VC Activities, and Technological Innovations
    7. 11.7. OrganiGram Holding Inc.
      1. 11.7.1. Company Overview
      2. 11.7.2. Product/Service Portfolio
      3. 11.7.3. OrganiGram Holding Inc. Sales, Revenue, Price, and Gross Margin
      4. 11.7.4. OrganiGram Holding Inc. Revenue and Growth Rate
      5. 11.7.5. OrganiGram Holding Inc. Market Share
      6. 11.7.6. Recent Initiatives, Funding/VC Activities, and Technological Innovations
    8. 11.8. VIVO marijuana Inc.
      1. 11.8.1. Company Overview
      2. 11.8.2. Product/Service Portfolio
      3. 11.8.3. VIVO marijuana Inc. Sales, Revenue, Price, and Gross Margin
      4. 11.8.4. VIVO marijuana Inc. Revenue and Growth Rate
      5. 11.8.5. VIVO marijuana Inc. Market Share
      6. 11.8.6. Recent Initiatives, Funding/VC Activities, and Technological Innovations
    9. 11.9. Tikun Olam Ltd.
      1. 11.9.1. Company Overview
      2. 11.9.2. Product/Service Portfolio
      3. 11.9.3. Tikun Olam Ltd. Sales, Revenue, Price, and Gross Margin
      4. 11.9.4. Tikun Olam Ltd. Revenue and Growth Rate
      5. 11.9.5. Tikun Olam Ltd. Market Share
      6. 11.9.6. Recent Initiatives, Funding/VC Activities, and Technological Innovations
    10. 11.10. The Green Organic Dutchman Holdings Ltd.
      1. 11.10.1. Company Overview
      2. 11.10.2. Product/Service Portfolio
      3. 11.10.3. The Green Organic Dutchman Holdings Ltd. Sales, Revenue, Price, and Gross Margin
      4. 11.10.4. The Green Organic Dutchman Holdings Ltd. Revenue and Growth Rate
      5. 11.10.5. The Green Organic Dutchman Holdings Ltd. Market Share
      6. 11.10.6. Recent Initiatives, Funding/VC Activities, and Technological Innovations
    11. 11.11. Terra Tech Corp.
      1. 11.11.1. Company Overview
      2. 11.11.2. Product/Service Portfolio
      3. 11.11.3. Terra Tech Corp. Sales, Revenue, Price, and Gross Margin
      4. 11.11.4. Terra Tech Corp. Revenue and Growth Rate
      5. 11.11.5. Terra Tech Corp. Market Share
      6. 11.11.6. Recent Initiatives, Funding/VC Activities, and Technological Innovations
    12. 11.12. Medical Cannabis, Inc.
      1. 11.12.1. Company Overview
      2. 11.12.2. Product/Service Portfolio
      3. 11.12.3. Medical Cannabis, Inc. Sales, Revenue, Price, and Gross Margin
      4. 11.12.4. Medical Cannabis, Inc. Revenue and Growth Rate
      5. 11.12.5. Medical Cannabis, Inc. Market Share
      6. 11.12.6. Recent Initiatives, Funding/VC Activities, and Technological Innovations
    13. 11.13. Stenocare A/S
      1. 11.13.1. Company Overview
      2. 11.13.2. Product/Service Portfolio
      3. 11.13.3. Stenocare A/S Sales, Revenue, Price, and Gross Margin
      4. 11.13.4. Stenocare A/S Revenue and Growth Rate
      5. 11.13.5. Stenocare A/S Market Share
      6. 11.13.6. Recent Initiatives, Funding/VC Activities, and Technological Innovations
    14. 11.14. Cannabis Science, Inc.
      1. 11.14.1. Company Overview
      2. 11.14.2. Product/Service Portfolio
      3. 11.14.3. Cannabis Science, Inc. Sales, Revenue, Price, and Gross Margin
      4. 11.14.4. Cannabis Science, Inc. Revenue and Growth Rate
      5. 11.14.5. Cannabis Science, Inc. Market Share
      6. 11.14.6. Recent Initiatives, Funding/VC Activities, and Technological Innovations
    15. 11.15. HEXO Corp.
      1. 11.15.1. Company Overview
      2. 11.15.2. Product/Service Portfolio
      3. 11.15.3. HEXO Corp. Sales, Revenue, Price, and Gross Margin
      4. 11.15.4. HEXO Corp. Revenue and Growth Rate
      5. 11.15.5. HEXO Corp. Market Share
      6. 11.15.6. Recent Initiatives, Funding/VC Activities, and Technological Innovations
  12. Chapter 12 Legal Marijuana — Industry Analysis
    1. 12.1. Introduction and Taxonomy
    2. 12.2. Legal Marijuana Market – Key Trends
      1. 12.2.1. Market Drivers
      2. 12.2.2. Market Restraints
      3. 12.2.3. Market Opportunities
    3. 12.3. Value Chain Analysis
    4. 12.4. Key Mandates and Regulations
    5. 12.5. Technology Roadmap and Timeline
    6. 12.6. Legal Marijuana Market – Attractiveness Analysis
      1. 12.6.1. By Product Type
      2. 12.6.2. By Species
      3. 12.6.3. By Strain
      4. 12.6.4. By Purchase Channel
      5. 12.6.5. By Application
      6. 12.6.6. By End-User
      7. 12.6.7. By Region
  13. Chapter 13 Raw Material Analysis
    1. 13.1. Legal Marijuana Key Raw Material Analysis
      1. 13.1.1. Key Raw Materials
      2. 13.1.2. Price Trend of Key Raw Materials
    2. 13.2. Key Suppliers of Raw Materials
    3. 13.3. Proportion of Manufacturing Cost Structure
      1. 13.3.1. Raw Materials Cost
      2. 13.3.2. Labor Cost
      3. 13.3.3. Manufacturing Expenses
      4. 13.3.4. Miscellaneous Expenses
    4. 13.4. Manufacturing Cost Analysis of Legal Marijuana
  14. Chapter 14 Industrial Chain, Sourcing Strategy, and Downstream Buyers
    1. 14.1. Legal Marijuana Industrial Chain Analysis
    2. 14.2. Upstream Raw Materials Sourcing
      1. 14.2.1. Risk Mitigation:
      2. 14.2.2. Supplier Relationships:
      3. 14.2.3. Business Processes:
      4. 14.2.4. Securing the Product:
    3. 14.3. Raw Materials Sources of Legal Marijuana Major Manufacturers
    4. 14.4. Downstream Buyers
    5. 14.5. Distributors/Traders List
  15. Chapter 15 Marketing Strategy Analysis, Distributors
    1. 15.1. Marketing Channel
    2. 15.2. Direct Marketing
    3. 15.3. Indirect Marketing
    4. 15.4. Marketing Channel Development Trends
    5. 15.5. Economic/Political Environmental Change
  16. Chapter 16 Report Conclusion & Key Insights
    1. 16.1. Key Insights from Primary Interviews & Surveys Respondents
    2. 16.2. Key Takeaways from Analysts, Consultants, and Industry Leaders
  17. Chapter 17 Research Approach & Methodology
    1. 17.1. Report Description
    2. 17.2. Research Scope
    3. 17.3. Research Methodology
      1. 17.3.1. Secondary Research
      2. 17.3.2. Primary Research
      3. 17.3.3. Statistical Models
        1. 17.3.3.1. Company Share Analysis Model
        2. 17.3.3.2. Revenue Based Modeling
      4. 17.3.4. Research Limitations

      List of Figures

      Fig.1	Product Picture of Legal Marijuana
      Fig.2	Global Legal Marijuana Market, 2016 – 2026 (USD Billion)
      Fig.3	Global Legal Marijuana Market, 2016 – 2026 (Kilo Tons)
      Fig.4	Global Legal Marijuana Market Absolute Revenue Opportunity, 2016 – 2026 (USD Billion)
      Fig.5	Global Legal Marijuana Market Incremental Revenue Opportunity, 2020 – 2026 (USD Billion)
      Fig.6	Global Legal Marijuana Market Share, by Product Type, 2020 & 2026 (USD Billion)
      Fig.7	Global Legal Marijuana Market Share, by Product Type, 2020 & 2026 (Kilo Tons)
      Fig.8	Global Buds / marijuana Flower Legal Marijuana Market, 2016 – 2026 (USD Billion)
      Fig.9	Global Buds / marijuana Flower Legal Marijuana Market, 2016 – 2026 (Kilo Tons)
      Fig.10	Global Cannabis Extracts Legal Marijuana Market, 2016 – 2026 (USD Billion)
      Fig.11	Global Cannabis Extracts Legal Marijuana Market, 2016 – 2026 (Kilo Tons)
      Fig.12	Global Others Legal Marijuana Market, 2016 – 2026 (USD Billion)
      Fig.13	Global Others Legal Marijuana Market, 2016 – 2026 (Kilo Tons)
      Fig.14	Global Legal Marijuana Market Share, by Species, 2020 & 2026 (USD Billion)
      Fig.15	Global Legal Marijuana Market Share, by Species, 2020 & 2026 (Kilo Tons)
      Fig.16	Global Cannabis Indica Legal Marijuana Market, 2016 – 2026 (USD Billion)
      Fig.17	Global Cannabis Indica Legal Marijuana Market, 2016 – 2026 (Kilo Tons)
      Fig.18	Global Cannabis Sativa Legal Marijuana Market, 2016 – 2026 (USD Billion)
      Fig.19	Global Cannabis Sativa Legal Marijuana Market, 2016 – 2026 (Kilo Tons)
      Fig.20	Global Cannabis Hybrid Legal Marijuana Market, 2016 – 2026 (USD Billion)
      Fig.21	Global Cannabis Hybrid Legal Marijuana Market, 2016 – 2026 (Kilo Tons)
      Fig.22	Global Legal Marijuana Market Share, by Strain, 2020 & 2026 (USD Billion)
      Fig.23	Global Legal Marijuana Market Share, by Strain, 2020 & 2026 (Kilo Tons)
      Fig.24	Global THC-dominant Legal Marijuana Market, 2016 – 2026 (USD Billion)
      Fig.25	Global THC-dominant Legal Marijuana Market, 2016 – 2026 (Kilo Tons)
      Fig.26	Global CBD-dominant Legal Marijuana Market, 2016 – 2026 (USD Billion)
      Fig.27	Global CBD-dominant Legal Marijuana Market, 2016 – 2026 (Kilo Tons)
      Fig.28	Global Balanced THC and CBD Legal Marijuana Market, 2016 – 2026 (USD Billion)
      Fig.29	Global Balanced THC and CBD Legal Marijuana Market, 2016 – 2026 (Kilo Tons)
      Fig.30	Global Legal Marijuana Market Share, by Purchase Channel, 2020 & 2026 (USD Billion)
      Fig.31	Global Legal Marijuana Market Share, by Purchase Channel, 2020 & 2026 (Kilo Tons)
      Fig.32	Global Online Legal Marijuana Market, 2016 – 2026 (USD Billion)
      Fig.33	Global Online Legal Marijuana Market, 2016 – 2026 (Kilo Tons)
      Fig.34	Global Offline Legal Marijuana Market, 2016 – 2026 (USD Billion)
      Fig.35	Global Offline Legal Marijuana Market, 2016 – 2026 (Kilo Tons)
      Fig.36	Global Legal Marijuana Market Share, by Application, 2020 & 2026 (USD Billion)
      Fig.37	Global Legal Marijuana Market Share, by Application, 2020 & 2026 (Kilo Tons)
      Fig.38	Global Medical Legal Marijuana Market, 2016 – 2026 (USD Billion)
      Fig.39	Global Medical Legal Marijuana Market, 2016 – 2026 (Kilo Tons)
      Fig.40	Global Recreational Legal Marijuana Market, 2016 – 2026 (USD Billion)
      Fig.41	Global Recreational Legal Marijuana Market, 2016 – 2026 (Kilo Tons)
      Fig.42	Global Cosmetics Legal Marijuana Market, 2016 – 2026 (USD Billion)
      Fig.43	Global Cosmetics Legal Marijuana Market, 2016 – 2026 (Kilo Tons)
      Fig.44	Global Others Legal Marijuana Market, 2016 – 2026 (USD Billion)
      Fig.45	Global Others Legal Marijuana Market, 2016 – 2026 (Kilo Tons)
      Fig.46	Global Legal Marijuana Market Share, by End-User, 2020 & 2026 (USD Billion)
      Fig.47	Global Legal Marijuana Market Share, by End-User, 2020 & 2026 (Kilo Tons)
      Fig.48	Global Pharmaceutical Legal Marijuana Market, 2016 – 2026 (USD Billion)
      Fig.49	Global Pharmaceutical Legal Marijuana Market, 2016 – 2026 (Kilo Tons)
      Fig.50	Global Food, Beverages, and Tobacco Legal Marijuana Market, 2016 – 2026 (USD Billion)
      Fig.51	Global Food, Beverages, and Tobacco Legal Marijuana Market, 2016 – 2026 (Kilo Tons)
      Fig.52	Global Personal Care Legal Marijuana Market, 2016 – 2026 (USD Billion)
      Fig.53	Global Personal Care Legal Marijuana Market, 2016 – 2026 (Kilo Tons)
      Fig.54	Global Research and Development Centers Legal Marijuana Market, 2016 – 2026 (USD Billion)
      Fig.55	Global Research and Development Centers Legal Marijuana Market, 2016 – 2026 (Kilo Tons)
      Fig.56	Global Legal Marijuana Market Share, by Region, 2020 & 2026 (USD Billion)
      Fig.57	Global Legal Marijuana Market Share, by Region, 2020 & 2026 (Kilo Tons)
      Fig.58	North America Legal Marijuana Market, 2016 – 2026 (USD Billion)
      Fig.59	North America Legal Marijuana Market, 2016 – 2026 (Kilo Tons)
      Fig.60	U.S. Legal Marijuana Market, 2016 – 2026 (USD Billion)
      Fig.61	U.S. Legal Marijuana  Market, 2016 – 2026 (Kilo Tons)
      Fig.62	Canada Legal Marijuana Market, 2016 – 2026 (USD Billion)
      Fig.63	Canada Legal Marijuana  Market, 2016 – 2026 (Kilo Tons)
      Fig.64	Europe Legal Marijuana Market, 2016 – 2026 (USD Billion)
      Fig.65	Europe Legal Marijuana Market, 2016 – 2026 (Kilo Tons)
      Fig.66	Germany Legal Marijuana Market, 2016 – 2026 (USD Billion)
      Fig.67	Germany Legal Marijuana  Market, 2016 – 2026 (Kilo Tons)
      Fig.68	France Legal Marijuana Market, 2016 – 2026 (USD Billion)
      Fig.69	France Legal Marijuana  Market, 2016 – 2026 (Kilo Tons)
      Fig.70	U.K. Legal Marijuana Market, 2016 – 2026 (USD Billion)
      Fig.71	U.K. Legal Marijuana  Market, 2016 – 2026 (Kilo Tons)
      Fig.72	Italy Legal Marijuana Market, 2016 – 2026 (USD Billion)
      Fig.73	Italy Legal Marijuana  Market, 2016 – 2026 (Kilo Tons)
      Fig.74	Spain Legal Marijuana Market, 2016 – 2026 (USD Billion)
      Fig.75	Spain Legal Marijuana  Market, 2016 – 2026 (Kilo Tons)
      Fig.76	Rest of Europe Legal Marijuana Market, 2016 – 2026 (USD Billion)
      Fig.77	Rest of Europe Legal Marijuana  Market, 2016 – 2026 (Kilo Tons)
      Fig.78	Asia Pacific Legal Marijuana Market, 2016 – 2026 (USD Billion)
      Fig.79	Asia Pacific Legal Marijuana Market, 2016 – 2026 (Kilo Tons)
      Fig.80	China Legal Marijuana Market, 2016 – 2026 (USD Billion)
      Fig.81	China Legal Marijuana  Market, 2016 – 2026 (Kilo Tons)
      Fig.82	Japan Legal Marijuana Market, 2016 – 2026 (USD Billion)
      Fig.83	Japan Legal Marijuana  Market, 2016 – 2026 (Kilo Tons)
      Fig.84	India Legal Marijuana Market, 2016 – 2026 (USD Billion)
      Fig.85	India Legal Marijuana  Market, 2016 – 2026 (Kilo Tons)
      Fig.86	South  Korea Legal Marijuana Market, 2016 – 2026 (USD Billion)
      Fig.87	South  Korea Legal Marijuana  Market, 2016 – 2026 (Kilo Tons)
      Fig.88	South-East Asia Legal Marijuana Market, 2016 – 2026 (USD Billion)
      Fig.89	South-East Asia Legal Marijuana  Market, 2016 – 2026 (Kilo Tons)
      Fig.90	Rest of Asia Pacific Legal Marijuana Market, 2016 – 2026 (USD Billion)
      Fig.91	Rest of Asia Pacific Legal Marijuana  Market, 2016 – 2026 (Kilo Tons)
      Fig.92	Latin America Legal Marijuana Market, 2016 – 2026 (USD Billion)
      Fig.93	Latin America Legal Marijuana Market, 2016 – 2026 (Kilo Tons)
      Fig.94	Brazil Legal Marijuana Market, 2016 – 2026 (USD Billion)
      Fig.95	Brazil Legal Marijuana  Market, 2016 – 2026 (Kilo Tons)
      Fig.96	Mexico Legal Marijuana Market, 2016 – 2026 (USD Billion)
      Fig.97	Mexico Legal Marijuana  Market, 2016 – 2026 (Kilo Tons)
      Fig.98	Rest of Latin America Legal Marijuana Market, 2016 – 2026 (USD Billion)
      Fig.99	Rest of Latin America Legal Marijuana  Market, 2016 – 2026 (Kilo Tons)
      Fig.100	The Middle-East and Africa Legal Marijuana Market, 2016 – 2026 (USD Billion)
      Fig.101	The Middle-East and Africa Legal Marijuana Market, 2016 – 2026 (Kilo Tons)
      Fig.102	GCC Countries Legal Marijuana Market, 2016 – 2026 (USD Billion)
      Fig.103	GCC Countries Legal Marijuana  Market, 2016 – 2026 (Kilo Tons)
      Fig.104	South Africa Legal Marijuana Market, 2016 – 2026 (USD Billion)
      Fig.105	South Africa Legal Marijuana  Market, 2016 – 2026 (Kilo Tons)
      Fig.106	Rest of Middle-East Africa Legal Marijuana Market, 2016 – 2026 (USD Billion)
      Fig.107	Rest of Middle-East Africa Legal Marijuana  Market, 2016 – 2026 (Kilo Tons)
      Fig.108	Global Legal Marijuana Production and Consumption, 2016 – 2026 (Kilo Tons)
      Fig.109	North America Legal Marijuana Production and Consumption, 2016 – 2026 (USD Billion) (Kilo Tons)
      Fig.110	Europe Legal Marijuana Production and Consumption, 2016 – 2026 (USD Billion) (Kilo Tons)
      Fig.111	Asia Pacific Legal Marijuana Production and Consumption, 2016 – 2026 (USD Billion) (Kilo Tons)
      Fig.112	Latin America Legal Marijuana Production and Consumption, 2016 – 2026 (USD Billion) (Kilo Tons)
      Fig.113	The Middle-East and Africa Legal Marijuana Production and Consumption, 2016 – 2026 (USD Billion) (Kilo Tons)
      Fig.114	Competitor Market Share – Revenue
      Fig.115	Competitor Market Share – Volume
      Fig.116	Canopy Growth Corporation Revenue and Growth Rate
      Fig.117	Canopy Growth Corporation Market Share
      Fig.118	Aphria, Inc. Revenue and Growth Rate
      Fig.119	Aphria, Inc. Market Share
      Fig.120	Aurora marijuana Inc. Revenue and Growth Rate
      Fig.121	Aurora marijuana Inc. Market Share
      Fig.122	Maricann Group, Inc. Revenue and Growth Rate
      Fig.123	Maricann Group, Inc. Market Share
      Fig.124	Tilray, Inc. Revenue and Growth Rate
      Fig.125	Tilray, Inc. Market Share
      Fig.126	Cronos Group Inc. Revenue and Growth Rate
      Fig.127	Cronos Group Inc. Market Share
      Fig.128	OrganiGram Holding Inc. Revenue and Growth Rate
      Fig.129	OrganiGram Holding Inc. Market Share
      Fig.130	VIVO marijuana Inc. Revenue and Growth Rate
      Fig.131	VIVO marijuana Inc. Market Share
      Fig.132	Tikun Olam Ltd. Revenue and Growth Rate
      Fig.133	Tikun Olam Ltd. Market Share
      Fig.134	The Green Organic Dutchman Holdings Ltd. Revenue and Growth Rate
      Fig.135	The Green Organic Dutchman Holdings Ltd. Market Share
      Fig.136	Terra Tech Corp. Revenue and Growth Rate
      Fig.137	Terra Tech Corp. Market Share
      Fig.138	Medical Cannabis, Inc. Revenue and Growth Rate
      Fig.139	Medical Cannabis, Inc. Market Share
      Fig.140	Stenocare A/S Revenue and Growth Rate
      Fig.141	Stenocare A/S Market Share
      Fig.142	Cannabis Science, Inc. Revenue and Growth Rate
      Fig.143	Cannabis Science, Inc. Market Share
      Fig.144	HEXO Corp. Revenue and Growth Rate
      Fig.145	HEXO Corp. Market Share
      Fig.146	Market Dynamics
      Fig.147	Global Legal Marijuana – Value Chain Analysis
      Fig.148	Key Mandates and Regulations
      Fig.149	Technology Roadmap and Timeline
      Fig.150	Market Attractiveness Analysis – By Product Type
      Fig.151	Market Attractiveness Analysis – By Species
      Fig.152	Market Attractiveness Analysis – By Strain
      Fig.153	Market Attractiveness Analysis – By Purchase Channel
      Fig.154	Market Attractiveness Analysis – By Application
      Fig.155	Market Attractiveness Analysis – By End-User
      Fig.156	Market Attractiveness Analysis – By Region
      Fig.157	Manufacturing Cost Structure of Legal Marijuana
      Fig.158	Legal Marijuana Industrial Chain Analysis
      Fig.159	Market Channels
      Fig.160	Marketing Channel Development Trend
      Fig.161	Growth in World Gross Product, 2008-2018
      

      List of Tables

      Table 1	Global Legal Marijuana Market, 2020 & 2026 (USD Billion)
      Table 2	Global Legal Marijuana Market, by Product Type, 2016 – 2026 (USD Billion)
      Table 3	Global Legal Marijuana Market, by Product Type, 2016 – 2026 (Kilo Tons)
      Table 4	Global Legal Marijuana Market, by Species, 2016 – 2026 (USD Billion)
      Table 5	Global Legal Marijuana Market, by Species, 2016 – 2026 (Kilo Tons)
      Table 6	Global Legal Marijuana Market, by Strain, 2016 – 2026 (USD Billion)
      Table 7	Global Legal Marijuana Market, by Strain, 2016 – 2026 (Kilo Tons)
      Table 8	Global Legal Marijuana Market, by Purchase Channel, 2016 – 2026 (USD Billion)
      Table 9	Global Legal Marijuana Market, by Purchase Channel, 2016 – 2026 (Kilo Tons)
      Table 10 Global Legal Marijuana Market, by Application, 2016 – 2026 (USD Billion)
      Table 11 Global Legal Marijuana Market, by Application, 2016 – 2026 (Kilo Tons)
      Table 12 Global Legal Marijuana Market, by End-User, 2016 – 2026 (USD Billion)
      Table 13 Global Legal Marijuana Market, by End-User, 2016 – 2026 (Kilo Tons)
      Table 14 Global Legal Marijuana Market, by Region, 2016 – 2026 (USD Billion)
      Table 15 Global Legal Marijuana Market, by Region, 2016 – 2026 (Kilo Tons)
      Table 16 North America Legal Marijuana Market, by Country, 2016 – 2026 (USD Billion)
      Table 17 North America Legal Marijuana Market, by Country, 2016 – 2026 (Kilo Tons)
      Table 18 North America Legal Marijuana Market, by Product Type, 2016 – 2026 (USD Billion)
      Table 19 North America Legal Marijuana Market, by Product Type, 2016 – 2026 (Kilo Tons)
      Table 20 North America Legal Marijuana Market, by Species, 2016 – 2026 (USD Billion)
      Table 21 North America Legal Marijuana Market, by Species, 2016 – 2026 (Kilo Tons)
      Table 22 North America Legal Marijuana Market, by Strain, 2016 – 2026 (USD Billion)
      Table 23 North America Legal Marijuana Market, by Strain, 2016 – 2026 (Kilo Tons)
      Table 24 North America Legal Marijuana Market, by Purchase Channel, 2016 – 2026 (USD Billion)
      Table 25 North America Legal Marijuana Market, by Purchase Channel, 2016 – 2026 (Kilo Tons)
      Table 26 North America Legal Marijuana Market, by Application, 2016 – 2026 (USD Billion)
      Table 27 North America Legal Marijuana Market, by Application, 2016 – 2026 (Kilo Tons)
      Table 28 North America Legal Marijuana Market, by End-User, 2016 – 2026 (USD Billion)
      Table 29 North America Legal Marijuana Market, by End-User, 2016 – 2026 (Kilo Tons)
      Table 30 Europe Legal Marijuana Market, by Country, 2016 – 2026 (USD Billion)
      Table 31 Europe Legal Marijuana Market, by Country, 2016 – 2026 (Kilo Tons)
      Table 32 Europe Legal Marijuana Market, by Product Type, 2016 – 2026 (USD Billion)
      Table 33 Europe Legal Marijuana Market, by Product Type, 2016 – 2026 (Kilo Tons)
      Table 34 Europe Legal Marijuana Market, by Species, 2016 – 2026 (USD Billion)
      Table 35 Europe Legal Marijuana Market, by Species, 2016 – 2026 (Kilo Tons)
      Table 36 Europe Legal Marijuana Market, by Strain, 2016 – 2026 (USD Billion)
      Table 37 Europe Legal Marijuana Market, by Strain, 2016 – 2026 (Kilo Tons)
      Table 38 Europe Legal Marijuana Market, by Purchase Channel, 2016 – 2026 (USD Billion)
      Table 39 Europe Legal Marijuana Market, by Purchase Channel, 2016 – 2026 (Kilo Tons)
      Table 40 Europe Legal Marijuana Market, by Application, 2016 – 2026 (USD Billion)
      Table 41 Europe Legal Marijuana Market, by Application, 2016 – 2026 (Kilo Tons)
      Table 42 Europe Legal Marijuana Market, by End-User, 2016 – 2026 (USD Billion)
      Table 43 Europe Legal Marijuana Market, by End-User, 2016 – 2026 (Kilo Tons)
      Table 44 Asia Pacific Legal Marijuana Market, by Country, 2016 – 2026 (USD Billion)
      Table 45 Asia Pacific Legal Marijuana Market, by Country, 2016 – 2026 (Kilo Tons)
      Table 46 Asia Pacific Legal Marijuana Market, by Product Type, 2016 – 2026 (USD Billion)
      Table 47 Asia Pacific Legal Marijuana Market, by Product Type, 2016 – 2026 (Kilo Tons)
      Table 48 Asia Pacific Legal Marijuana Market, by Species, 2016 – 2026 (USD Billion)
      Table 49 Asia Pacific Legal Marijuana Market, by Species, 2016 – 2026 (Kilo Tons)
      Table 50 Asia Pacific Legal Marijuana Market, by Strain, 2016 – 2026 (USD Billion)
      Table 51 Asia Pacific Legal Marijuana Market, by Strain, 2016 – 2026 (Kilo Tons)
      Table 52 Asia Pacific Legal Marijuana Market, by Purchase Channel, 2016 – 2026 (USD Billion)
      Table 53 Asia Pacific Legal Marijuana Market, by Purchase Channel, 2016 – 2026 (Kilo Tons)
      Table 54 Asia Pacific Legal Marijuana Market, by Application, 2016 – 2026 (USD Billion)
      Table 55 Asia Pacific Legal Marijuana Market, by Application, 2016 – 2026 (Kilo Tons)
      Table 56 Asia Pacific Legal Marijuana Market, by End-User, 2016 – 2026 (USD Billion)
      Table 57 Asia Pacific Legal Marijuana Market, by End-User, 2016 – 2026 (Kilo Tons)
      Table 58 Latin America Legal Marijuana Market, by Country, 2016 – 2026 (USD Billion)
      Table 59 Latin America Legal Marijuana Market, by Country, 2016 – 2026 (Kilo Tons)
      Table 60 Latin America Legal Marijuana Market, by Product Type, 2016 – 2026 (USD Billion)
      Table 61 Latin America Legal Marijuana Market, by Product Type, 2016 – 2026 (Kilo Tons)
      Table 62 Latin America Legal Marijuana Market, by Species, 2016 – 2026 (USD Billion)
      Table 63 Latin America Legal Marijuana Market, by Species, 2016 – 2026 (Kilo Tons)
      Table 64 Latin America Legal Marijuana Market, by Strain, 2016 – 2026 (USD Billion)
      Table 65 Latin America Legal Marijuana Market, by Strain, 2016 – 2026 (Kilo Tons)
      Table 66 Latin America Legal Marijuana Market, by Purchase Channel, 2016 – 2026 (USD Billion)
      Table 67 Latin America Legal Marijuana Market, by Purchase Channel, 2016 – 2026 (Kilo Tons)
      Table 68 Latin America Legal Marijuana Market, by Application, 2016 – 2026 (USD Billion)
      Table 69 Latin America Legal Marijuana Market, by Application, 2016 – 2026 (Kilo Tons)
      Table 70 Latin America Legal Marijuana Market, by End-User, 2016 – 2026 (USD Billion)
      Table 71 Latin America Legal Marijuana Market, by End-User, 2016 – 2026 (Kilo Tons)
      Table 72 The Middle-East and Africa Legal Marijuana Market, by Country, 2016 – 2026 (USD Billion)
      Table 73 The Middle-East and Africa Legal Marijuana Market, by Country, 2016 – 2026 (Kilo Tons)
      Table 74 The Middle-East and Africa Legal Marijuana Market, by Product Type, 2016 – 2026 (USD Billion)
      Table 75 The Middle-East and Africa Legal Marijuana Market, by Product Type, 2016 – 2026 (Kilo Tons)
      Table 76 The Middle-East and Africa Legal Marijuana Market, by Species, 2016 – 2026 (USD Billion)
      Table 77 The Middle-East and Africa Legal Marijuana Market, by Species, 2016 – 2026 (Kilo Tons)
      Table 78 The Middle-East and Africa Legal Marijuana Market, by Strain, 2016 – 2026 (USD Billion)
      Table 79 The Middle-East and Africa Legal Marijuana Market, by Strain, 2016 – 2026 (Kilo Tons)
      Table 80 The Middle-East and Africa Legal Marijuana Market, by Purchase Channel, 2016 – 2026 (USD Billion)
      Table 81 The Middle-East and Africa Legal Marijuana Market, by Purchase Channel, 2016 – 2026 (Kilo Tons)
      Table 82 The Middle-East and Africa Legal Marijuana Market, by Application, 2016 – 2026 (USD Billion)
      Table 83 The Middle-East and Africa Legal Marijuana Market, by Application, 2016 – 2026 (Kilo Tons)
      Table 84 The Middle-East and Africa Legal Marijuana Market, by End-User, 2016 – 2026 (USD Billion)
      Table 85 The Middle-East and Africa Legal Marijuana Market, by End-User, 2016 – 2026 (Kilo Tons)
      Table 86 North America Legal Marijuana Production, Consumption, Export, Import, 2016 – 2020
      Table 87 Europe Legal Marijuana Production, Consumption, Export, Import, 2016 – 2020
      Table 88 Asia Pacific Legal Marijuana Production, Consumption, Export, Import, 2016 – 2020
      Table 89 Latin America Legal Marijuana Production, Consumption, Export, Import, 2016 – 2020
      Table 90 The Middle-East and Africa Legal Marijuana Production, Consumption, Export, Import, 2016 – 2020
      Table 91 Global Legal Marijuana Market - Company Revenue Analysis, 2016 – 2020 (USD Billion)
      Table 92 Global Legal Marijuana Market - Company Revenue Share Analysis, 2016 – 2020 (%)
      Table 93 Global Legal Marijuana Market - Company Volume Analysis, 2016 – 2020 (Kilo Tons)
      Table 94 Global Legal Marijuana Market - Company Volume Share Analysis, 2016 – 2020 (%)
      Table 95 Acquisitions and Mergers
      Table 96 Market Drivers – Impact Analysis
      Table 97 Market Restraints
      Table 98 Market Opportunities
      Table 99 Production Base and Market Concentration Rate of Raw Material
      Table 100 Key Suppliers of Raw Materials
      Table 101 Raw Materials Sources of Legal Marijuana Major Manufacturers
      Table 102 Major Buyers of Legal Marijuana
      Table 103 Distributors/Traders of Legal Marijuana by Region
      

Industry Major Market Players

  • Canopy Growth Corporation Aphria Inc.
  • Aurora marijuana Inc.
  • Maricann Group Inc.
  • Tilray Inc.
  • Cronos Group Inc.
  • OrganiGram Holding Inc.
  • VIVO marijuana Inc.
  • Tikun Olam Ltd.
  • The Green Organic Dutchman Holdings Ltd.
  • Terra Tech Corp.
  • Medical Cannabis Inc.
  • Stenocare A/S
  • Cannabis Science Inc.
  • HEXO Corp