Search Market Research Report

Discover Our Latest Reports
Discover Our Featured Reports
Discover Top Selling Reports

L-Arabinose Market Size, Share Global Analysis Report, 2020–2026

report img

L-Arabinose Market By Product Type (Phytoextraction, Chemical Synthesis) and By Application (Food & Beverages, Pharmaceuticals, Others): Global Industry Outlook, Market Size, Business Intelligence, Consumer Preferences, Statistical Surveys, Comprehensive Analysis, Historical Developments, Current Trends, and Forecast 2020–2026

Industry Insights

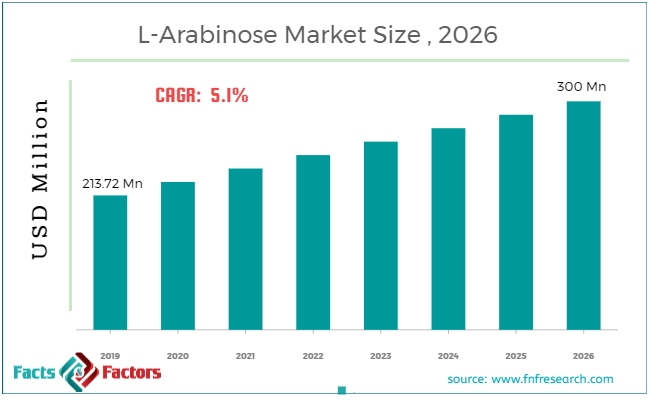
According to the report published by Facts & Factors, the global L-Arabinose Market size was worth around USD 213.72 million in 2019 and is predicted to grow around USD 300 million by 2026 with a compound annual growth rate (CAGR) of roughly 5.1% between 2020 and 2026. The report analyzes the global L-Arabinose Market drivers, restraints/challenges, and the effect they have on the demands during the projection period. In addition, the report explores emerging opportunities in the L-Arabinose Market.

L-Arabinose Market

To know more about this report | Request Free Sample Copy

This specialized and expertise oriented industry research report scrutinizes the technical and commercial business outlook of the L-Arabinose industry. The report analyzes and declares the historical and current trends analysis of the L-Arabinose industry and subsequently recommends the projected trends anticipated to be observed in the L-Arabinose market during the upcoming years.

The L-Arabinose market report analyzes and notifies the industry statistics at the global as well as regional and country levels in order to acquire a thorough perspective of the entire L-Arabinose market. The historical and past insights are provided for FY 2016 to FY 2019 whereas projected trends are delivered for FY 2020 to FY 2026. The quantitative and numerical data is represented in terms of value (USD Billion) and volume (Tons) from FY 2016 – 2026.

logoKey Insights from Primary Research

  • With all-encompassing interviews with high ranking executives of the companies engaged in the production of L-Arabinose, we concluded that the global L-Arabinose market to witness steady growth in the vicinity of 5.1 % till 2026 end.
  • Representative’s insight projected that the global market value of the global L-Arabinose market to surpass the value of USD 300 Million by 2026. We validated the projected figures through our secondary research conducted by our senior analysts.
  • The representatives predict the food and beverage application to continue to remain the top consuming application. The food and beverage industry is expected to exhibit the highest growth rate. With the increasing focus on reducing the impact of sweeteners over human health is expected to drive the consumption in food and beverage application.
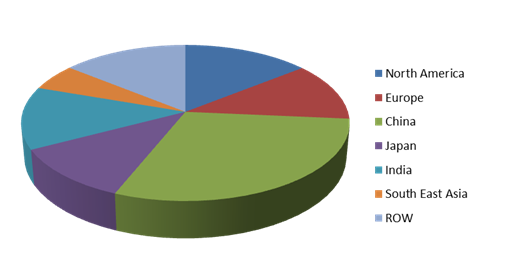
  • China is expected to be largest revenue generating market. India and Japan are expected to be other key market in the Asia Pacific region after China. The North America and Europe region are expected to remain major markets after the Asia Pacific region.

logoKey Recommendations from Analysts

  • Our analysts recommend increased concentration in the Asia Pacific region. China and India are major economies in the Asia Pacific region with a rising population and increasing diabetes cases propelling the consumption of fermented food products. The governments in these countries are increasingly taking initiatives in reducing the sugar levels in the food and beverages.
  • The United States is expected to provide great potential for the growth of the L-Arabinose market as the region is witnessing a rise in diabetic cases and governments is regulating laws for a reduction in the number of sugar levels in beverages.
  • With new technologies coming into the market with respect to manufacturing and end-use, the market is expected to experience higher growth in the near future.
  • Our analyst also predicts for a significant rise in demand for L-Arabinose during the forecast period from 2023 to 2026.

logoKey Regional Pockets-Regional Production Analysis

L-Arabinose Market

To know more about this report | Request Free Sample Copy

The quantitative data is further underlined and reinforced by comprehensive qualitative data which comprises various across-the-board market dynamics. The rationales which directly or indirectly impact the L-Arabinose industry are exemplified through parameters such as growth drivers, restraints, challenges, and opportunities among other impacting factors.

Throughout our research report, we have encompassed all the proven models and tools of industry analysis and extensively illustrated all the key business strategies and business models adopted in the L-Arabinose industry. The report provides an all-inclusive and detailed competitive landscape prevalent in the L-Arabinose market.

The report utilizes established industry analysis tools and models such as Porter’s Five Forces framework to analyze and recognize critical business strategies adopted by various stakeholders involved in the entire value chain of the L-Arabinose industry. The L-Arabinose market report additionally employs SWOT analysis and PESTLE analysis models for further in-depth analysis.

logoReport Scope

Report Attribute

Details

Market Size in 2019

USD 213.72 Million

Projected Market Size in 2026

USD 300 Million

CAGR Growth Rate

CAGR 5.1%

Base Year

2019

Forecast Years

2020-2026

Key Market Players

Dupont Danisco, Healtang Biotech Co, Ltd., Sisco Research Laboratories Pvt. Ltd., Thomson Biotech(Xiamen) Co, Ltd., Xieli Bio-Technology, MAK Wood Inc., Futaste, Huakang Pharmaceuticals, Lujian Biological, Longlive Bio-Technology, and Others.

Key Segment

By Type, Label Information, End-user and Region

Major Regions Covered

North America, Europe, Asia Pacific, Latin America, and the Middle East &, Africa

Purchase Options

Request customized purchase options to meet your research needs. Explore purchase options

The report study further includes an in-depth analysis of industry players' market shares and provides an overview of leading players' market position in the L-Arabinose sector. Key strategic developments in the L-Arabinose market competitive landscape such as acquisitions & mergers, inaugurations of different products and services, partnerships & joint ventures, MoU agreements, VC & funding activities, R&D activities, and geographic expansion among other noteworthy activities by key players of the L-Arabinose market are appropriately highlighted in the report.

The near future of the market for yeast is expected to have a huge opportunity for L-Arabinosein wake of rising concerns over the use of synthetic flavor enhancers. The food industry has undergone a rise in the consumption of fermented food products including yogurt, sauces and pickles. Yeast is used on a large scale for fermentation during the production of these foods. Yeast is considered better in fermentation than the chemical agents available in the market. The growing consumption of yeast is expected to drive the growth of L-Arabinose market.

Additionally, L arabinose use in the medical field, chemistry and biological fields as a kind of important chemical products have been increasing in recent years. With the approval of the American Medical Society and Japanese Ministry of Health the L-Arabinose market has been rising with the increasing replacement of other relatively higher-caloric sweetening agents.

The L-Arabinose market research report delivers an acute valuation and taxonomy of the L-Arabinose industry by practically splitting the market on the basis of different product types, applications, and regions. Through the analysis of the historical and projected trends, all the segments and sub-segments were evaluated through the bottom-up approach, and different market sizes have been projected for FY 2020 to FY 2026. The regional segmentation of the L-Arabinose industry includes the complete classification of all the major continents including North America, Latin America, Europe, Asia Pacific, and Middle East & Africa. Further, country-wise data for the L-Arabinose industry is provided for the leading economies of the world.

The L-Arabinose market is segmented based on product type and application.  On the basis of product type segmentation, the market is classified into phytoextraction and chemical synthesis. In terms of Application segmentation, the market is bifurcated into food & beverages, pharmaceuticals and others.

logoCompetitive Analysis

Some of the essential players operating in the L-ARABINOSE market, but not restricted to include :

  • Dupont Danisco
  •  Healtang Biotech Co Ltd.
  •  Sisco Research Laboratories Pvt. Ltd.
  •  Thomson Biotech(Xiamen) Co Ltd.
  •  Xieli Bio-Technology
  •  MAK Wood Inc.
  •  Futaste
  •  Huakang Pharmaceuticals
  •  Lujian Biological
  •  Longlive Bio-Technology

The taxonomy of the L-ARABINOSE Market by its scope and segmentation is as follows:

logo By Product Type Segmentation Analysis

  • Phytoextraction
  • Chemical Synthesis

logo By Application Segmentation Analysis

  • Food &Beverages
  • Pharmaceuticals
  • Others

logo Regional Segmentation Analysis

  • North America
    • The U.S.
    • Canada
  • Europe
    • France
    • The UK
    • Spain
    • Germany
    • Italy
    • Rest of Europe
  • Asia Pacific
    • China
    • Japan
    • India
    • South Korea
    • Southeast Asia
    • Rest of Asia Pacific
  • Latin America
    • Brazil
    • Mexico
    • Rest of Latin America
  • Middle East & Africa
    • GCC
    • South Africa
    • Rest of Middle East & Africa

logoKEY BUSINESS POINTERS ADDRESSED & FOREMOST REASONS TO PROCURE THE REPORT:

  • Statistical Analysis of the Past, Current, and Future Trends of the Industry with Validated Market Sizes Data
  • Direct and Indirect Rationales Impacting the Industry
  • In-depth and Micro Analysis of Viable Segments and Sub-segments
  • Companies and Vendors Market Share, Competitive Landscape, and Player Positioning Analysis
  • Demand Side (Consumption) and Supply Side (Production) Perspective and Analysis wherever applicable
  • Key Buyers and End-Users Analysis
  • Value Chain and Manufacturing Cost Structure Analysis wherever relevant
  • Key Marketing Strategies as well as Key Sales Channels adopted in the market
  • Investment Opportunity Analysis & Patents Analysis wherever feasible
  • Technological Road Map & Technical Analysis
  • Robust Research Methodology comprising dynamic mix (65%~35%) of Extensive Primary Research (primary interviews, ad-hoc surveys, questionnaires) and Protracted Secondary Research (proprietary in-house database, paid external databases, publically available validated sources)

Table of Content

  1. CHAPTER 1. Executive Summary
  2. CHAPTER 2. L-Arabinose market – Product Type Analysis
    1. 2.1. Global L-Arabinose Market – Product Type Overview
    2. 2.2. Global L-Arabinose Market Share, by Product Type, 2019 & 2026 (USD Million)
    3. 2.3. Global L-Arabinose Market share, by Product Type, 2019 & 2026 (Tons)
    4. 2.4. Phytoextraction
      1. 2.4.1. Global Phytoextraction L-Arabinose Market, 2016-2026 (USD Million)
      2. 2.4.2. Global Phytoextraction L-Arabinose Market, 2016-2026 (Tons)
    5. 2.5. Chemical Synthesis
      1. 2.5.1. Global Chemical Synthesis L-Arabinose Market, 2016-2026 (USD Million)
      2. 2.5.2. Global Chemical Synthesis L-Arabinose Market, 2016-2026 (Tons)
  3. CHAPTER 3. L-Arabinose market – Application Analysis
    1. 3.1. Global L-Arabinose Market – Application Overview
    2. 3.2. Global L-Arabinose Market Share, by Application, 2019 & 2026 (USD Million)
    3. 3.3. Global L-Arabinose Market share, by Application, 2019 & 2026 (Tons)
    4. 3.4. Food & Beverages
      1. 3.4.1. Global Food & Beverages L-Arabinose Market, 2016-2026 (USD Million)
      2. 3.4.2. Global Food & Beverages L-Arabinose Market, 2016-2026 (Tons)
    5. 3.5. Pharmaceuticals
      1. 3.5.1. Global Pharmaceuticals L-Arabinose Market, 2016-2026 (USD Million)
      2. 3.5.2. Global Pharmaceuticals L-Arabinose Market, 2016-2026 (Tons)
    6. 3.6. Others
      1. 3.6.1. Global Others L-Arabinose Market, 2016-2026 (USD Million)
      2. 3.6.2. Global Others L-Arabinose Market, 2016-2026 (Tons)
  4. CHAPTER 4. L-Arabinose market – Regional Analysis
    1. 4.1. Global L-Arabinose Market Regional Overview
    2. 4.2. Global L-Arabinose Market Share, by Region, 2019 & 2026 (Value)
    3. 4.3. Global L-Arabinose Market Share, by Region, 2019 & 2026 (Volume)
    4. 4.4. North America
      1. 4.4.1. North America L-Arabinose Market size and forecast, 2016-2026
      2. 4.4.2. North America L-Arabinose Market, by Country, 2019 - 2026 (USD Million)
      3. 4.4.3. North America Market size and forecast, 2016-2026 (Tons)
      4. 4.4.4. North America L-Arabinose Market, by Country, 2019 - 2026 (Tons)
      5. 4.4.5. North America L-Arabinose Market, by Product Type, 2016-2026
        1. 4.4.5.1. North America L-Arabinose Market, by Product Type, 2016-2026 (USD Million)
        2. 4.4.5.2. North America L-Arabinose Market, by Product Type, 2016-2026 (Tons)
      6. 4.4.6. North America L-Arabinose Market, by Application, 2016-2026
        1. 4.4.6.1. North America L-Arabinose Market, by Application, 2016-2026 (USD Million)
        2. 4.4.6.2. North America L-Arabinose Market, by Application, 2016-2026 (Tons)
      7. 4.4.7. U.S.
        1. 4.4.7.1. U.S. Market size and forecast, 2016-2026 (USD Million)
        2. 4.4.7.2. U.S. Market size and forecast, 2016-2026 (Tons)
      8. 4.4.8. Canada
        1. 4.4.8.1. Canada Market size and forecast, 2016-2026 (USD Million)
        2. 4.4.8.2. Canada Market size and forecast, 2016-2026 (Tons)
    5. 4.5. Europe
      1. 4.5.1. Europe L-Arabinose Market size and forecast, 2016-2026
      2. 4.5.2. Europe L-Arabinose Market, by Country, 2019 - 2026 (USD Million)
      3. 4.5.3. Europe Market size and forecast, 2016-2026 (Tons)
      4. 4.5.4. Europe L-Arabinose Market, by Country, 2019 - 2026 (Tons)
      5. 4.5.5. Europe L-Arabinose Market, by Product Type, 2016-2026
        1. 4.5.5.1. Europe L-Arabinose Market, by Product Type, 2016-2026 (USD Million)
        2. 4.5.5.2. Europe L-Arabinose Market, by Product Type, 2016-2026 (Tons)
      6. 4.5.6. Europe L-Arabinose Market, by Application, 2016-2026
        1. 4.5.6.1. Europe L-Arabinose Market, by Application, 2016-2026 (USD Million)
        2. 4.5.6.2. Europe L-Arabinose Market, by Application, 2016-2026 (Tons)
      7. 4.5.7. Germany
        1. 4.5.7.1. Germany Market size and forecast, 2016-2026 (USD Million)
        2. 4.5.7.2. Germany Market size and forecast, 2016-2026 (Tons)
      8. 4.5.8. France
        1. 4.5.8.1. France Market size and forecast, 2016-2026 (USD Million)
        2. 4.5.8.2. France Market size and forecast, 2016-2026 (Tons)
      9. 4.5.9. U.K.
        1. 4.5.9.1. U.K. Market size and forecast, 2016-2026 (USD Million)
        2. 4.5.9.2. U.K. Market size and forecast, 2016-2026 (Tons)
      10. 4.5.10. Italy
        1. 4.5.10.1. Italy Market size and forecast, 2016-2026 (USD Million)
        2. 4.5.10.2. Italy Market size and forecast, 2016-2026 (Tons)
      11. 4.5.11. Spain
        1. 4.5.11.1. Spain Market size and forecast, 2016-2026 (USD Million)
        2. 4.5.11.2. Spain Market size and forecast, 2016-2026 (Tons)
      12. 4.5.12. Rest of Europe
        1. 4.5.12.1. Rest of Europe Market size and forecast, 2016-2026 (USD Million)
        2. 4.5.12.2. Rest of Europe Market size and forecast, 2016-2026 (Tons)
    6. 4.6. Asia Pacific
      1. 4.6.1. Asia Pacific L-Arabinose Market size and forecast, 2016-2026
      2. 4.6.2. Asia Pacific L-Arabinose Market, by Country, 2019 - 2026 (USD Million)
      3. 4.6.3. Asia Pacific Market size and forecast, 2016-2026 (Tons)
      4. 4.6.4. Asia Pacific L-Arabinose Market, by Country, 2019 - 2026 (Tons)
      5. 4.6.5. Asia Pacific L-Arabinose Market, by Product Type, 2016-2026
        1. 4.6.5.1. Asia Pacific L-Arabinose Market, by Product Type, 2016-2026 (USD Million)
        2. 4.6.5.2. Asia Pacific L-Arabinose Market, by Product Type, 2016-2026 (Tons)
      6. 4.6.6. Asia Pacific L-Arabinose Market, by Application, 2016-2026
        1. 4.6.6.1. Asia Pacific L-Arabinose Market, by Application, 2016-2026 (USD Million)
        2. 4.6.6.2. Asia Pacific L-Arabinose Market, by Application, 2016-2026 (Tons)
      7. 4.6.7. China
        1. 4.6.7.1. China Market size and forecast, 2016-2026 (USD Million)
        2. 4.6.7.2. China Market size and forecast, 2016-2026 (Tons)
      8. 4.6.8. Japan
        1. 4.6.8.1. Japan Market size and forecast, 2016-2026 (USD Million)
        2. 4.6.8.2. Japan Market size and forecast, 2016-2026 (Tons)
      9. 4.6.9. India
        1. 4.6.9.1. India Market size and forecast, 2016-2026 (USD Million)
        2. 4.6.9.2. India Market size and forecast, 2016-2026 (Tons)
      10. 4.6.10. South Korea
        1. 4.6.10.1. South Korea Market size and forecast, 2016-2026 (USD Million)
        2. 4.6.10.2. South Korea Market size and forecast, 2016-2026 (Tons)
      11. 4.6.11. South-East Asia
        1. 4.6.11.1. South-East Asia Market size and forecast, 2016-2026 (USD Million)
        2. 4.6.11.2. South-East Asia Market size and forecast, 2016-2026 (Tons)
      12. 4.6.12. Rest of Asia Pacific
        1. 4.6.12.1. Rest of Asia Pacific Market size and forecast, 2016-2026 (USD Million)
        2. 4.6.12.2. Rest of Asia Pacific Market size and forecast, 2016-2026 (Tons)
    7. 4.7. Latin America
      1. 4.7.1. Latin America L-Arabinose Market size and forecast, 2016-2026
      2. 4.7.2. Latin America L-Arabinose Market, by Country, 2019 - 2026 (USD Million)
      3. 4.7.3. Latin America Market size and forecast, 2016-2026 (Tons)
      4. 4.7.4. Latin America L-Arabinose Market, by Country, 2019 - 2026 (Tons)
      5. 4.7.5. Latin America L-Arabinose Market, by Product Type, 2016-2026
        1. 4.7.5.1. Latin America L-Arabinose Market, by Product Type, 2016-2026 (USD Million)
        2. 4.7.5.2. Latin America L-Arabinose Market, by Product Type, 2016-2026 (Tons)
      6. 4.7.6. Latin America L-Arabinose Market, by Application, 2016-2026
        1. 4.7.6.1. Latin America L-Arabinose Market, by Application, 2016-2026 (USD Million)
        2. 4.7.6.2. Latin America L-Arabinose Market, by Application, 2016-2026 (Tons)
      7. 4.7.7. Brazil
        1. 4.7.7.1. Brazil Market size and forecast, 2016-2026 (USD Million)
        2. 4.7.7.2. Brazil Market size and forecast, 2016-2026 (Tons)
      8. 4.7.8. Mexico
        1. 4.7.8.1. Mexico Market size and forecast, 2016-2026 (USD Million)
        2. 4.7.8.2. Mexico Market size and forecast, 2016-2026 (Tons)
      9. 4.7.9. Rest of Latin America
        1. 4.7.9.1. Rest of Latin America Market size and forecast, 2016-2026 (USD Million)
        2. 4.7.9.2. Rest of Latin America Market size and forecast, 2016-2026 (Tons)
    8. 4.8. The Middle-East and Africa
      1. 4.8.1. The Middle-East and Africa L-Arabinose Market size and forecast, 2016-2026
      2. 4.8.2. The Middle-East and Africa L-Arabinose Market, by Country, 2019 - 2026 (USD Million)
      3. 4.8.3. The Middle-East and Africa Market size and forecast, 2016-2026 (Tons)
      4. 4.8.4. The Middle-East and Africa L-Arabinose Market, by Country, 2019 - 2026 (Tons)
      5. 4.8.5. The Middle-East and Africa L-Arabinose Market, by Product Type, 2016-2026
        1. 4.8.5.1. The Middle-East and Africa L-Arabinose Market, by Product Type, 2016-2026 (USD Million)
        2. 4.8.5.2. The Middle-East and Africa L-Arabinose Market, by Product Type, 2016-2026 (Tons)
      6. 4.8.6. The Middle-East and Africa L-Arabinose Market, by Application, 2016-2026
        1. 4.8.6.1. The Middle-East and Africa L-Arabinose Market, by Application, 2016-2026 (USD Million)
        2. 4.8.6.2. The Middle-East and Africa L-Arabinose Market, by Application, 2016-2026 (Tons)
      7. 4.8.7. GCC Countries
        1. 4.8.7.1. GCC Countries Market size and forecast, 2016-2026 (USD Million)
        2. 4.8.7.2. GCC Countries Market size and forecast, 2016-2026 (Tons)
      8. 4.8.8. South Africa
        1. 4.8.8.1. South Africa Market size and forecast, 2016-2026 (USD Million)
        2. 4.8.8.2. South Africa Market size and forecast, 2016-2026 (Tons)
      9. 4.8.9. Rest of Middle-East Africa
        1. 4.8.9.1. Rest of Middle-East Africa Market size and forecast, 2016-2026 (USD Million)
        2. 4.8.9.2. Rest of Middle-East Africa Market size and forecast, 2016-2026 (Tons)
  5. CHAPTER 5. L-Arabinose Production, Consumption, Export, Import by Regions
    1. 5.1. Global L-Arabinose production and revenue, 2016-2026 (USD Million) (Tons)
    2. 5.2. Global Import and Export Analysis, by Region
  6. CHAPTER 6. L-Arabinose market – Competitive Landscape
    1. 6.1. Competitor Market Share – Revenue
    2. 6.2. Market Concentration Rate Analysis, Top 3 and Top 5 Players
    3. 6.3. Competitor Market Share – Volume
    4. 6.4. Strategic Development
      1. 6.4.1. Acquisitions and Mergers
      2. 6.4.2. New Products
      3. 6.4.3. Research & Development Activities
  7. CHAPTER 7. Company Profiles
    1. 7.1. Dupont Danisco
      1. 7.1.1. Company Overview
      2. 7.1.2. Dupont Danisco Sales, Revenue, Price, and Gross Margin
      3. 7.1.3. Product portfolio
      4. 7.1.4. Recent initiatives
    2. 7.2. Healtang Biotech Co, Ltd.
      1. 7.2.1. Company Overview
      2. 7.2.2. Healtang Biotech Co, Ltd. Sales, Revenue, Price, and Gross Margin
      3. 7.2.3. Product portfolio
      4. 7.2.4. Recent initiatives
    3. 7.3. Sisco Research Laboratories Pvt. Ltd.
      1. 7.3.1. Company Overview
      2. 7.3.2. Sisco Research Laboratories Pvt. Ltd. Sales, Revenue, Price, and Gross Margin
      3. 7.3.3. Product portfolio
      4. 7.3.4. Recent initiatives
    4. 7.4. Thomson Biotech(Xiamen) Co, Ltd.
      1. 7.4.1. Company Overview
      2. 7.4.2. Thomson Biotech(Xiamen) Co, Ltd. Sales, Revenue, Price, and Gross Margin
      3. 7.4.3. Product portfolio
      4. 7.4.4. Recent initiatives
    5. 7.5. Xieli Bio-Technology
      1. 7.5.1. Company Overview
      2. 7.5.2. Xieli Bio-Technology Sales, Revenue, Price, and Gross Margin
      3. 7.5.3. Product portfolio
      4. 7.5.4. Recent initiatives
    6. 7.6. MAK Wood Inc.
      1. 7.6.1. Company Overview
      2. 7.6.2. MAK Wood Inc. Sales, Revenue, Price, and Gross Margin
      3. 7.6.3. Product portfolio
      4. 7.6.4. Recent initiatives
    7. 7.7. Futaste
      1. 7.7.1. Company Overview
      2. 7.7.2. Futaste Sales, Revenue, Price, and Gross Margin
      3. 7.7.3. Product portfolio
      4. 7.7.4. Recent initiatives
    8. 7.8. Huakang Pharmaceuticals
      1. 7.8.1. Company Overview
      2. 7.8.2. Huakang Pharmaceuticals Sales, Revenue, Price, and Gross Margin
      3. 7.8.3. Product portfolio
      4. 7.8.4. Recent initiatives
    9. 7.9. Lujian Biological
      1. 7.9.1. Company Overview
      2. 7.9.2. Lujian Biological Sales, Revenue, Price, and Gross Margin
      3. 7.9.3. Product portfolio
      4. 7.9.4. Recent initiatives
    10. 7.10. Longlive Bio-Technology
      1. 7.10.1. Company Overview
      2. 7.10.2. Longlive Bio-Technology Sales, Revenue, Price, and Gross Margin
      3. 7.10.3. Product portfolio
      4. 7.10.4. Recent initiatives
  8. CHAPTER 8. L-Arabinose — Industry Analysis
    1. 8.1. Introduction and Taxonomy
    2. 8.2. L-Arabinose Market – Key Trends
      1. 8.2.1. Market Drivers
      2. 8.2.2. Market Restraints
      3. 8.2.3. Market Opportunities
    3. 8.3. Value Chain Analysis
    4. 8.4. Key Mandates and Regulations
    5. 8.5. Technology Roadmap and Timeline
    6. 8.6. L-Arabinose market – Attractiveness Analysis
      1. 8.6.1. By Product Type
      2. 8.6.2. By Application
      3. 8.6.3. By Region
  9. CHAPTER 9. Raw Material analysis
    1. 9.1. L-Arabinose Key Raw Material Analysis
      1. 9.1.1. Key Raw Materials
      2. 9.1.2. Price Trend of Key Raw Materials
    2. 9.2. Key Suppliers of Raw Materials
    3. 9.3. Proportion of Manufacturing Cost Structure
      1. 9.3.1. Raw Materials
      2. 9.3.2. Labor Cost
    4. 9.4. Manufacturing Expenses Analysis of L-Arabinose
  10. CHAPTER 10. Industrial Chain, Sourcing Strategy and Downstream Buyers
    1. 10.1. L-Arabinose Industrial Chain Analysis
    2. 10.2. Upstream Raw Materials Sourcing
      1. 10.2.1. Risk Mitigation:
      2. 10.2.2. Supplier Relationships:
      3. 10.2.3. Business Processes:
      4. 10.2.4. Securing the Product:
    3. 10.3. Raw Materials Sources of L-Arabinose Major Manufacturers in 2016
    4. 10.4. Downstream Buyers
    5. 10.5. Distributors/Traders List
  11. CHAPTER 11. Marketing Strategy Analysis, Distributors
    1. 11.1. Marketing Channel
    2. 11.2. Direct Marketing
    3. 11.3. Indirect Marketing
    4. 11.4. Marketing Channel Development Trend
    5. 11.5. Economic/Political Environmental Change
  12. CHAPTER 12. Report Conclusion
  13. CHAPTER 13. Research Approach & Methodology
    1. 13.1. Report Description
    2. 13.2. Research Scope
    3. 13.3. Research Methodology
      1. 13.3.1. Secondary Research
      2. 13.3.2. Primary Research
      3. 13.3.3. Models
        1. 13.3.3.1. Company Share Analysis Model
        2. 13.3.3.2. Revenue Based Modeling
        3. 13.3.3.3. Research Limitations

        List of Figures

        FIG. 1 Global L-Arabinose Market, 2016-2026 (USD Million)
        FIG. 2 Global L-Arabinose Market Share, by Product Type, 2019 & 2026 (USD Million)
        FIG. 3 Global L-Arabinose Market share, by Product Type, 2019 & 2026 (Tons)
        FIG. 4 Global Phytoextraction L-Arabinose Market, 2016-2026 (USD Million)
        FIG. 5 Global Phytoextraction L-Arabinose  Market, 2016-2026 (Tons)
        FIG. 6 Global Chemical Synthesis L-Arabinose Market, 2016-2026 (USD Million)
        FIG. 7 Global Chemical Synthesis L-Arabinose  Market, 2016-2026 (Tons)
        FIG. 8 Global L-Arabinose Market Share, by Application, 2019 & 2026 (USD Million)
        FIG. 9 Global L-Arabinose Market share, by Application, 2019 & 2026 (Tons)
        FIG. 10 Global Food & Beverages L-Arabinose Market, 2016-2026 (USD Million)
        FIG. 11 Global Food & Beverages L-Arabinose  Market, 2016-2026 (Tons)
        FIG. 12 Global Pharmaceuticals L-Arabinose Market, 2016-2026 (USD Million)
        FIG. 13 Global Pharmaceuticals L-Arabinose  Market, 2016-2026 (Tons)
        FIG. 14 Global Others L-Arabinose Market, 2016-2026 (USD Million)
        FIG. 15 Global Others L-Arabinose  Market, 2016-2026 (Tons)
        FIG. 16 Global L-Arabinose Market Share, by Region, 2019 & 2026
        FIG. 17 Global L-Arabinose Market Share, by Region, 2019 & 2026
        FIG. 18 North America L-Arabinose Market, 2016-2026
        FIG. 19 North America L-Arabinose  Market, 2016-2026 (Tons)
        FIG. 20 U.S. L-Arabinose Market, 2016-2026
        FIG. 21 U.S. L-Arabinose  Market, 2016-2026 (Tons)
        FIG. 22 Canada L-Arabinose Market, 2016-2026
        FIG. 23 Canada L-Arabinose  Market, 2016-2026 (Tons)
        FIG. 24 Europe L-Arabinose Market, 2016-2026
        FIG. 25 Europe L-Arabinose  Market, 2016-2026 (Tons)
        FIG. 26 Germany L-Arabinose Market, 2016-2026
        FIG. 27 Germany L-Arabinose  Market, 2016-2026 (Tons)
        FIG. 28 France L-Arabinose Market, 2016-2026
        FIG. 29 France L-Arabinose  Market, 2016-2026 (Tons)
        FIG. 30 U.K. L-Arabinose Market, 2016-2026
        FIG. 31 U.K. L-Arabinose  Market, 2016-2026 (Tons)
        FIG. 32 Italy L-Arabinose Market, 2016-2026
        FIG. 33 Italy L-Arabinose  Market, 2016-2026 (Tons)
        FIG. 34 Spain L-Arabinose Market, 2016-2026
        FIG. 35 Spain L-Arabinose  Market, 2016-2026 (Tons)
        FIG. 36 Rest of Europe L-Arabinose Market, 2016-2026
        FIG. 37 Rest of Europe L-Arabinose  Market, 2016-2026 (Tons)
        FIG. 38 Asia Pacific L-Arabinose Market, 2016-2026
        FIG. 39 Asia Pacific L-Arabinose  Market, 2016-2026 (Tons)
        FIG. 40 China L-Arabinose Market, 2016-2026
        FIG. 41 China L-Arabinose  Market, 2016-2026 (Tons)
        FIG. 42 Japan L-Arabinose Market, 2016-2026
        FIG. 43 Japan L-Arabinose  Market, 2016-2026 (Tons)
        FIG. 44 India L-Arabinose Market, 2016-2026
        FIG. 45 India L-Arabinose  Market, 2016-2026 (Tons)
        FIG. 46 South  Korea L-Arabinose Market, 2016-2026
        FIG. 47 South  Korea L-Arabinose  Market, 2016-2026 (Tons)
        FIG. 48 South-East Asia L-Arabinose Market, 2016-2026
        FIG. 49 South-East Asia L-Arabinose  Market, 2016-2026 (Tons)
        FIG. 50 Rest of Asia Pacific L-Arabinose Market, 2016-2026
        FIG. 51 Rest of Asia Pacific L-Arabinose  Market, 2016-2026 (Tons)
        FIG. 52 Latin America L-Arabinose Market, 2016-2026
        FIG. 53 Latin America L-Arabinose  Market, 2016-2026 (Tons)
        FIG. 54 Brazil L-Arabinose Market, 2016-2026
        FIG. 55 Brazil L-Arabinose  Market, 2016-2026 (Tons)
        FIG. 56 Mexico L-Arabinose Market, 2016-2026
        FIG. 57 Mexico L-Arabinose  Market, 2016-2026 (Tons)
        FIG. 58 Rest of Latin America L-Arabinose Market, 2016-2026
        FIG. 59 Rest of Latin America L-Arabinose  Market, 2016-2026 (Tons)
        FIG. 60 The Middle-East and Africa L-Arabinose Market, 2016-2026
        FIG. 61 The Middle-East and Africa L-Arabinose  Market, 2016-2026 (Tons)
        FIG. 62 GCC Countries L-Arabinose Market, 2016-2026
        FIG. 63 GCC Countries L-Arabinose  Market, 2016-2026 (Tons)
        FIG. 64 South Africa L-Arabinose Market, 2016-2026
        FIG. 65 South Africa L-Arabinose  Market, 2016-2026 (Tons)
        FIG. 66 Rest of Middle-East Africa L-Arabinose Market, 2016-2026
        FIG. 67 Rest of Middle-East Africa L-Arabinose  Market, 2016-2026 (Tons)
        FIG. 68 Global L-Arabinose production and revenue, 2016-2026 (USD Million) (Tons)
        FIG. 69 North America L-Arabinose production and revenue, 2016-2026 (USD Million) (Tons)
        FIG. 70 Europe L-Arabinose production and revenue, 2016-2026 (USD Million) (Tons)
        FIG. 71 Asia Pacific L-Arabinose production and revenue, 2016-2026 (USD Million) (Tons)
        FIG. 72 Latin America L-Arabinose production and revenue, 2016-2026 (USD Million) (Tons)
        FIG. 73 Middle East and Africa L-Arabinose production and revenue, 2016-2026 (USD Million) (Tons)
        FIG. 74 Competitor Market Share – Revenue
        FIG. 75 Competitor Market Share – Volume
        FIG. 76 Dupont Danisco Revenue and Growth Rate
        FIG. 77 Dupont Danisco Market Share
        FIG. 78 Healtang Biotech Co, Ltd. Revenue and Growth Rate
        FIG. 79 Healtang Biotech Co, Ltd. Market Share
        FIG. 80 Sisco Research Laboratories Pvt. Ltd. Revenue and Growth Rate
        FIG. 81 Sisco Research Laboratories Pvt. Ltd. Market Share
        FIG. 82 Thomson Biotech(Xiamen) Co, Ltd. Revenue and Growth Rate
        FIG. 83 Thomson Biotech(Xiamen) Co, Ltd. Market Share
        FIG. 84 Xieli Bio-Technology Revenue and Growth Rate
        FIG. 85 Xieli Bio-Technology Market Share
        FIG. 86 MAK Wood Inc. Revenue and Growth Rate
        FIG. 87 MAK Wood Inc. Market Share
        FIG. 88 Futaste Revenue and Growth Rate
        FIG. 89 Futaste Market Share
        FIG. 90 Huakang Pharmaceuticals Revenue and Growth Rate
        FIG. 91 Huakang Pharmaceuticals Market Share
        FIG. 92 Lujian Biological Revenue and Growth Rate
        FIG. 93 Lujian Biological Market Share
        FIG. 94 Longlive Bio-Technology Revenue and Growth Rate
        FIG. 95 Longlive Bio-Technology Market Share
        FIG. 96 Market Dynamics
        FIG. 97 Global L-Arabinose – Value Chain Analysis
        FIG. 98 Key Mandates and Regulations
        FIG. 99 Technology Roadmap and Timeline
        FIG. 100 Market Attractiveness Analysis – By Product Type
        FIG. 101 Market Attractiveness Analysis – By Application
        FIG. 102 Market Attractiveness Analysis – By Region
        FIG. 103 Manufacturing Cost Structure of L-Arabinose
        FIG. 104 L-Arabinose Industrial Chain Analysis
        FIG. 105 Market Channel
        FIG. 106 Marketing Channel Development Trend
        FIG. 107 Growth in World Gross Product, 2008-2019

        List of Tables

        TABLE 1 Global L-Arabinose market, 2019 & 2026 (USD Million)
        TABLE 2 Global L-Arabinose market, by Product Type, 2016-2026 (USD Million)
        TABLE 3 Global L-Arabinose market, by Product Type, 2016-2026 (Tons)
        TABLE 4 Global L-Arabinose market, by Application, 2016-2026 (USD Million)
        TABLE 5 Global L-Arabinose market, by Application, 2016-2026 (Tons)
        TABLE 6 Global L-Arabinose market, by region, 2016-2026 (USD Million)
        TABLE 7 Global L-Arabinose market, by region, 2016-2026 (Tons)
        TABLE 8 North America L-Arabinose Market, by Product Type, 2016-2026 (USD Million)
        TABLE 9 North America L-Arabinose Market, by Product Type, 2016-2026 (Tons)
        TABLE 10 North America L-Arabinose Market, by Application, 2016-2026 (USD Million)
        TABLE 11 North America L-Arabinose Market, by Application, 2016-2026 (Tons)
        TABLE 12 Europe L-Arabinose Market, by Product Type, 2016-2026 (USD Million)
        TABLE 13 Europe L-Arabinose Market, by Product Type, 2016-2026 (Tons)
        TABLE 14 Europe L-Arabinose Market, by Application, 2016-2026 (USD Million)
        TABLE 15 Europe L-Arabinose Market, by Application, 2016-2026 (Tons)
        TABLE 16 Asia Pacific L-Arabinose Market, by Product Type, 2016-2026 (USD Million)
        TABLE 17 Asia Pacific L-Arabinose Market, by Product Type, 2016-2026 (Tons)
        TABLE 18 Asia Pacific L-Arabinose Market, by Application, 2016-2026 (USD Million)
        TABLE 19 Asia Pacific L-Arabinose Market, by Application, 2016-2026 (Tons)
        TABLE 20 Latin America L-Arabinose Market, by Product Type, 2016-2026 (USD Million)
        TABLE 21 Latin America L-Arabinose Market, by Product Type, 2016-2026 (Tons)
        TABLE 22 Latin America L-Arabinose Market, by Application, 2016-2026 (USD Million)
        TABLE 23 Latin America L-Arabinose Market, by Application, 2016-2026 (Tons)
        TABLE 24 The Middle-East and Africa L-Arabinose Market, by Product Type, 2016-2026 (USD Million)
        TABLE 25 The Middle-East and Africa L-Arabinose Market, by Product Type, 2016-2026 (Tons)
        TABLE 26 The Middle-East and Africa L-Arabinose Market, by Application, 2016-2026 (USD Million)
        TABLE 27 The Middle-East and Africa L-Arabinose Market, by Application, 2016-2026 (Tons)
        TABLE 28 North America L-Arabinose Production, Consumption, Export, Import, 2016-2019
        TABLE 29 Europe L-Arabinose Production, Consumption, Export, Import, 2016-2019
        TABLE 30 Asia Pacific L-Arabinose Production, Consumption, Export, Import, 2016-2019
        TABLE 31 Latin America L-Arabinose Production, Consumption, Export, Import, 2016-2019
        TABLE 32 Middle East & Africa L-Arabinose Production, Consumption, Export, Import, 2016-2019
        TABLE 33 Global L-Arabinose Market - Company Revenue Analysis 2016-2019 (USD Million)
        TABLE 34 Global L-Arabinose Market - Company Revenue Share Analysis 2016-2019(%)
        TABLE 35 Global L-Arabinose Market - Company Volume Analysis 2016-2019 (Tons)
        TABLE 36 Global L-Arabinose Market - Company Volume Share Analysis 2016-2019(%)
        TABLE 37 Acquisitions and Mergers
        TABLE 38 New Product/Service Launch
        TABLE 39 Research & Development Activities
        TABLE 40 Market Drivers
        TABLE 41 Market Restraints
        TABLE 42 Market Opportunities
        TABLE 43 Production Base and Market Concentration Rate of Raw Material
        TABLE 44 Key Suppliers of Raw Materials
        TABLE 45 Raw Materials Sources of L-Arabinose Major Manufacturers in 2016
        TABLE 46 Major Buyers of L-Arabinose
        TABLE 47 Distributors/Traders of L-Arabinose by Region

Industry Major Market Players

  • Dupont Danisco
  •  Healtang Biotech Co Ltd.
  •  Sisco Research Laboratories Pvt. Ltd.
  •  Thomson Biotech(Xiamen) Co Ltd.
  •  Xieli Bio-Technology
  •  MAK Wood Inc.
  •  Futaste
  •  Huakang Pharmaceuticals
  •  Lujian Biological
  •  Longlive Bio-Technology