Search Market Research Report

Discover Our Latest Reports
Discover Our Featured Reports
Discover Top Selling Reports

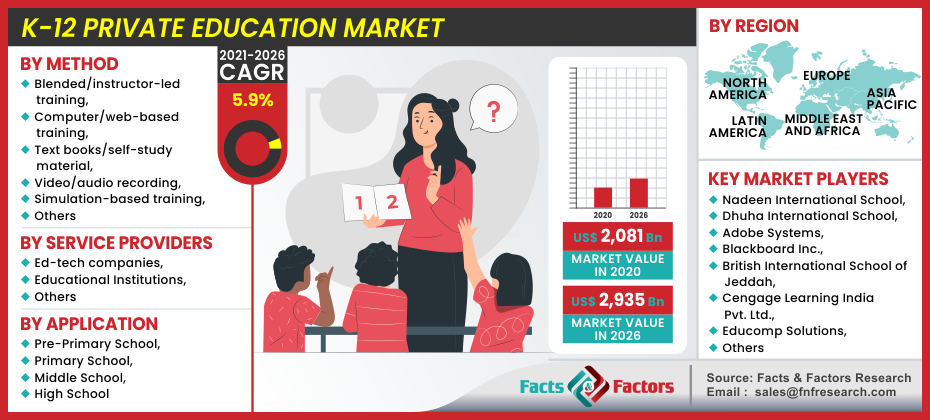
K-12 Private Education Market Size, Share Global Analysis Report, , 2021 – 2026

report img

K-12 Private Education Market By Method (Blended/instructor-led training, Computer/web-based training, Text books/self-study material, Video/audio recording, Simulation-based training, and Others), and By Service Providers (Ed-tech companies, Educational Institutions, and Others), By Application (Pre-Primary School, Primary School, Middle School, High School): Global Industry Perspective, Comprehensive Analysis, and Forecast, 2021 – 2026

Industry Insights

[218+ Pages Report] According to the Facts and Factors report, the global K-12 Private Education market was USD 2,081 Billion in 2020, with revenues anticipated to reach about USD 2,935 Billion by the end of 2026, increasing progressively at a CAGR of around 5.9% from 2021 to 2026.

logoMarket Overview

K–12 stands for kindergarten to 12th grade. The education sector comprises organizations with expertise in various fields of learning and teaching. The increase and use of education technology (EdTech) services within the academic and non-academic sectors should have led to the growth of the private training industry k-12. In the K-12 and higher education markets, EdTech products and offers became more and more embraced.

In today's world, with a steady increase in understanding of the need for primary training among parents, educational institutions and investors, there is a great need for high-quality schooling to boost private schools' tuition fees. However, the education services on the market are insufficient. One of the main obstacles for the K-12 education sector is the small availability and lack of funding available for the students. Several steps were taken in the last few years to increase quality in education, such as the establishment of quality insurance bodies, construction standards, and promoting technology-driven education, among others, which combined to demonstrate changes in education quality. Qatar and the USA lead their GCC counterparts, based on the standard of primary education, respectively rank 10th and 16th on the world stage according to Global Competitiveness Report 2017-2018, which was published in the World Economic Forum (WEF).

K-12 Private Education Market

To know more about this report | Request Free Sample Copy

logoIndustry Growth Factor

With the evolving technology environment, companies are continually searching for people who will be at the forefront of this transition and quickly respond to those changes. The shortage of qualified employees has been one of the biggest obstacles for companies, leading individuals to advanced high school classes that can be beneficial to students on a long-term basis. Globalization and the invention of the internet have opened up new possibilities for people from leading universities all around the world to improve their knowledge. Individuals choose these courses because they are in step with technical advances around the world.

If globalization develops and the increasing number of students move to different countries for schooling, enormous opportunities can be anticipated for private education providers. According to a survey released by the British Council, the highest outbound number of students from the United States, United Kingdom, Australia, Canada, and Germany are projected to be in China, India, and South Korea This massive influx of traffic is projected to generate enormous possibilities for providers of higher education solutions as universities need to handle such large amounts of data that would generate new revenues for K-12 private providers of education.

logoCOVID-19 Impact

COVID-19 (Coronavirus Disease) has been declared a pandemic by the World Health Organization (WHO) which causes massive consequences for companies and human beings. The reality that this epidemic is causing people to remain at home, businesses are forced to have an entirely distant workspace in anticipation of the respective governments' order for Work from Home (WFH). Schools are also motivated to pursue smart teaching and research by the access of their students to the Professional Learning and Development network (PLD). Distance learning is predicted to have a positive influence on the industry's development owing to this epidemic.

Organizations, by using the best resources in place and prepared for a similar scenario in the future, will search for an outstanding opportunity to address their distance learning strategy. Organizations must also ensure teachers and students who work online have the resources they need, such as VPNs and teamwork and video conference solutions. Besides, policymakers around the world recommend intelligent schooling and learning solutions and offer hubs for free tutorials. For example, the New Zealand government has bought or rented 17,000 portable gadgets to deliver to families without one.

logoGlobal K-12 Private Education Market: Segmentation

Based on the method the market is segmented into blended/instructor-led training, computer/web-based training, textbooks/self-study material, video/audio recording, simulation-based training, and others. Additionally, based on service providers the market is further categorized into ed-tech companies, educational institutions, online courses, and others. Moreover based on the application market is further classified into pre-primary school, primary school, middle school, and high school.

logoGlobal K-12 Private Education Market: Regional Analysis

Based on regions, the global K-12 Private Education market can be divided into five main regions.

In the K-12 private education and education sector, as a result of the participation of developing economies such as India, China, and Japan, the Asian Pacifical region will increase significantly. Government-driven programs are anticipated to improve the smart education and learning market, for example, government-supported rural literacy projects. The National Digital Library of India, for example, is an online Library, developed by the Ministry of Human Resource Development, which offers academic content at various levels of learning and education by subject area.

logoReport Scope

Report Attribute

Details

Market Size in 2020

USD 2,081 Billion

Projected Market Size in 2026

USD 2,935 Billion

Growth Rate

CAGR 5.9%

Base Year

2020

Forecast Years

2021-2026

Key Market Players

Nadeen International School, Dhuha International School, Adobe Systems, Blackboard Inc., British International School of Jeddah, Cengage Learning India Pvt. Ltd., Educomp Solutions, K12 Inc., McGraw-Hill Education, Next Education India Pvt. Ltd., Pearson Education Inc., TAL Education Group, Tata Class Edge, Al- Jazeera Academy, GEMS Education, Dubai International Academy, International School of London, and Taaleem.

Key Segment

By Method, By Service Providers, By Application and By Region

Major Regions Covered

North America, Europe, Asia Pacific, Latin America, and the Middle East & Africa

Purchase Options

Request customized purchase options to meet your research needs. Explore purchase options

logoGlobal K-12 Private Education Market: Competitive Players

Some of the key players in the K-12 Private Education market are :

  • Nadeen International School
  • Dhuha International School
  • Adobe Systems
  • Blackboard Inc.
  • British International School of Jeddah
  • Cengage Learning India Pvt. Ltd.
  • Educomp Solutions
  • K12 Inc.
  • McGraw-Hill Education
  • Next Education India Pvt. Ltd.
  • Pearson Education Inc.
  • TAL Education Group
  • Tata Class Edge
  • Al- Jazeera Academy
  • GEMS Education
  • Dubai International Academy
  • International School of London
  • Taaleem

logoGlobal K-12 Private Education Market: Regional Segment Analysis

  • North America
    • U.S.
    • Canada
  • Europe
    • U.K.
    • France
    • Germany
  • The Asia Pacific
    • China
    • Japan
    • India
  • Latin America
    • Brazil
    • Mexico
  • The Middle East and Africa

Table of Content

  1. Chapter 1 Executive Summary
    1. 1.1. Introduction of K-12 Private Education
    2. 1.2. Global K-12 Private Education Market, 2019 & 2026 (USD Billion)
    3. 1.3. COVID-19 Impacts on High Energy Lasers Market
      1. 1.3.1. Short Term COVID-19 Impact on the Market
      2. 1.3.2. Mid-Term COVID-19 Impact on the Market
      3. 1.3.3. Long-Term COVID-19 Impact on the Market
    4. 1.4. Business Strategies and Recommendations
    5. 1.3. Global K-12 Private Education Market, 2016 – 2026 (USD Billion)
    6. 1.4. Global K-12 Private Education Market Absolute Revenue Opportunity, 2016 – 2026 (USD Billion)
    7. 1.5. Global K-12 Private Education Market Incremental Revenue Opportunity, 2021 – 2026 (USD Billion)
  2. Chapter 2 K-12 Private Education Market – Method Analysis
    1. 2.1. Global K-12 Private Education Market – Method Overview
    2. 2.2. Global K-12 Private Education Market Share, by Method, 2019 & 2026 (USD Billion)
    3. 2.3. Blended/instructor led training
      1. 2.3.1. Global Blended/instructor led training K-12 Private Education Market, 2016 – 2026 (USD Billion)
    4. 2.4. Computer/web based training
      1. 2.4.1. Global Computer/web based training K-12 Private Education Market, 2016 – 2026 (USD Billion)
    5. 2.5. Text books/self-study material
      1. 2.5.1. Global Text books/self-study material K-12 Private Education Market, 2016 – 2026 (USD Billion)
    6. 2.6. Video/audio recording
      1. 2.6.1. Global Video/audio recording K-12 Private Education Market, 2016 – 2026 (USD Billion)
    7. 2.7. Simulation based training
      1. 2.7.1. Global Simulation based training K-12 Private Education Market, 2016 – 2026 (USD Billion)
    8. 2.8. Others
      1. 2.8.1. Global Others K-12 Private Education Market, 2016 – 2026 (USD Billion)
  3. Chapter 3 K-12 Private Education Market – Service Providers Analysis
    1. 3.1. Global K-12 Private Education Market – Service Providers Overview
    2. 3.2. Global K-12 Private Education Market Share, by Service Providers, 2019 & 2026 (USD Billion)
    3. 3.3. Ed-tech companies
      1. 3.3.1. Global Ed-tech companies K-12 Private Education Market, 2016 – 2026 (USD Billion)
    4. 3.4. Educational institutions
      1. 3.4.1. Global Educational institutions K-12 Private Education Market, 2016 – 2026 (USD Billion)
    5. 3.5. Online courses
      1. 3.5.1. Global Online courses K-12 Private Education Market, 2016 – 2026 (USD Billion)
    6. 3.6. Others
      1. 3.6.1. Global Others K-12 Private Education Market, 2016 – 2026 (USD Billion)
  4. Chapter 4 K-12 Private Education Market – Application Analysis
    1. 4.1. Global K-12 Private Education Market – Application Overview
    2. 4.2. Global K-12 Private Education Market Share, by Application, 2019 & 2026 (USD Billion)
    3. 4.3. Pre-Primary School
      1. 4.3.1. Global Pre-Primary School K-12 Private Education Market, 2016 – 2026 (USD Billion)
    4. 4.4. Primary School
      1. 4.4.1. Global Primary School K-12 Private Education Market, 2016 – 2026 (USD Billion)
    5. 4.5. Middle School
      1. 4.5.1. Global Middle School K-12 Private Education Market, 2016 – 2026 (USD Billion)
    6. 4.6. High School
      1. 4.6.1. Global High School K-12 Private Education Market, 2016 – 2026 (USD Billion)
  5. Chapter 5 K-12 Private Education Market – Regional Analysis
    1. 5.1. Global K-12 Private Education Market Regional Overview
    2. 5.2. Global K-12 Private Education Market Share, by Region, 2019 & 2026 (USD Billion)
    3. 5.3. North America
      1. 5.3.1. North America K-12 Private Education Market, 2016 – 2026 (USD Billion)
        1. 5.3.1.1. North America K-12 Private Education Market, by Country, 2016 - 2026 (USD Billion)
      2. 5.3.2. North America K-12 Private Education Market, by Method, 2016 – 2026
        1. 5.3.2.1. North America K-12 Private Education Market, by Method, 2016 – 2026 (USD Billion)
      3. 5.3.3. North America K-12 Private Education Market, by Service Providers, 2016 – 2026
        1. 5.3.3.1. North America K-12 Private Education Market, by Service Providers, 2016 – 2026 (USD Billion)
      4. 5.3.4. North America K-12 Private Education Market, by Application, 2016 – 2026
        1. 5.3.4.1. North America K-12 Private Education Market, by Application, 2016 – 2026 (USD Billion)
      5. 5.3.5. U.S.
        1. 5.3.5.1. U.S. K-12 Private Education Market, 2016 – 2026 (USD Billion)
      6. 5.3.6. Canada
        1. 5.3.6.1. Canada K-12 Private Education Market, 2016 – 2026 (USD Billion)
    4. 5.4. Europe
      1. 5.4.1. Europe K-12 Private Education Market, 2016 – 2026 (USD Billion)
        1. 5.4.1.1. Europe K-12 Private Education Market, by Country, 2016 - 2026 (USD Billion)
      2. 5.4.2. Europe K-12 Private Education Market, by Method, 2016 – 2026
        1. 5.4.2.1. Europe K-12 Private Education Market, by Method, 2016 – 2026 (USD Billion)
      3. 5.4.3. Europe K-12 Private Education Market, by Service Providers, 2016 – 2026
        1. 5.4.3.1. Europe K-12 Private Education Market, by Service Providers, 2016 – 2026 (USD Billion)
      4. 5.4.4. Europe K-12 Private Education Market, by Application, 2016 – 2026
        1. 5.4.4.1. Europe K-12 Private Education Market, by Application, 2016 – 2026 (USD Billion)
      5. 5.4.5. Germany
        1. 5.4.5.1. Germany K-12 Private Education Market, 2016 – 2026 (USD Billion)
      6. 5.4.6. France
        1. 5.4.6.1. France K-12 Private Education Market, 2016 – 2026 (USD Billion)
      7. 5.4.7. U.K.
        1. 5.4.7.1. U.K. K-12 Private Education Market, 2016 – 2026 (USD Billion)
      8. 5.4.8. Italy
        1. 5.4.8.1. Italy K-12 Private Education Market, 2016 – 2026 (USD Billion)
      9. 5.4.9. Spain
        1. 5.4.9.1. Spain K-12 Private Education Market, 2016 – 2026 (USD Billion)
      10. 5.4.10. Rest of Europe
        1. 5.4.10.1. Rest of Europe K-12 Private Education Market, 2016 – 2026 (USD Billion)
    5. 5.5. Asia Pacific
      1. 5.5.1. Asia Pacific K-12 Private Education Market, 2016 – 2026 (USD Billion)
        1. 5.5.1.1. Asia Pacific K-12 Private Education Market, by Country, 2016 - 2026 (USD Billion)
      2. 5.5.2. Asia Pacific K-12 Private Education Market, by Method, 2016 – 2026
        1. 5.5.2.1. Asia Pacific K-12 Private Education Market, by Method, 2016 – 2026 (USD Billion)
      3. 5.5.3. Asia Pacific K-12 Private Education Market, by Service Providers, 2016 – 2026
        1. 5.5.3.1. Asia Pacific K-12 Private Education Market, by Service Providers, 2016 – 2026 (USD Billion)
      4. 5.5.4. Asia Pacific K-12 Private Education Market, by Application, 2016 – 2026
        1. 5.5.4.1. Asia Pacific K-12 Private Education Market, by Application, 2016 – 2026 (USD Billion)
      5. 5.5.5. China
        1. 5.5.5.1. China K-12 Private Education Market, 2016 – 2026 (USD Billion)
      6. 5.5.6. Japan
        1. 5.5.6.1. Japan K-12 Private Education Market, 2016 – 2026 (USD Billion)
      7. 5.5.7. India
        1. 5.5.7.1. India K-12 Private Education Market, 2016 – 2026 (USD Billion)
      8. 5.5.8. South Korea
        1. 5.5.8.1. South Korea K-12 Private Education Market, 2016 – 2026 (USD Billion)
      9. 5.5.9. South-East Asia
        1. 5.5.9.1. South-East Asia K-12 Private Education Market, 2016 – 2026 (USD Billion)
      10. 5.5.10. Rest of Asia Pacific
        1. 5.5.10.1. Rest of Asia Pacific K-12 Private Education Market, 2016 – 2026 (USD Billion)
    6. 5.6. Latin America
      1. 5.6.1. Latin America K-12 Private Education Market, 2016 – 2026 (USD Billion)
        1. 5.6.1.1. Latin America K-12 Private Education Market, by Country, 2016 - 2026 (USD Billion)
      2. 5.6.2. Latin America K-12 Private Education Market, by Method, 2016 – 2026
        1. 5.6.2.1. Latin America K-12 Private Education Market, by Method, 2016 – 2026 (USD Billion)
      3. 5.6.3. Latin America K-12 Private Education Market, by Service Providers, 2016 – 2026
        1. 5.6.3.1. Latin America K-12 Private Education Market, by Service Providers, 2016 – 2026 (USD Billion)
      4. 5.6.4. Latin America K-12 Private Education Market, by Application, 2016 – 2026
        1. 5.6.4.1. Latin America K-12 Private Education Market, by Application, 2016 – 2026 (USD Billion)
      5. 5.6.5. Brazil
        1. 5.6.5.1. Brazil K-12 Private Education Market, 2016 – 2026 (USD Billion)
      6. 5.6.6. Mexico
        1. 5.6.6.1. Mexico K-12 Private Education Market, 2016 – 2026 (USD Billion)
      7. 5.6.7. Rest of Latin America
        1. 5.6.7.1. Rest of Latin America K-12 Private Education Market, 2016 – 2026 (USD Billion)
    7. 5.7. The Middle-East and Africa
      1. 5.7.1. The Middle-East and Africa K-12 Private Education Market, 2016 – 2026 (USD Billion)
        1. 5.7.1.1. The Middle-East and Africa K-12 Private Education Market, by Country, 2016 - 2026 (USD Billion)
      2. 5.7.2. The Middle-East and Africa K-12 Private Education Market, by Method, 2016 – 2026
        1. 5.7.2.1. The Middle-East and Africa K-12 Private Education Market, by Method, 2016 – 2026 (USD Billion)
      3. 5.7.3. The Middle-East and Africa K-12 Private Education Market, by Service Providers, 2016 – 2026
        1. 5.7.3.1. The Middle-East and Africa K-12 Private Education Market, by Service Providers, 2016 – 2026 (USD Billion)
      4. 5.7.4. The Middle-East and Africa K-12 Private Education Market, by Application, 2016 – 2026
        1. 5.7.4.1. The Middle-East and Africa K-12 Private Education Market, by Application, 2016 – 2026 (USD Billion)
      5. 5.7.5. GCC Countries
        1. 5.7.5.1. GCC Countries K-12 Private Education Market, 2016 – 2026 (USD Billion)
      6. 5.7.6. South Africa
        1. 5.7.6.1. South Africa K-12 Private Education Market, 2016 – 2026 (USD Billion)
      7. 5.7.7. Rest of Middle-East Africa
        1. 5.7.7.1. Rest of Middle-East Africa K-12 Private Education Market, 2016 – 2026 (USD Billion)
  6. Chapter 6 K-12 Private Education Market – Competitive Landscape
    1. 6.1. Competitor Market Share – Revenue
    2. 6.2. Market Concentration Rate Analysis, Top 3 and Top 5 Players
    3. 6.3. Strategic Developments
      1. 6.3.1. Acquisitions and Mergers
      2. 6.3.2. New Products
      3. 6.3.3. Research & Development Activities
  7. Chapter 7 Company Profiles
    1. 7.1. Nadeen International School
      1. 7.1.1. Company Overview
      2. 7.1.2. Product/Service Portfolio
      3. 7.1.3. Nadeen International School Sales, Revenue, and Gross Margin
      4. 7.1.4. Nadeen International School Revenue and Growth Rate
      5. 7.1.5. Nadeen International School Market Share
      6. 7.1.6. Recent Initiatives, Funding/VC Activities, and Technological Innovations
    2. 7.2. Dhuha International School
      1. 7.2.1. Company Overview
      2. 7.2.2. Product/Service Portfolio
      3. 7.2.3. Dhuha International School Sales, Revenue, and Gross Margin
      4. 7.2.4. Dhuha International School Revenue and Growth Rate
      5. 7.2.5. Dhuha International School Market Share
      6. 7.2.6. Recent Initiatives, Funding/VC Activities, and Technological Innovations
    3. 7.3. Adobe Systems
      1. 7.3.1. Company Overview
      2. 7.3.2. Product/Service Portfolio
      3. 7.3.3. Adobe Systems Sales, Revenue, and Gross Margin
      4. 7.3.4. Adobe Systems Revenue and Growth Rate
      5. 7.3.5. Adobe Systems Market Share
      6. 7.3.6. Recent Initiatives, Funding/VC Activities, and Technological Innovations
    4. 7.4. Blackboard Inc.
      1. 7.4.1. Company Overview
      2. 7.4.2. Product/Service Portfolio
      3. 7.4.3. Blackboard Inc. Sales, Revenue, and Gross Margin
      4. 7.4.4. Blackboard Inc. Revenue and Growth Rate
      5. 7.4.5. Blackboard Inc. Market Share
      6. 7.4.6. Recent Initiatives, Funding/VC Activities, and Technological Innovations
    5. 7.5. British International School of Jeddah
      1. 7.5.1. Company Overview
      2. 7.5.2. Product/Service Portfolio
      3. 7.5.3. British International School of Jeddah Sales, Revenue, and Gross Margin
      4. 7.5.4. British International School of Jeddah Revenue and Growth Rate
      5. 7.5.5. British International School of Jeddah Market Share
      6. 7.5.6. Recent Initiatives, Funding/VC Activities, and Technological Innovations
    6. 7.6. Cengage Learning India Pvt. Ltd.
      1. 7.6.1. Company Overview
      2. 7.6.2. Product/Service Portfolio
      3. 7.6.3. Cengage Learning India Pvt. Ltd. Sales, Revenue, and Gross Margin
      4. 7.6.4. Cengage Learning India Pvt. Ltd. Revenue and Growth Rate
      5. 7.6.5. Cengage Learning India Pvt. Ltd. Market Share
      6. 7.6.6. Recent Initiatives, Funding/VC Activities, and Technological Innovations
    7. 7.7. Educomp Solutions
      1. 7.7.1. Company Overview
      2. 7.7.2. Product/Service Portfolio
      3. 7.7.3. Educomp Solutions Sales, Revenue, and Gross Margin
      4. 7.7.4. Educomp Solutions Revenue and Growth Rate
      5. 7.7.5. Educomp Solutions Market Share
      6. 7.7.6. Recent Initiatives, Funding/VC Activities, and Technological Innovations
    8. 7.8. K12 Inc.
      1. 7.8.1. Company Overview
      2. 7.8.2. Product/Service Portfolio
      3. 7.8.3. K12 Inc. Sales, Revenue, and Gross Margin
      4. 7.8.4. K12 Inc. Revenue and Growth Rate
      5. 7.8.5. K12 Inc. Market Share
      6. 7.8.6. Recent Initiatives, Funding/VC Activities, and Technological Innovations
    9. 7.9. McGraw-Hill Education
      1. 7.9.1. Company Overview
      2. 7.9.2. Product/Service Portfolio
      3. 7.9.3. McGraw-Hill Education Sales, Revenue, and Gross Margin
      4. 7.9.4. McGraw-Hill Education Revenue and Growth Rate
      5. 7.9.5. McGraw-Hill Education Market Share
      6. 7.9.6. Recent Initiatives, Funding/VC Activities, and Technological Innovations
    10. 7.10. Next Education India Pvt. Ltd
      1. 7.10.1. Company Overview
      2. 7.10.2. Product/Service Portfolio
      3. 7.10.3. Next Education India Pvt. Ltd Sales, Revenue, and Gross Margin
      4. 7.10.4. Next Education India Pvt. Ltd Revenue and Growth Rate
      5. 7.10.5. Next Education India Pvt. Ltd Market Share
      6. 7.10.6. Recent Initiatives, Funding/VC Activities, and Technological Innovations
    11. 7.11. Pearson Education Inc.
      1. 7.11.1. Company Overview
      2. 7.11.2. Product/Service Portfolio
      3. 7.11.3. Pearson Education Inc. Sales, Revenue, and Gross Margin
      4. 7.11.4. Pearson Education Inc. Revenue and Growth Rate
      5. 7.11.5. Pearson Education Inc. Market Share
      6. 7.11.6. Recent Initiatives, Funding/VC Activities, and Technological Innovations
    12. 7.12. TAL Education Group
      1. 7.12.1. Company Overview
      2. 7.12.2. Product/Service Portfolio
      3. 7.12.3. TAL Education Group Sales, Revenue, and Gross Margin
      4. 7.12.4. TAL Education Group Revenue and Growth Rate
      5. 7.12.5. TAL Education Group Market Share
      6. 7.12.6. Recent Initiatives, Funding/VC Activities, and Technological Innovations
    13. 7.13. Tata Class Edge
      1. 7.13.1. Company Overview
      2. 7.13.2. Product/Service Portfolio
      3. 7.13.3. Tata Class Edge Sales, Revenue, and Gross Margin
      4. 7.13.4. Tata Class Edge Revenue and Growth Rate
      5. 7.13.5. Tata Class Edge Market Share
      6. 7.13.6. Recent Initiatives, Funding/VC Activities, and Technological Innovations
    14. 7.14. Al- Jazeera Academy
      1. 7.14.1. Company Overview
      2. 7.14.2. Product/Service Portfolio
      3. 7.14.3. Al- Jazeera Academy Sales, Revenue, and Gross Margin
      4. 7.14.4. Al- Jazeera Academy Revenue and Growth Rate
      5. 7.14.5. Al- Jazeera Academy Market Share
      6. 7.14.6. Recent Initiatives, Funding/VC Activities, and Technological Innovations
    15. 7.15. GEMS Education
      1. 7.15.1. Company Overview
      2. 7.15.2. Product/Service Portfolio
      3. 7.15.3. GEMS Education Sales, Revenue, and Gross Margin
      4. 7.15.4. GEMS Education Revenue and Growth Rate
      5. 7.15.5. GEMS Education Market Share
      6. 7.15.6. Recent Initiatives, Funding/VC Activities, and Technological Innovations
    16. 7.16. Dubai International Academy
      1. 7.16.1. Company Overview
      2. 7.16.2. Product/Service Portfolio
      3. 7.16.3. Dubai International Academy Sales, Revenue, and Gross Margin
      4. 7.16.4. Dubai International Academy Revenue and Growth Rate
      5. 7.16.5. Dubai International Academy Market Share
      6. 7.16.6. Recent Initiatives, Funding/VC Activities, and Technological Innovations
    17. 7.17. International School of London
      1. 7.17.1. Company Overview
      2. 7.17.2. Product/Service Portfolio
      3. 7.17.3. International School of London Sales, Revenue, and Gross Margin
      4. 7.17.4. International School of London Revenue and Growth Rate
      5. 7.17.5. International School of London Market Share
      6. 7.17.6. Recent Initiatives, Funding/VC Activities, and Technological Innovations
    18. 7.18. Taaleem
      1. 7.18.1. Company Overview
      2. 7.18.2. Product/Service Portfolio
      3. 7.18.3. Taaleem Sales, Revenue, and Gross Margin
      4. 7.18.4. Taaleem Revenue and Growth Rate
      5. 7.18.5. Taaleem Market Share
      6. 7.18.6. Recent Initiatives, Funding/VC Activities, and Technological Innovations
  8. Chapter 8 K-12 Private Education — Industry Analysis
    1. 8.1. Introduction and Taxonomy
    2. 8.2. K-12 Private Education Market – Key Trends
      1. 8.2.1. Market Drivers
      2. 8.2.2. Market Restraints
      3. 8.2.3. Market Opportunities
    3. 8.3. Value Chain Analysis
    4. 8.4. Key Mandates and Regulations
    5. 8.5. Technology Roadmap and Timeline
    6. 8.6. K-12 Private Education Market – Attractiveness Analysis
      1. 8.6.1. By Method
      2. 8.6.2. By Service Providers
      3. 8.6.3. By Application
      4. 8.6.4. By Region
  9. Chapter 9 Industrial Chain, Sourcing Strategy, and Downstream Buyers
    1. 9.1. K-12 Private Education Industrial Chain Analysis
    2. 9.2. Downstream Buyers
    3. 9.3. Distributors/Traders List
  10. Chapter 10 Marketing Strategy Analysis
    1. 10.1. Marketing Channel
    2. 10.2. Direct Marketing
    3. 10.3. Indirect Marketing
    4. 10.4. Marketing Channel Development Trends
    5. 10.5. Economic/Political Environmental Change
  11. Chapter 11 Report Conclusion & Key Insights
    1. 11.1. Key Insights from Primary Interviews & Surveys Respondents
    2. 11.2. Key Takeaways from Analysts, Consultants, and Industry Leaders
  12. Chapter 12 Research Approach & Methodology
    1. 12.1. Report Description
    2. 12.2. Research Scope
    3. 12.3. Research Methodology
      1. 12.3.1. Secondary Research
      2. 12.3.2. Primary Research
      3. 12.3.3. Statistical Models
        1. 12.3.3.1. Company Share Analysis Model
        2. 12.3.3.2. Revenue Based Modeling
      4. 12.3.4. Research Limitations

      List of Figures

      Fig.1	Product Picture of K-12 Private Education
      Fig.2	Global K-12 Private Education Market, 2016 – 2026 (USD Billion)
      Fig.3	Global K-12 Private Education Market Absolute Revenue Opportunity, 2016 – 2026 (USD Billion)
      Fig.4	Global K-12 Private Education Market Incremental Revenue Opportunity, 2021 – 2026 (USD Billion)
      Fig.5	Global K-12 Private Education Market Share, by Method, 2019 & 2026 (USD Billion)
      Fig.6	Global Blended/instructor led training K-12 Private Education Market, 2016 – 2026 (USD Billion)
      Fig.7	Global Computer/web based training K-12 Private Education Market, 2016 – 2026 (USD Billion)
      Fig.8	Global Text books/self-study material K-12 Private Education Market, 2016 – 2026 (USD Billion)
      Fig.9	Global Video/audio recording K-12 Private Education Market, 2016 – 2026 (USD Billion)
      Fig.10	Global Simulation based training K-12 Private Education Market, 2016 – 2026 (USD Billion)
      Fig.11	Global Others K-12 Private Education Market, 2016 – 2026 (USD Billion)
      Fig.12	Global K-12 Private Education Market Share, by Service Providers, 2019 & 2026 (USD Billion)
      Fig.13	Global Ed-tech companies K-12 Private Education Market, 2016 – 2026 (USD Billion)
      Fig.14	Global Educational institutions K-12 Private Education Market, 2016 – 2026 (USD Billion)
      Fig.15	Global Online courses K-12 Private Education Market, 2016 – 2026 (USD Billion)
      Fig.16	Global Others K-12 Private Education Market, 2016 – 2026 (USD Billion)
      Fig.17	Global K-12 Private Education Market Share, by Application, 2019 & 2026 (USD Billion)
      Fig.18	Global Pre-Primary School K-12 Private Education Market, 2016 – 2026 (USD Billion)
      Fig.19	Global Primary School K-12 Private Education Market, 2016 – 2026 (USD Billion)
      Fig.20	Global Middle School K-12 Private Education Market, 2016 – 2026 (USD Billion)
      Fig.21	Global High School K-12 Private Education Market, 2016 – 2026 (USD Billion)
      Fig.22	Global K-12 Private Education Market Share, by Region, 2019 & 2026 (USD Billion)
      Fig.23	North America K-12 Private Education Market, 2016 – 2026 (USD Billion)
      Fig.24	U.S. K-12 Private Education Market, 2016 – 2026 (USD Billion)
      Fig.25	Canada K-12 Private Education Market, 2016 – 2026 (USD Billion)
      Fig.26	Europe K-12 Private Education Market, 2016 – 2026 (USD Billion)
      Fig.27	Germany K-12 Private Education Market, 2016 – 2026 (USD Billion)
      Fig.28	France K-12 Private Education Market, 2016 – 2026 (USD Billion)
      Fig.29	U.K. K-12 Private Education Market, 2016 – 2026 (USD Billion)
      Fig.30	Italy K-12 Private Education Market, 2016 – 2026 (USD Billion)
      Fig.31	Spain K-12 Private Education Market, 2016 – 2026 (USD Billion)
      Fig.32	Rest of Europe K-12 Private Education Market, 2016 – 2026 (USD Billion)
      Fig.33	Asia Pacific K-12 Private Education Market, 2016 – 2026 (USD Billion)
      Fig.34	China K-12 Private Education Market, 2016 – 2026 (USD Billion)
      Fig.35	Japan K-12 Private Education Market, 2016 – 2026 (USD Billion)
      Fig.36	India K-12 Private Education Market, 2016 – 2026 (USD Billion)
      Fig.37	South Korea K-12 Private Education Market, 2016 – 2026 (USD Billion)
      Fig.38	South-East Asia K-12 Private Education Market, 2016 – 2026 (USD Billion)
      Fig.39	Rest of Asia Pacific K-12 Private Education Market, 2016 – 2026 (USD Billion)
      Fig.40	Latin America K-12 Private Education Market, 2016 – 2026 (USD Billion)
      Fig.41	Brazil K-12 Private Education Market, 2016 – 2026 (USD Billion)
      Fig.42	Mexico K-12 Private Education Market, 2016 – 2026 (USD Billion)
      Fig.43	Rest of Latin America K-12 Private Education Market, 2016 – 2026 (USD Billion)
      Fig.44	The Middle-East and Africa K-12 Private Education Market, 2016 – 2026 (USD Billion)
      Fig.45	GCC Countries K-12 Private Education Market, 2016 – 2026 (USD Billion)
      Fig.46	South Africa K-12 Private Education Market, 2016 – 2026 (USD Billion)
      Fig.47	Rest of Middle-East Africa K-12 Private Education Market, 2016 – 2026 (USD Billion)
      Fig.48	Competitor Market Share – Revenue
      Fig.49	Nadeen International School Revenue and Growth Rate
      Fig.50	Nadeen International School Market Share
      Fig.51	Dhuha International School Revenue and Growth Rate
      Fig.52	Dhuha International School Market Share
      Fig.53	Adobe Systems Revenue and Growth Rate
      Fig.54	Adobe Systems Market Share
      Fig.55	Blackboard Inc. Revenue and Growth Rate
      Fig.56	Blackboard Inc. Market Share
      Fig.57	British International School of Jeddah Revenue and Growth Rate
      Fig.58	British International School of Jeddah Market Share
      Fig.59	Cengage Learning India Pvt. Ltd. Revenue and Growth Rate
      Fig.60	Cengage Learning India Pvt. Ltd. Market Share
      Fig.61	Educomp Solutions Revenue and Growth Rate
      Fig.62	Educomp Solutions Market Share
      Fig.63	K12 Inc. Revenue and Growth Rate
      Fig.64	K12 Inc. Market Share
      Fig.65	McGraw-Hill Education Revenue and Growth Rate
      Fig.66	McGraw-Hill Education Market Share
      Fig.67	Next Education India Pvt. Ltd Revenue and Growth Rate
      Fig.68	Next Education India Pvt. Ltd Market Share
      Fig.69	Pearson Education Inc. Revenue and Growth Rate
      Fig.70	Pearson Education Inc. Market Share
      Fig.71	TAL Education Group Revenue and Growth Rate
      Fig.72	TAL Education Group Market Share
      Fig.73	Tata Class Edge Revenue and Growth Rate
      Fig.74	Tata Class Edge Market Share
      Fig.75	Al- Jazeera Academy Revenue and Growth Rate
      Fig.76	Al- Jazeera Academy Market Share
      Fig.77	GEMS Education Revenue and Growth Rate
      Fig.78	GEMS Education Market Share
      Fig.79	Dubai International Academy Revenue and Growth Rate
      Fig.80	Dubai International Academy Market Share
      Fig.81	International School of London Revenue and Growth Rate
      Fig.82	International School of London Market Share
      Fig.83	Taaleem Revenue and Growth Rate
      Fig.84	Taaleem Market Share
      Fig.85	Market Dynamics
      Fig.86	Global K-12 Private Education – Value Chain Analysis
      Fig.87	Key Mandates and Regulations
      Fig.88	Technology Roadmap and Timeline
      Fig.89	Market Attractiveness Analysis – By Method
      Fig.90	Market Attractiveness Analysis – By Service Providers
      Fig.91	Market Attractiveness Analysis – By Application
      Fig.92	Market Attractiveness Analysis – By Region
      Fig.93	K-12 Private Education Industrial Chain Analysis
      Fig.94	Market Channels
      Fig.95	Marketing Channel Development Trend
      Fig.96	Growth in World Gross Product, 2008-2018 
      

      List of Tables

      Table 1	Global K-12 Private Education Market, 2019 & 2026 (USD Billion)
      Table 2	Global K-12 Private Education Market, by Method, 2016 – 2026 (USD Billion)
      Table 3	Global K-12 Private Education Market, by Service Providers, 2016 – 2026 (USD Billion)
      Table 4	Global K-12 Private Education Market, by Application, 2016 – 2026 (USD Billion)
      Table 5	Global K-12 Private Education Market, by Region, 2016 – 2026 (USD Billion)
      Table 6	North America K-12 Private Education Market, by Country, 2016 – 2026 (USD Billion)
      Table 7	North America K-12 Private Education Market, by Method, 2016 – 2026 (USD Billion)
      Table 8	North America K-12 Private Education Market, by Service Providers, 2016 – 2026 (USD Billion)
      Table 9	North America K-12 Private Education Market, by Application, 2016 – 2026 (USD Billion)
      Table 10 Europe K-12 Private Education Market, by Country, 2016 – 2026 (USD Billion)
      Table 11 Europe K-12 Private Education Market, by Method, 2016 – 2026 (USD Billion)
      Table 12 Europe K-12 Private Education Market, by Service Providers, 2016 – 2026 (USD Billion)
      Table 13 Europe K-12 Private Education Market, by Application, 2016 – 2026 (USD Billion)
      Table 14 Asia Pacific K-12 Private Education Market, by Country, 2016 – 2026 (USD Billion)
      Table 15 Asia Pacific K-12 Private Education Market, by Method, 2016 – 2026 (USD Billion)
      Table 16 Asia Pacific K-12 Private Education Market, by Service Providers, 2016 – 2026 (USD Billion)
      Table 17 Asia Pacific K-12 Private Education Market, by Application, 2016 – 2026 (USD Billion)
      Table 18 Latin America K-12 Private Education Market, by Country, 2016 – 2026 (USD Billion)
      Table 19 Latin America K-12 Private Education Market, by Method, 2016 – 2026 (USD Billion)
      Table 20 Latin America K-12 Private Education Market, by Service Providers, 2016 – 2026 (USD Billion)
      Table 21 Latin America K-12 Private Education Market, by Application, 2016 – 2026 (USD Billion)
      Table 22 The Middle-East and Africa K-12 Private Education Market, by Country, 2016 – 2026 (USD Billion)
      Table 23 The Middle-East and Africa K-12 Private Education Market, by Method, 2016 – 2026 (USD Billion)
      Table 24 The Middle-East and Africa K-12 Private Education Market, by Service Providers, 2016 – 2026 (USD Billion)
      Table 25 The Middle-East and Africa K-12 Private Education Market, by Application, 2016 – 2026 (USD Billion)
      Table 26 Global K-12 Private Education Market - Company Revenue Analysis, 2016 – 2020 (USD Billion)
      Table 27 Global K-12 Private Education Market - Company Revenue Share Analysis, 2016 – 2020 (%)
      Table 28 Acquisitions and Mergers
      Table 29 Market Drivers – Impact Analysis
      Table 30 Market Restraints
      Table 31 Market Opportunities
      Table 32 Major Buyers of K-12 Private Education
      Table 33 Distributors/Traders of K-12 Private Education by Region
      

Industry Major Market Players

  • Nadeen International School
  • Dhuha International School
  • Adobe Systems
  • Blackboard Inc.
  • British International School of Jeddah
  • Cengage Learning India Pvt. Ltd.
  • Educomp Solutions
  • K12 Inc.
  • McGraw-Hill Education
  • Next Education India Pvt. Ltd.
  • Pearson Education Inc.
  • TAL Education Group
  • Tata Class Edge
  • Al- Jazeera Academy
  • GEMS Education
  • Dubai International Academy
  • International School of London
  • Taaleem