Search Market Research Report

Discover Our Latest Reports
Discover Our Featured Reports
Discover Top Selling Reports

Industrial Gases Market Size, Share Global Analysis Report, 2021 – 2026

report img

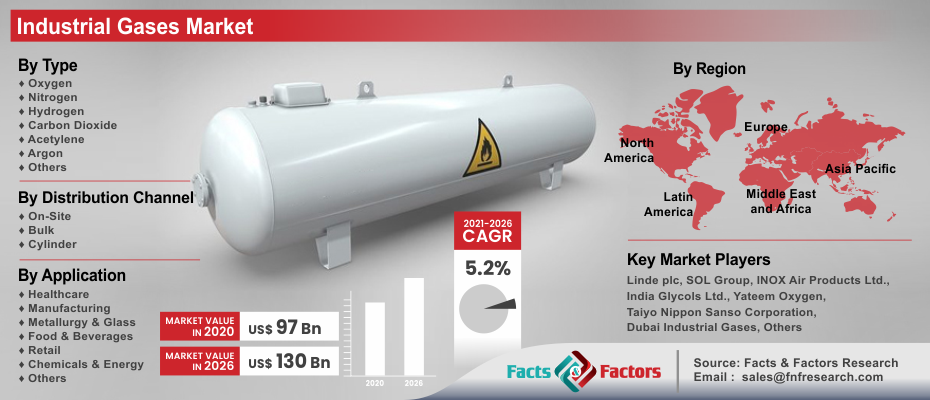
Industrial Gases Market by Type (Oxygen, Nitrogen, Hydrogen, Carbon Dioxide, Acetylene, Argon, and Others), By Application (Healthcare, Manufacturing, Metallurgy & Glass, Food & Beverages, Retail, Chemicals & Energy, and Others), and Distribution Channel (On-Site, Bulk, and Cylinder), By Region: Global & Regional Industry Perspective, Comprehensive Analysis, and Forecast 2021 – 2026

Industry Insights

[230+ Pages Report] According to Facts and Factors, the global industrial gases market was valued at roughly USD 97 Billion in 2020 and is predicted to create revenue of roughly USD 130 Billion by the end of 2026, with a CAGR of roughly 5.2% between 2021 and 2026.

logoMarket Overview

The term "industrial gases" refers to gases generated in large quantities for use in manufacturing operations. These gases are known for their uses as refrigerant, medicinal, specialty gases, and fuel, depending on their use in various industries. Some industrial gases, such as oxygen and helium, are used in artificially ventilated patients' life support systems and modern anesthetic methods. In the transportation business, hydrogen is employed, whereas oxygen is used in gasification plants, hospitals, and steel mills. In addition, liquid helium is used to cool superconductive magnet coil scanners in magnetic resonance imaging (MRI) equipment.

Industrial Gases Market

To know more about this report | Request Free Sample Copy

logo Key Trends

With the increase in industrial activity, the number of production facilities producing various types of industrial gases for various industries is rising. In both emerging and developed nations, this drives the industrial gas market. Industrial gases such as cutting and welding gases are in high demand in metalworking and welding applications due to the rapid growth of infrastructure and construction activities in emerging nations. Global warming and ozone depletion are also caused by the release of industrial gases into the atmosphere. As a result, producers and regulatory authorities have a problem in avoiding and adopting natural-based industrial gases, as well as the necessity for skilled personnel when working with flammable gases. Climate change, health care demands, energy demand, and expanding infrastructure projects have raised awareness of the need to develop sustainable industrial gases.

logoSegmentation Analysis

The global industrial gases market is divided based on type, application, distribution channel, and region

Based on type the market is bifurcated into nitrogen, carbon dioxide, argon, oxygen, hydrogen, acetylene, and others. Oxygen dominated the type segment in 2020 with a revenue market share of around 30%. This can be attributed to increased demand from healthcare facilities globally due to the COVID-19 pandemic. Oxygen is utilized in the treatment of contaminated water and hazardous wastes, as well as in the coal gasification process. In order to decrease pollution, the gas can also be used to substitute chlorine in the pulp and paper sector. Oxygen is also used extensively in the medical field. As a result, the widespread use of oxygen in many industries is projected to drive up industrial oxygen demand in the upcoming years.

Based on the application the market is segregated into manufacturing, food & beverages, chemicals & energy, healthcare, metallurgy & glass, retail, and others. The manufacturing segment accounted for a revenue market share of around 27% in 2020 and is anticipated to grow at a significant rate in the upcoming years. Because of the increasing manufacturing industries in Brazil, India, South Korea, and China, demand for industrial gases such as hydrogen, carbon dioxide, oxygen, and nitrogen is expected to increase significantly in emerging countries. The electronic industry's rising need for sophisticated industrial gases is likely to push this segment's expansion even further.

Based on the distribution channel, the market is bifurcated into the cylinder, bulk, and on-site. The cylinder accounted for a revenue share of around 35% in 2020 dominating the distribution channel segment. However, the on-site is anticipated to grow rapidly in the upcoming years. Because on-site generation eliminates numerous issues associated with hydrogen transportation and distribution, the industry is projected to expand significantly. In small-scale enterprises, on-site hydrogen generation has grown in favor as new technologies have become more inexpensive compared to provided dispersed routes.

logoIndustrial Gases Market: Report Scope

Report Attribute

Details

Market Size in 2020

USD 97 Billion

Projected Market Size in 2026

USD 130 Billion

CAGR Growth Rate

5.2%

Base Year

2020

Forecast Years

2021-226

Key Market Players

Linde plc, SOL Group, INOX Air Products Ltd., India Glycols Ltd., Yateem Oxygen, Taiyo Nippon Sanso Corporation, Dubai Industrial Gases, Sicgil India Limited, Mohammed Hamad Al Mana Group, Tripti Gases Pvt. Ltd., Air Liquide, Air Products and Chemicals, Inc.Ellenbarrie Industrial Gases Ltd., Iwatani Corporation, Abdullah Hashim Industrial Gases & Equipment Co. Ltd, Buzwair Industrial Gases Factory, Gulf Cryo, Bristol Gases – Concorde Corodex Group, Bhuruka Gases Ltd., The Southern Gas Ltd., and Mohsin Haider Darwish LLC amongst others.

Key Segments

Type, Application, Distribution Channel, and Regions

Major Regions Covered

North America, Europe, Asia Pacific, Latin America, and Middle East & Africa

Purchase Options

Request customized purchase options to meet your research needs. Explore purchase options

logo Regional Analysis

Asia Pacific region dominated the industrial gases market with a revenue share in 2020 of around 35% and is anticipated to continue its dominance in the upcoming years. The growing demand for industrial gases is due to increasing demand from developing and developed economies in the region such as India, China, Japan, and South Korea. The growing demand from end-user industries in these countries is one of the driving factors for the industrial gases market in the Asia Pacific. The aerospace industry demands high-quality gas solutions and the growing Aerospace industry in the region is driving the market for industrial gases. China dominated the Asia Pacific market in 2020. Growing demand for iron and steel from a variety of sectors, as well as new steel ventures, along with government measures to promote the industrial sector, are projected to increase the use of mechanical gas generation units to meet the mass requirements for modern gases. Growing economies such as India and China are anticipated to generate lucrative opportunities for the industrial gases market in the Asia Pacific region.

logo Competitive Players

Some main participants of the global industrial gases market are :

  • Linde plc
  • SOL Group
  • INOX Air Products Ltd.
  • India Glycols Ltd.
  • Yateem Oxygen
  • Taiyo Nippon Sanso Corporation
  • Dubai Industrial Gases
  • Sicgil India Limited
  • Mohammed Hamad Al Mana Group
  • Tripti Gases Pvt. Ltd.
  • Air Liquide
  • Air Products and Chemicals Inc.
  • Ellenbarrie Industrial Gases Ltd.
  • Iwatani Corporation
  • Abdullah Hashim Industrial Gases & Equipment Co. Ltd
  • Buzwair Industrial Gases Factory
  • Gulf Cryo
  • Bristol Gases – Concorde Corodex Group
  • Bhuruka Gases Ltd.
  • The Southern Gas Ltd.
  • Mohsin Haider Darwish LLC

logoBy Type:

  • Oxygen
  • Nitrogen
  • Hydrogen
  • Carbon Dioxide
  • Acetylene
  • Argon
  • Others

logoBy Application:

  • Healthcare
  • Manufacturing
  • Metallurgy & Glass
  • Food & Beverages
  • Retail
  • Chemicals & Energy
  • Others

logoBy Distribution Channel:

  • On-Site
  • Bulk
  • Cylinder

logoBy Region:

  • North America
    • U.S.
    • Canada
  • Europe
    • France
    • UK
    • Spain
    • Germany
    • Italy
    • Rest of Europe
  • Asia Pacific
    • China
    • Japan
    • India
    • South Korea
    • Southeast Asia
    • Rest of Asia Pacific
  • Latin America
    • Brazil
    • Mexico
    • Rest of Latin America
  • Middle East & Africa
    • GCC Countries
    • South Africa
    • Rest of Middle East & Africa

Table of Content

  1. Chapter 1 Executive Summary
    1. 1.1. Introduction of Industrial Gases
    2. 1.2. Global Industrial Gases Market, 2020 & 2026 (USD Million)
    3. 1.3. Global Industrial Gases Market, 2016 – 2026 (USD Million) (Million SCF)
    4. 1.4. Global Industrial Gases Market Absolute Revenue Opportunity, 2016 – 2026 (USD Million)
    5. 1.5. Global Industrial Gases Market Incremental Revenue Opportunity, 2020 – 2026 (USD Million)
  2. Chapter 2 Industrial Gases Market – Type Analysis
    1. 2.1. Global Industrial Gases Market – Type Overview
    2. 2.2. Global Industrial Gases Market Share, by Type, 2020 & 2026 (USD Million)
    3. 2.3. Global Industrial Gases Market share, by Type, 2020 & 2026 (Million SCF)
    4. 2.4. Oxygen
      1. 2.4.1. Global Oxygen Industrial Gases Market, 2016 – 2026 (USD Million)
      2. 2.4.2. Global Oxygen Industrial Gases Market, 2016 – 2026 (Million SCF)
    5. 2.5. Nitrogen
      1. 2.5.1. Global Nitrogen Industrial Gases Market, 2016 – 2026 (USD Million)
      2. 2.5.2. Global Nitrogen Industrial Gases Market, 2016 – 2026 (Million SCF)
    6. 2.6. Hydrogen
      1. 2.6.1. Global Hydrogen Industrial Gases Market, 2016 – 2026 (USD Million)
      2. 2.6.2. Global Hydrogen Industrial Gases Market, 2016 – 2026 (Million SCF)
    7. 2.7. Carbon Dioxide
      1. 2.7.1. Global Carbon Dioxide Industrial Gases Market, 2016 – 2026 (USD Million)
      2. 2.7.2. Global Carbon Dioxide Industrial Gases Market, 2016 – 2026 (Million SCF)
    8. 2.8. Acetylene
      1. 2.8.1. Global Acetylene Industrial Gases Market, 2016 – 2026 (USD Million)
      2. 2.8.2. Global Acetylene Industrial Gases Market, 2016 – 2026 (Million SCF)
    9. 2.9. Argon
      1. 2.9.1. Global Argon Industrial Gases Market, 2016 – 2026 (USD Million)
      2. 2.9.2. Global Argon Industrial Gases Market, 2016 – 2026 (Million SCF)
    10. 2.10. Others
      1. 2.10.1. Global Others Industrial Gases Market, 2016 – 2026 (USD Million)
      2. 2.10.2. Global Others Industrial Gases Market, 2016 – 2026 (Million SCF)
  3. Chapter 3 Industrial Gases Market – Application Analysis
    1. 3.1. Global Industrial Gases Market – Application Overview
    2. 3.2. Global Industrial Gases Market Share, by Application, 2020 & 2026 (USD Million)
    3. 3.3. Global Industrial Gases Market share, by Application, 2020 & 2026 (Million SCF)
    4. 3.4. Healthcare
      1. 3.4.1. Global Healthcare Industrial Gases Market, 2016 – 2026 (USD Million)
      2. 3.4.2. Global Healthcare Industrial Gases Market, 2016 – 2026 (Million SCF)
    5. 3.5. Manufacturing
      1. 3.5.1. Global Manufacturing Industrial Gases Market, 2016 – 2026 (USD Million)
      2. 3.5.2. Global Manufacturing Industrial Gases Market, 2016 – 2026 (Million SCF)
    6. 3.6. Metallurgy & Glass
      1. 3.6.1. Global Metallurgy & Glass Industrial Gases Market, 2016 – 2026 (USD Million)
      2. 3.6.2. Global Metallurgy & Glass Industrial Gases Market, 2016 – 2026 (Million SCF)
    7. 3.7. Food & Beverages
      1. 3.7.1. Global Food & Beverages Industrial Gases Market, 2016 – 2026 (USD Million)
      2. 3.7.2. Global Food & Beverages Industrial Gases Market, 2016 – 2026 (Million SCF)
    8. 3.8. Retail
      1. 3.8.1. Global Retail Industrial Gases Market, 2016 – 2026 (USD Million)
      2. 3.8.2. Global Retail Industrial Gases Market, 2016 – 2026 (Million SCF)
    9. 3.9. Chemicals & Energy
      1. 3.9.1. Global Chemicals & Energy Industrial Gases Market, 2016 – 2026 (USD Million)
      2. 3.9.2. Global Chemicals & Energy Industrial Gases Market, 2016 – 2026 (Million SCF)
    10. 3.10. Others
      1. 3.10.1. Global Others Industrial Gases Market, 2016 – 2026 (USD Million)
      2. 3.10.2. Global Others Industrial Gases Market, 2016 – 2026 (Million SCF)
  4. Chapter 4 Industrial Gases Market – Distribution Channel Analysis
    1. 4.1. Global Industrial Gases Market – Distribution Channel Overview
    2. 4.2. Global Industrial Gases Market Share, by Distribution Channel, 2020 & 2026 (USD Million)
    3. 4.3. Global Industrial Gases Market share, by Distribution Channel, 2020 & 2026 (Million SCF)
    4. 4.4. On-Site
      1. 4.4.1. Global On-Site Industrial Gases Market, 2016 – 2026 (USD Million)
      2. 4.4.2. Global On-Site Industrial Gases Market, 2016 – 2026 (Million SCF)
    5. 4.5. Bulk
      1. 4.5.1. Global Bulk Industrial Gases Market, 2016 – 2026 (USD Million)
      2. 4.5.2. Global Bulk Industrial Gases Market, 2016 – 2026 (Million SCF)
    6. 4.6. Cylinder
      1. 4.6.1. Global Cylinder Industrial Gases Market, 2016 – 2026 (USD Million)
      2. 4.6.2. Global Cylinder Industrial Gases Market, 2016 – 2026 (Million SCF)
  5. Chapter 5 Industrial Gases Market – Regional Analysis
    1. 5.1. Global Industrial Gases Market Regional Overview
    2. 5.2. Global Industrial Gases Market Share, by Region, 2020 & 2026 (USD Million)
    3. 5.3. Global Industrial Gases Market Share, by Region, 2020 & 2026 (Million SCF)
    4. 5.4. North America
      1. 5.4.1. North America Industrial Gases Market, 2016 – 2026 (USD Million)
        1. 5.4.1.1. North America Industrial Gases Market, by Country, 2016 – 2026 (USD Million)
      2. 5.4.2. North America Market, 2016 – 2026 (Million SCF)
        1. 5.4.2.1. North America Industrial Gases Market, by Country, 2016 – 2026 (Million SCF)
      3. 5.4.3. North America Industrial Gases Market, by Type, 2016 – 2026
        1. 5.4.3.1. North America Industrial Gases Market, by Type, 2016 – 2026 (USD Million)
        2. 5.4.3.2. North America Industrial Gases Market, by Type, 2016 – 2026 (Million SCF)
      4. 5.4.4. North America Industrial Gases Market, by Application, 2016 – 2026
        1. 5.4.4.1. North America Industrial Gases Market, by Application, 2016 – 2026 (USD Million)
        2. 5.4.4.2. North America Industrial Gases Market, by Application, 2016 – 2026 (Million SCF)
      5. 5.4.5. North America Industrial Gases Market, by Distribution Channel, 2016 – 2026
        1. 5.4.5.1. North America Industrial Gases Market, by Distribution Channel, 2016 – 2026 (USD Million)
        2. 5.4.5.2. North America Industrial Gases Market, by Distribution Channel, 2016 – 2026 (Million SCF)
      6. 5.4.6. U.S.
        1. 5.4.6.1. U.S. Industrial Gases Market, 2016 – 2026 (USD Million)
        2. 5.4.6.2. U.S. Industrial Gases Market, 2016 – 2026 (Million SCF)
      7. 5.4.7. Canada
        1. 5.4.7.1. Canada Industrial Gases Market, 2016 – 2026 (USD Million)
        2. 5.4.7.2. Canada Industrial Gases Market, 2016 – 2026 (Million SCF)
    5. 5.5. Europe
      1. 5.5.1. Europe Industrial Gases Market, 2016 – 2026 (USD Million)
        1. 5.5.1.1. Europe Industrial Gases Market, by Country, 2016 – 2026 (USD Million)
      2. 5.5.2. Europe Market, 2016 – 2026 (Million SCF)
        1. 5.5.2.1. Europe Industrial Gases Market, by Country, 2016 – 2026 (Million SCF)
      3. 5.5.3. Europe Industrial Gases Market, by Type, 2016 – 2026
        1. 5.5.3.1. Europe Industrial Gases Market, by Type, 2016 – 2026 (USD Million)
        2. 5.5.3.2. Europe Industrial Gases Market, by Type, 2016 – 2026 (Million SCF)
      4. 5.5.4. Europe Industrial Gases Market, by Application, 2016 – 2026
        1. 5.5.4.1. Europe Industrial Gases Market, by Application, 2016 – 2026 (USD Million)
        2. 5.5.4.2. Europe Industrial Gases Market, by Application, 2016 – 2026 (Million SCF)
      5. 5.5.5. Europe Industrial Gases Market, by Distribution Channel, 2016 – 2026
        1. 5.5.5.1. Europe Industrial Gases Market, by Distribution Channel, 2016 – 2026 (USD Million)
        2. 5.5.5.2. Europe Industrial Gases Market, by Distribution Channel, 2016 – 2026 (Million SCF)
      6. 5.5.6. Germany
        1. 5.5.6.1. Germany Industrial Gases Market, 2016 – 2026 (USD Million)
        2. 5.5.6.2. Germany Industrial Gases Market, 2016 – 2026 (Million SCF)
      7. 5.5.7. France
        1. 5.5.7.1. France Industrial Gases Market, 2016 – 2026 (USD Million)
        2. 5.5.7.2. France Industrial Gases Market, 2016 – 2026 (Million SCF)
      8. 5.5.8. U.K.
        1. 5.5.8.1. U.K. Industrial Gases Market, 2016 – 2026 (USD Million)
        2. 5.5.8.2. U.K. Industrial Gases Market, 2016 – 2026 (Million SCF)
      9. 5.5.9. Italy
        1. 5.5.9.1. Italy Industrial Gases Market, 2016 – 2026 (USD Million)
        2. 5.5.9.2. Italy Industrial Gases Market, 2016 – 2026 (Million SCF)
      10. 5.5.10. Spain
        1. 5.5.10.1. Spain Industrial Gases Market, 2016 – 2026 (USD Million)
        2. 5.5.10.2. Spain Industrial Gases Market, 2016 – 2026 (Million SCF)
      11. 5.5.11. Rest of Europe
        1. 5.5.11.1. Rest of Europe Industrial Gases Market, 2016 – 2026 (USD Million)
        2. 5.5.11.2. Rest of Europe Industrial Gases Market, 2016 – 2026 (Million SCF)
    6. 5.6. Asia Pacific
      1. 5.6.1. Asia Pacific Industrial Gases Market, 2016 – 2026 (USD Million)
        1. 5.6.1.1. Asia Pacific Industrial Gases Market, by Country, 2016 – 2026 (USD Million)
      2. 5.6.2. Asia Pacific Market, 2016 – 2026 (Million SCF)
        1. 5.6.2.1. Asia Pacific Industrial Gases Market, by Country, 2016 – 2026 (Million SCF)
      3. 5.6.3. Asia Pacific Industrial Gases Market, by Type, 2016 – 2026
        1. 5.6.3.1. Asia Pacific Industrial Gases Market, by Type, 2016 – 2026 (USD Million)
        2. 5.6.3.2. Asia Pacific Industrial Gases Market, by Type, 2016 – 2026 (Million SCF)
      4. 5.6.4. Asia Pacific Industrial Gases Market, by Application, 2016 – 2026
        1. 5.6.4.1. Asia Pacific Industrial Gases Market, by Application, 2016 – 2026 (USD Million)
        2. 5.6.4.2. Asia Pacific Industrial Gases Market, by Application, 2016 – 2026 (Million SCF)
      5. 5.6.5. Asia Pacific Industrial Gases Market, by Distribution Channel, 2016 – 2026
        1. 5.6.5.1. Asia Pacific Industrial Gases Market, by Distribution Channel, 2016 – 2026 (USD Million)
        2. 5.6.5.2. Asia Pacific Industrial Gases Market, by Distribution Channel, 2016 – 2026 (Million SCF)
      6. 5.6.6. China
        1. 5.6.6.1. China Industrial Gases Market, 2016 – 2026 (USD Million)
        2. 5.6.6.2. China Industrial Gases Market, 2016 – 2026 (Million SCF)
      7. 5.6.7. Japan
        1. 5.6.7.1. Japan Industrial Gases Market, 2016 – 2026 (USD Million)
        2. 5.6.7.2. Japan Industrial Gases Market, 2016 – 2026 (Million SCF)
      8. 5.6.8. India
        1. 5.6.8.1. India Industrial Gases Market, 2016 – 2026 (USD Million)
        2. 5.6.8.2. India Industrial Gases Market, 2016 – 2026 (Million SCF)
      9. 5.6.9. South Korea
        1. 5.6.9.1. South Korea Industrial Gases Market, 2016 – 2026 (USD Million)
        2. 5.6.9.2. South Korea Industrial Gases Market, 2016 – 2026 (Million SCF)
      10. 5.6.10. South-East Asia
        1. 5.6.10.1. South-East Asia Industrial Gases Market, 2016 – 2026 (USD Million)
        2. 5.6.10.2. South-East Asia Industrial Gases Market, 2016 – 2026 (Million SCF)
      11. 5.6.11. Rest of Asia Pacific
        1. 5.6.11.1. Rest of Asia Pacific Industrial Gases Market, 2016 – 2026 (USD Million)
        2. 5.6.11.2. Rest of Asia Pacific Industrial Gases Market, 2016 – 2026 (Million SCF)
    7. 5.7. Latin America
      1. 5.7.1. Latin America Industrial Gases Market, 2016 – 2026 (USD Million)
        1. 5.7.1.1. Latin America Industrial Gases Market, by Country, 2016 – 2026 (USD Million)
      2. 5.7.2. Latin America Market, 2016 – 2026 (Million SCF)
        1. 5.7.2.1. Latin America Industrial Gases Market, by Country, 2016 – 2026 (Million SCF)
      3. 5.7.3. Latin America Industrial Gases Market, by Type, 2016 – 2026
        1. 5.7.3.1. Latin America Industrial Gases Market, by Type, 2016 – 2026 (USD Million)
        2. 5.7.3.2. Latin America Industrial Gases Market, by Type, 2016 – 2026 (Million SCF)
      4. 5.7.4. Latin America Industrial Gases Market, by Application, 2016 – 2026
        1. 5.7.4.1. Latin America Industrial Gases Market, by Application, 2016 – 2026 (USD Million)
        2. 5.7.4.2. Latin America Industrial Gases Market, by Application, 2016 – 2026 (Million SCF)
      5. 5.7.5. Latin America Industrial Gases Market, by Distribution Channel, 2016 – 2026
        1. 5.7.5.1. Latin America Industrial Gases Market, by Distribution Channel, 2016 – 2026 (USD Million)
        2. 5.7.5.2. Latin America Industrial Gases Market, by Distribution Channel, 2016 – 2026 (Million SCF)
      6. 5.7.6. Brazil
        1. 5.7.6.1. Brazil Industrial Gases Market, 2016 – 2026 (USD Million)
        2. 5.7.6.2. Brazil Industrial Gases Market, 2016 – 2026 (Million SCF)
      7. 5.7.7. Mexico
        1. 5.7.7.1. Mexico Industrial Gases Market, 2016 – 2026 (USD Million)
        2. 5.7.7.2. Mexico Industrial Gases Market, 2016 – 2026 (Million SCF)
      8. 5.7.8. Rest of Latin America
        1. 5.7.8.1. Rest of Latin America Industrial Gases Market, 2016 – 2026 (USD Million)
        2. 5.7.8.2. Rest of Latin America Industrial Gases Market, 2016 – 2026 (Million SCF)
    8. 5.8. The Middle-East and Africa
      1. 5.8.1. The Middle-East and Africa Industrial Gases Market, 2016 – 2026 (USD Million)
        1. 5.8.1.1. The Middle-East and Africa Industrial Gases Market, by Country, 2016 – 2026 (USD Million)
      2. 5.8.2. The Middle-East and Africa Market, 2016 – 2026 (Million SCF)
        1. 5.8.2.1. The Middle-East and Africa Industrial Gases Market, by Country, 2016 – 2026 (Million SCF)
      3. 5.8.3. The Middle-East and Africa Industrial Gases Market, by Type, 2016 – 2026
        1. 5.8.3.1. The Middle-East and Africa Industrial Gases Market, by Type, 2016 – 2026 (USD Million)
        2. 5.8.3.2. The Middle-East and Africa Industrial Gases Market, by Type, 2016 – 2026 (Million SCF)
      4. 5.8.4. The Middle-East and Africa Industrial Gases Market, by Application, 2016 – 2026
        1. 5.8.4.1. The Middle-East and Africa Industrial Gases Market, by Application, 2016 – 2026 (USD Million)
        2. 5.8.4.2. The Middle-East and Africa Industrial Gases Market, by Application, 2016 – 2026 (Million SCF)
      5. 5.8.5. The Middle-East and Africa Industrial Gases Market, by Distribution Channel, 2016 – 2026
        1. 5.8.5.1. The Middle-East and Africa Industrial Gases Market, by Distribution Channel, 2016 – 2026 (USD Million)
        2. 5.8.5.2. The Middle-East and Africa Industrial Gases Market, by Distribution Channel, 2016 – 2026 (Million SCF)
      6. 5.8.6. GCC Countries
        1. 5.8.6.1. GCC Countries Industrial Gases Market, 2016 – 2026 (USD Million)
        2. 5.8.6.2. GCC Countries Industrial Gases Market, 2016 – 2026 (Million SCF)
      7. 5.8.7. South Africa
        1. 5.8.7.1. South Africa Industrial Gases Market, 2016 – 2026 (USD Million)
        2. 5.8.7.2. South Africa Industrial Gases Market, 2016 – 2026 (Million SCF)
      8. 5.8.8. Rest of Middle-East Africa
        1. 5.8.8.1. Rest of Middle-East Africa Industrial Gases Market, 2016 – 2026 (USD Million)
        2. 5.8.8.2. Rest of Middle-East Africa Industrial Gases Market, 2016 – 2026 (Million SCF)
  6. Chapter 6 Industrial Gases Production, Consumption, Export, Import by Regions
    1. 6.1. Global Industrial Gases Production and Consumption, 2016 – 2026 (Million SCF)
    2. 6.2. Global Import and Export Analysis, by Region
  7. Chapter 7 Industrial Gases Market – Competitive Landscape
    1. 7.1. Competitor Market Share – Revenue
    2. 7.2. Market Concentration Rate Analysis, Top 3 and Top 5 Players
    3. 7.3. Competitor Market Share – Volume
    4. 7.4. Strategic Developments
      1. 7.4.1. Acquisitions and Mergers
      2. 7.4.2. New Products
      3. 7.4.3. Research & Development Activities
  8. Chapter 8 Company Profiles
    1. 8.1. Air Liquide
      1. 8.1.1. Company Overview
      2. 8.1.2. Product/Service Portfolio
      3. 8.1.3. Air Liquide Sales, Revenue, Price, and Gross Margin
      4. 8.1.4. Air Liquide Revenue and Growth Rate
      5. 8.1.5. Air Liquide Market Share
      6. 8.1.6. Recent Initiatives, Funding/VC Activities, and Technological Innovations
    2. 8.2. Linde plc
      1. 8.2.1. Company Overview
      2. 8.2.2. Product/Service Portfolio
      3. 8.2.3. Linde plc Sales, Revenue, Price, and Gross Margin
      4. 8.2.4. Linde plc Revenue and Growth Rate
      5. 8.2.5. Linde plc Market Share
      6. 8.2.6. Recent Initiatives, Funding/VC Activities, and Technological Innovations
    3. 8.3. Air Products and Chemicals, Inc.
      1. 8.3.1. Company Overview
      2. 8.3.2. Product/Service Portfolio
      3. 8.3.3. Air Products and Chemicals, Inc. Sales, Revenue, Price, and Gross Margin
      4. 8.3.4. Air Products and Chemicals, Inc. Revenue and Growth Rate
      5. 8.3.5. Air Products and Chemicals, Inc. Market Share
      6. 8.3.6. Recent Initiatives, Funding/VC Activities, and Technological Innovations
    4. 8.4. Taiyo Nippon Sanso Corporation
      1. 8.4.1. Company Overview
      2. 8.4.2. Product/Service Portfolio
      3. 8.4.3. Taiyo Nippon Sanso Corporation Sales, Revenue, Price, and Gross Margin
      4. 8.4.4. Taiyo Nippon Sanso Corporation Revenue and Growth Rate
      5. 8.4.5. Taiyo Nippon Sanso Corporation Market Share
      6. 8.4.6. Recent Initiatives, Funding/VC Activities, and Technological Innovations
    5. 8.5. Messer Group GmbH
      1. 8.5.1. Company Overview
      2. 8.5.2. Product/Service Portfolio
      3. 8.5.3. Messer Group GmbH Sales, Revenue, Price, and Gross Margin
      4. 8.5.4. Messer Group GmbH Revenue and Growth Rate
      5. 8.5.5. Messer Group GmbH Market Share
      6. 8.5.6. Recent Initiatives, Funding/VC Activities, and Technological Innovations
    6. 8.6. SOL Group
      1. 8.6.1. Company Overview
      2. 8.6.2. Product/Service Portfolio
      3. 8.6.3. SOL Group Sales, Revenue, Price, and Gross Margin
      4. 8.6.4. SOL Group Revenue and Growth Rate
      5. 8.6.5. SOL Group Market Share
      6. 8.6.6. Recent Initiatives, Funding/VC Activities, and Technological Innovations
    7. 8.7. Matheson Tri-Gas, Inc.
      1. 8.7.1. Company Overview
      2. 8.7.2. Product/Service Portfolio
      3. 8.7.3. Matheson Tri-Gas, Inc. Sales, Revenue, Price, and Gross Margin
      4. 8.7.4. Matheson Tri-Gas, Inc. Revenue and Growth Rate
      5. 8.7.5. Matheson Tri-Gas, Inc. Market Share
      6. 8.7.6. Recent Initiatives, Funding/VC Activities, and Technological Innovations
    8. 8.8. INOX Air Products Ltd.
      1. 8.8.1. Company Overview
      2. 8.8.2. Product/Service Portfolio
      3. 8.8.3. INOX Air Products Ltd. Sales, Revenue, Price, and Gross Margin
      4. 8.8.4. INOX Air Products Ltd. Revenue and Growth Rate
      5. 8.8.5. INOX Air Products Ltd. Market Share
      6. 8.8.6. Recent Initiatives, Funding/VC Activities, and Technological Innovations
    9. 8.9. Iwatani Corporation
      1. 8.9.1. Company Overview
      2. 8.9.2. Product/Service Portfolio
      3. 8.9.3. Iwatani Corporation Sales, Revenue, Price, and Gross Margin
      4. 8.9.4. Iwatani Corporation Revenue and Growth Rate
      5. 8.9.5. Iwatani Corporation Market Share
      6. 8.9.6. Recent Initiatives, Funding/VC Activities, and Technological Innovations
    10. 8.10. India Glycols Ltd.
      1. 8.10.1. Company Overview
      2. 8.10.2. Product/Service Portfolio
      3. 8.10.3. India Glycols Ltd. Sales, Revenue, Price, and Gross Margin
      4. 8.10.4. India Glycols Ltd. Revenue and Growth Rate
      5. 8.10.5. India Glycols Ltd. Market Share
      6. 8.10.6. Recent Initiatives, Funding/VC Activities, and Technological Innovations
    11. 8.11. Abdullah Hashim Industrial Gases & Equipment Co. Ltd
      1. 8.11.1. Company Overview
      2. 8.11.2. Product/Service Portfolio
      3. 8.11.3. Abdullah Hashim Industrial Gases & Equipment Co. Ltd Sales, Revenue, Price, and Gross Margin
      4. 8.11.4. Abdullah Hashim Industrial Gases & Equipment Co. Ltd Revenue and Growth Rate
      5. 8.11.5. Abdullah Hashim Industrial Gases & Equipment Co. Ltd Market Share
      6. 8.11.6. Recent Initiatives, Funding/VC Activities, and Technological Innovations
    12. 8.12. Yateem Oxygen
      1. 8.12.1. Company Overview
      2. 8.12.2. Product/Service Portfolio
      3. 8.12.3. Yateem Oxygen Sales, Revenue, Price, and Gross Margin
      4. 8.12.4. Yateem Oxygen Revenue and Growth Rate
      5. 8.12.5. Yateem Oxygen Market Share
      6. 8.12.6. Recent Initiatives, Funding/VC Activities, and Technological Innovations
    13. 8.13. Buzwair Industrial Gases Factory
      1. 8.13.1. Company Overview
      2. 8.13.2. Product/Service Portfolio
      3. 8.13.3. Buzwair Industrial Gases Factory Sales, Revenue, Price, and Gross Margin
      4. 8.13.4. Buzwair Industrial Gases Factory Revenue and Growth Rate
      5. 8.13.5. Buzwair Industrial Gases Factory Market Share
      6. 8.13.6. Recent Initiatives, Funding/VC Activities, and Technological Innovations
    14. 8.14. Dubai Industrial Gases
      1. 8.14.1. Company Overview
      2. 8.14.2. Product/Service Portfolio
      3. 8.14.3. Dubai Industrial Gases Sales, Revenue, Price, and Gross Margin
      4. 8.14.4. Dubai Industrial Gases Revenue and Growth Rate
      5. 8.14.5. Dubai Industrial Gases Market Share
      6. 8.14.6. Recent Initiatives, Funding/VC Activities, and Technological Innovations
    15. 8.15. Gulf Cryo
      1. 8.15.1. Company Overview
      2. 8.15.2. Product/Service Portfolio
      3. 8.15.3. Gulf Cryo Sales, Revenue, Price, and Gross Margin
      4. 8.15.4. Gulf Cryo Revenue and Growth Rate
      5. 8.15.5. Gulf Cryo Market Share
      6. 8.15.6. Recent Initiatives, Funding/VC Activities, and Technological Innovations
    16. 8.16. Ellenbarrie Industrial Gases Ltd.
      1. 8.16.1. Company Overview
      2. 8.16.2. Product/Service Portfolio
      3. 8.16.3. Ellenbarrie Industrial Gases Ltd. Sales, Revenue, Price, and Gross Margin
      4. 8.16.4. Ellenbarrie Industrial Gases Ltd. Revenue and Growth Rate
      5. 8.16.5. Ellenbarrie Industrial Gases Ltd. Market Share
      6. 8.16.6. Recent Initiatives, Funding/VC Activities, and Technological Innovations
    17. 8.17. Bristol Gases – Concorde Corodex Group
      1. 8.17.1. Company Overview
      2. 8.17.2. Product/Service Portfolio
      3. 8.17.3. Bristol Gases – Concorde Corodex Group Sales, Revenue, Price, and Gross Margin
      4. 8.17.4. Bristol Gases – Concorde Corodex Group Revenue and Growth Rate
      5. 8.17.5. Bristol Gases – Concorde Corodex Group Market Share
      6. 8.17.6. Recent Initiatives, Funding/VC Activities, and Technological Innovations
    18. 8.18. Sicgil India Limited
      1. 8.18.1. Company Overview
      2. 8.18.2. Product/Service Portfolio
      3. 8.18.3. Sicgil India Limited Sales, Revenue, Price, and Gross Margin
      4. 8.18.4. Sicgil India Limited Revenue and Growth Rate
      5. 8.18.5. Sicgil India Limited Market Share
      6. 8.18.6. Recent Initiatives, Funding/VC Activities, and Technological Innovations
    19. 8.19. Bhuruka Gases Ltd.
      1. 8.19.1. Company Overview
      2. 8.19.2. Product/Service Portfolio
      3. 8.19.3. Bhuruka Gases Ltd. Sales, Revenue, Price, and Gross Margin
      4. 8.19.4. Bhuruka Gases Ltd. Revenue and Growth Rate
      5. 8.19.5. Bhuruka Gases Ltd. Market Share
      6. 8.19.6. Recent Initiatives, Funding/VC Activities, and Technological Innovations
    20. 8.20. Mohammed Hamad Al Mana Group
      1. 8.20.1. Company Overview
      2. 8.20.2. Product/Service Portfolio
      3. 8.20.3. Mohammed Hamad Al Mana Group Sales, Revenue, Price, and Gross Margin
      4. 8.20.4. Mohammed Hamad Al Mana Group Revenue and Growth Rate
      5. 8.20.5. Mohammed Hamad Al Mana Group Market Share
      6. 8.20.6. Recent Initiatives, Funding/VC Activities, and Technological Innovations
    21. 8.21. The Southern Gas Ltd.
      1. 8.21.1. Company Overview
      2. 8.21.2. Product/Service Portfolio
      3. 8.21.3. The Southern Gas Ltd. Sales, Revenue, Price, and Gross Margin
      4. 8.21.4. The Southern Gas Ltd. Revenue and Growth Rate
      5. 8.21.5. The Southern Gas Ltd. Market Share
      6. 8.21.6. Recent Initiatives, Funding/VC Activities, and Technological Innovations
    22. 8.22. Tripti Gases Pvt. Ltd.
      1. 8.22.1. Company Overview
      2. 8.22.2. Product/Service Portfolio
      3. 8.22.3. Tripti Gases Pvt. Ltd. Sales, Revenue, Price, and Gross Margin
      4. 8.22.4. Tripti Gases Pvt. Ltd. Revenue and Growth Rate
      5. 8.22.5. Tripti Gases Pvt. Ltd. Market Share
      6. 8.22.6. Recent Initiatives, Funding/VC Activities, and Technological Innovations
    23. 8.23. Mohsin Haider Darwish LLC
      1. 8.23.1. Company Overview
      2. 8.23.2. Product/Service Portfolio
      3. 8.23.3. Mohsin Haider Darwish LLC Sales, Revenue, Price, and Gross Margin
      4. 8.23.4. Mohsin Haider Darwish LLC Revenue and Growth Rate
      5. 8.23.5. Mohsin Haider Darwish LLC Market Share
      6. 8.23.6. Recent Initiatives, Funding/VC Activities, and Technological Innovations
  9. Chapter 9 Industrial Gases — Industry Analysis
    1. 9.1. Introduction and Taxonomy
    2. 9.2. Industrial Gases Market – Key Trends
      1. 9.2.1. Market Drivers
      2. 9.2.2. Market Restraints
      3. 9.2.3. Market Opportunities
    3. 9.3. Value Chain Analysis
    4. 9.4. Key Mandates and Regulations
    5. 9.5. Technology Roadmap and Timeline
    6. 9.6. Industrial Gases Market – Attractiveness Analysis
      1. 9.6.1. By Type
      2. 9.6.2. By Application
      3. 9.6.3. By Distribution Channel
      4. 9.6.4. By Region
  10. Chapter 10 Raw Material Analysis
    1. 10.1. Industrial Gases Key Raw Material Analysis
      1. 10.1.1. Key Raw Materials
      2. 10.1.2. Price Trend of Key Raw Materials
    2. 10.2. Key Suppliers of Raw Materials
    3. 10.3. Proportion of Manufacturing Cost Structure
      1. 10.3.1. Raw Materials Cost
      2. 10.3.2. Labor Cost
      3. 10.3.3. Manufacturing Expenses
      4. 10.3.4. Miscellaneous Expenses
    4. 10.4. Manufacturing Cost Analysis of Industrial Gases
  11. Chapter 11 Industrial Chain, Sourcing Strategy, and Downstream Buyers
    1. 11.1. Industrial Gases Industrial Chain Analysis
    2. 11.2. Upstream Raw Materials Sourcing
      1. 11.2.1. Risk Mitigation:
      2. 11.2.2. Supplier Relationships:
      3. 11.2.3. Business Processes:
      4. 11.2.4. Securing the Product:
    3. 11.3. Raw Materials Sources of Industrial Gases Major Manufacturers
    4. 11.4. Downstream Buyers
    5. 11.5. Distributors/Traders List
  12. Chapter 12 Marketing Strategy Analysis, Distributors
    1. 12.1. Marketing Channel
    2. 12.2. Direct Marketing
    3. 12.3. Indirect Marketing
    4. 12.4. Marketing Channel Development Trends
    5. 12.5. Economic/Political Environmental Change
  13. Chapter 13 Report Conclusion & Key Insights
    1. 13.1. Key Insights from Primary Interviews & Surveys Respondents
    2. 13.2. Key Takeaways from Analysts, Consultants, and Industry Leaders
  14. Chapter 14 Research Approach & Methodology
    1. 14.1. Report Description
    2. 14.2. Research Scope
    3. 14.3. Research Methodology
      1. 14.3.1. Secondary Research
      2. 14.3.2. Primary Research
      3. 14.3.3. Statistical Models
        1. 14.3.3.1. Company Share Analysis Model
        2. 14.3.3.2. Revenue Based Modeling
      4. 14.3.4. Research Limitations

      List of Figures

      Fig.1	Product Picture of Industrial Gases
      Fig.2	Global Industrial Gases Market, 2016 – 2026 (USD Million)
      Fig.3	Global Industrial Gases Market, 2016 – 2026 (Million SCF)
      Fig.4	Global Industrial Gases Market Absolute Revenue Opportunity, 2016 – 2026 (USD Million)
      Fig.5	Global Industrial Gases Market Incremental Revenue Opportunity, 2020 – 2026 (USD Million)
      Fig.6	Global Industrial Gases Market Share, by Type, 2020 & 2026 (USD Million)
      Fig.7	Global Industrial Gases Market Share, by Type, 2020 & 2026 (Million SCF)
      Fig.8	Global Oxygen Industrial Gases Market, 2016 – 2026 (USD Million)
      Fig.9	Global Oxygen Industrial Gases Market, 2016 – 2026 (Million SCF)
      Fig.10	Global Nitrogen Industrial Gases Market, 2016 – 2026 (USD Million)
      Fig.11	Global Nitrogen Industrial Gases Market, 2016 – 2026 (Million SCF)
      Fig.12	Global Hydrogen Industrial Gases Market, 2016 – 2026 (USD Million)
      Fig.13	Global Hydrogen Industrial Gases Market, 2016 – 2026 (Million SCF)
      Fig.14	Global Carbon Dioxide Industrial Gases Market, 2016 – 2026 (USD Million)
      Fig.15	Global Carbon Dioxide Industrial Gases Market, 2016 – 2026 (Million SCF)
      Fig.16	Global Acetylene Industrial Gases Market, 2016 – 2026 (USD Million)
      Fig.17	Global Acetylene Industrial Gases Market, 2016 – 2026 (Million SCF)
      Fig.18	Global Argon Industrial Gases Market, 2016 – 2026 (USD Million)
      Fig.19	Global Argon Industrial Gases Market, 2016 – 2026 (Million SCF)
      Fig.20	Global Others Industrial Gases Market, 2016 – 2026 (USD Million)
      Fig.21	Global Others Industrial Gases Market, 2016 – 2026 (Million SCF)
      Fig.22	Global Industrial Gases Market Share, by Application, 2020 & 2026 (USD Million)
      Fig.23	Global Industrial Gases Market Share, by Application, 2020 & 2026 (Million SCF)
      Fig.24	Global Healthcare Industrial Gases Market, 2016 – 2026 (USD Million)
      Fig.25	Global Healthcare Industrial Gases Market, 2016 – 2026 (Million SCF)
      Fig.26	Global Manufacturing Industrial Gases Market, 2016 – 2026 (USD Million)
      Fig.27	Global Manufacturing Industrial Gases Market, 2016 – 2026 (Million SCF)
      Fig.28	Global Metallurgy & Glass Industrial Gases Market, 2016 – 2026 (USD Million)
      Fig.29	Global Metallurgy & Glass Industrial Gases Market, 2016 – 2026 (Million SCF)
      Fig.30	Global Food & Beverages Industrial Gases Market, 2016 – 2026 (USD Million)
      Fig.31	Global Food & Beverages Industrial Gases Market, 2016 – 2026 (Million SCF)
      Fig.32	Global Retail Industrial Gases Market, 2016 – 2026 (USD Million)
      Fig.33	Global Retail Industrial Gases Market, 2016 – 2026 (Million SCF)
      Fig.34	Global Chemicals & Energy Industrial Gases Market, 2016 – 2026 (USD Million)
      Fig.35	Global Chemicals & Energy Industrial Gases Market, 2016 – 2026 (Million SCF)
      Fig.36	Global Others Industrial Gases Market, 2016 – 2026 (USD Million)
      Fig.37	Global Others Industrial Gases Market, 2016 – 2026 (Million SCF)
      Fig.38	Global Industrial Gases Market Share, by Distribution Channel, 2020 & 2026 (USD Million)
      Fig.39	Global Industrial Gases Market Share, by Distribution Channel, 2020 & 2026 (Million SCF)
      Fig.40	Global On-Site Industrial Gases Market, 2016 – 2026 (USD Million)
      Fig.41	Global On-Site Industrial Gases Market, 2016 – 2026 (Million SCF)
      Fig.42	Global Bulk Industrial Gases Market, 2016 – 2026 (USD Million)
      Fig.43	Global Bulk Industrial Gases Market, 2016 – 2026 (Million SCF)
      Fig.44	Global Cylinder Industrial Gases Market, 2016 – 2026 (USD Million)
      Fig.45	Global Cylinder Industrial Gases Market, 2016 – 2026 (Million SCF)
      Fig.46	Global Industrial Gases Market Share, by Region, 2020 & 2026 (USD Million)
      Fig.47	Global Industrial Gases Market Share, by Region, 2020 & 2026 (Million SCF)
      Fig.48	North America Industrial Gases Market, 2016 – 2026 (USD Million)
      Fig.49	North America Industrial Gases Market, 2016 – 2026 (Million SCF)
      Fig.50	U.S. Industrial Gases Market, 2016 – 2026 (USD Million)
      Fig.51	U.S. Industrial Gases  Market, 2016 – 2026 (Million SCF)
      Fig.52	Canada Industrial Gases Market, 2016 – 2026 (USD Million)
      Fig.53	Canada Industrial Gases  Market, 2016 – 2026 (Million SCF)
      Fig.54	Europe Industrial Gases Market, 2016 – 2026 (USD Million)
      Fig.55	Europe Industrial Gases Market, 2016 – 2026 (Million SCF)
      Fig.56	Germany Industrial Gases Market, 2016 – 2026 (USD Million)
      Fig.57	Germany Industrial Gases  Market, 2016 – 2026 (Million SCF)
      Fig.58	France Industrial Gases Market, 2016 – 2026 (USD Million)
      Fig.59	France Industrial Gases  Market, 2016 – 2026 (Million SCF)
      Fig.60	U.K. Industrial Gases Market, 2016 – 2026 (USD Million)
      Fig.61	U.K. Industrial Gases  Market, 2016 – 2026 (Million SCF)
      Fig.62	Italy Industrial Gases Market, 2016 – 2026 (USD Million)
      Fig.63	Italy Industrial Gases  Market, 2016 – 2026 (Million SCF)
      Fig.64	Spain Industrial Gases Market, 2016 – 2026 (USD Million)
      Fig.65	Spain Industrial Gases  Market, 2016 – 2026 (Million SCF)
      Fig.66	Rest of Europe Industrial Gases Market, 2016 – 2026 (USD Million)
      Fig.67	Rest of Europe Industrial Gases  Market, 2016 – 2026 (Million SCF)
      Fig.68	Asia Pacific Industrial Gases Market, 2016 – 2026 (USD Million)
      Fig.69	Asia Pacific Industrial Gases Market, 2016 – 2026 (Million SCF)
      Fig.70	China Industrial Gases Market, 2016 – 2026 (USD Million)
      Fig.71	China Industrial Gases  Market, 2016 – 2026 (Million SCF)
      Fig.72	Japan Industrial Gases Market, 2016 – 2026 (USD Million)
      Fig.73	Japan Industrial Gases  Market, 2016 – 2026 (Million SCF)
      Fig.74	India Industrial Gases Market, 2016 – 2026 (USD Million)
      Fig.75	India Industrial Gases  Market, 2016 – 2026 (Million SCF)
      Fig.76	South  Korea Industrial Gases Market, 2016 – 2026 (USD Million)
      Fig.77	South  Korea Industrial Gases  Market, 2016 – 2026 (Million SCF)
      Fig.78	South-East Asia Industrial Gases Market, 2016 – 2026 (USD Million)
      Fig.79	South-East Asia Industrial Gases  Market, 2016 – 2026 (Million SCF)
      Fig.80	Rest of Asia Pacific Industrial Gases Market, 2016 – 2026 (USD Million)
      Fig.81	Rest of Asia Pacific Industrial Gases  Market, 2016 – 2026 (Million SCF)
      Fig.82	Latin America Industrial Gases Market, 2016 – 2026 (USD Million)
      Fig.83	Latin America Industrial Gases Market, 2016 – 2026 (Million SCF)
      Fig.84	Brazil Industrial Gases Market, 2016 – 2026 (USD Million)
      Fig.85	Brazil Industrial Gases  Market, 2016 – 2026 (Million SCF)
      Fig.86	Mexico Industrial Gases Market, 2016 – 2026 (USD Million)
      Fig.87	Mexico Industrial Gases  Market, 2016 – 2026 (Million SCF)
      Fig.88	Rest of Latin America Industrial Gases Market, 2016 – 2026 (USD Million)
      Fig.89	Rest of Latin America Industrial Gases  Market, 2016 – 2026 (Million SCF)
      Fig.90	The Middle-East and Africa Industrial Gases Market, 2016 – 2026 (USD Million)
      Fig.91	The Middle-East and Africa Industrial Gases Market, 2016 – 2026 (Million SCF)
      Fig.92	GCC Countries Industrial Gases Market, 2016 – 2026 (USD Million)
      Fig.93	GCC Countries Industrial Gases  Market, 2016 – 2026 (Million SCF)
      Fig.94	South Africa Industrial Gases Market, 2016 – 2026 (USD Million)
      Fig.95	South Africa Industrial Gases  Market, 2016 – 2026 (Million SCF)
      Fig.96	Rest of Middle-East Africa Industrial Gases Market, 2016 – 2026 (USD Million)
      Fig.97	Rest of Middle-East Africa Industrial Gases  Market, 2016 – 2026 (Million SCF)
      Fig.98	Global Industrial Gases Production and Consumption, 2016 – 2026 (Million SCF)
      Fig.99	North America Industrial Gases Production and Consumption, 2016 – 2026 (USD Million) (Million SCF)
      Fig.100	Europe Industrial Gases Production and Consumption, 2016 – 2026 (USD Million) (Million SCF)
      Fig.101	Asia Pacific Industrial Gases Production and Consumption, 2016 – 2026 (USD Million) (Million SCF)
      Fig.102	Latin America Industrial Gases Production and Consumption, 2016 – 2026 (USD Million) (Million SCF)
      Fig.103	The Middle-East and Africa Industrial Gases Production and Consumption, 2016 – 2026 (USD Million) (Million SCF)
      Fig.104	Competitor Market Share – Revenue
      Fig.105	Competitor Market Share – Volume
      Fig.106	Air Liquide Revenue and Growth Rate
      Fig.107	Air Liquide Market Share
      Fig.108	Linde plc Revenue and Growth Rate
      Fig.109	Linde plc Market Share
      Fig.110	Air Products and Chemicals, Inc. Revenue and Growth Rate
      Fig.111	Air Products and Chemicals, Inc. Market Share
      Fig.112	Taiyo Nippon Sanso Corporation Revenue and Growth Rate
      Fig.113	Taiyo Nippon Sanso Corporation Market Share
      Fig.114	Messer Group GmbH Revenue and Growth Rate
      Fig.115	Messer Group GmbH Market Share
      Fig.116	SOL Group Revenue and Growth Rate
      Fig.117	SOL Group Market Share
      Fig.118	Matheson Tri-Gas, Inc. Revenue and Growth Rate
      Fig.119	Matheson Tri-Gas, Inc. Market Share
      Fig.120	INOX Air Products Ltd. Revenue and Growth Rate
      Fig.121	INOX Air Products Ltd. Market Share
      Fig.122	Iwatani Corporation Revenue and Growth Rate
      Fig.123	Iwatani Corporation Market Share
      Fig.124	India Glycols Ltd. Revenue and Growth Rate
      Fig.125	India Glycols Ltd. Market Share
      Fig.126	Abdullah Hashim Industrial Gases & Equipment Co. Ltd Revenue and Growth Rate
      Fig.127	Abdullah Hashim Industrial Gases & Equipment Co. Ltd Market Share
      Fig.128	Yateem Oxygen Revenue and Growth Rate
      Fig.129	Yateem Oxygen Market Share
      Fig.130	Buzwair Industrial Gases Factory Revenue and Growth Rate
      Fig.131	Buzwair Industrial Gases Factory Market Share
      Fig.132	Dubai Industrial Gases Revenue and Growth Rate
      Fig.133	Dubai Industrial Gases Market Share
      Fig.134	Gulf Cryo Revenue and Growth Rate
      Fig.135	Gulf Cryo Market Share
      Fig.136	Ellenbarrie Industrial Gases Ltd. Revenue and Growth Rate
      Fig.137	Ellenbarrie Industrial Gases Ltd. Market Share
      Fig.138	Bristol Gases – Concorde Corodex Group Revenue and Growth Rate
      Fig.139	Bristol Gases – Concorde Corodex Group Market Share
      Fig.140	Sicgil India Limited Revenue and Growth Rate
      Fig.141	Sicgil India Limited Market Share
      Fig.142	Bhuruka Gases Ltd. Revenue and Growth Rate
      Fig.143	Bhuruka Gases Ltd. Market Share
      Fig.144	Mohammed Hamad Al Mana Group Revenue and Growth Rate
      Fig.145	Mohammed Hamad Al Mana Group Market Share
      Fig.146	The Southern Gas Ltd. Revenue and Growth Rate
      Fig.147	The Southern Gas Ltd. Market Share
      Fig.148	Tripti Gases Pvt. Ltd. Revenue and Growth Rate
      Fig.149	Tripti Gases Pvt. Ltd. Market Share
      Fig.150	Mohsin Haider Darwish LLC Revenue and Growth Rate
      Fig.151	Mohsin Haider Darwish LLC Market Share
      Fig.152	Market Dynamics
      Fig.153	Global Industrial Gases – Value Chain Analysis
      Fig.154	Key Mandates and Regulations
      Fig.155	Technology Roadmap and Timeline
      Fig.156	Market Attractiveness Analysis – By Type
      Fig.157	Market Attractiveness Analysis – By Application
      Fig.158	Market Attractiveness Analysis – By Distribution Channel
      Fig.159	Market Attractiveness Analysis – By Region
      Fig.160	Manufacturing Cost Structure of Industrial Gases
      Fig.161	Industrial Gases Industrial Chain Analysis
      Fig.162	Market Channels
      Fig.163	Marketing Channel Development Trend
      Fig.164	Growth in World Gross Product, 2008-2018
      

      List of Tables

      Table 1	Global Industrial Gases Market, 2020 & 2026 (USD Million)
      Table 2	Global Industrial Gases Market, by Type, 2016 – 2026 (USD Million)
      Table 3	Global Industrial Gases Market, by Type, 2016 – 2026 (Million SCF)
      Table 4	Global Industrial Gases Market, by Application, 2016 – 2026 (USD Million)
      Table 5	Global Industrial Gases Market, by Application, 2016 – 2026 (Million SCF)
      Table 6	Global Industrial Gases Market, by Distribution Channel, 2016 – 2026 (USD Million)
      Table 7	Global Industrial Gases Market, by Distribution Channel, 2016 – 2026 (Million SCF)
      Table 8	Global Industrial Gases Market, by Region, 2016 – 2026 (USD Million)
      Table 9 Global Industrial Gases Market, by Region, 2016 – 2026 (Million SCF)
      Table 10 North America Industrial Gases Market, by Country, 2016 – 2026 (USD Million)
      Table 11 North America Industrial Gases Market, by Country, 2016 – 2026 (Million SCF)
      Table 12 North America Industrial Gases Market, by Type, 2016 – 2026 (USD Million)
      Table 13 North America Industrial Gases Market, by Type, 2016 – 2026 (Million SCF)
      Table 14 North America Industrial Gases Market, by Application, 2016 – 2026 (USD Million)
      Table 15 North America Industrial Gases Market, by Application, 2016 – 2026 (Million SCF)
      Table 16 North America Industrial Gases Market, by Distribution Channel, 2016 – 2026 (USD Million)
      Table 17 North America Industrial Gases Market, by Distribution Channel, 2016 – 2026 (Million SCF)
      Table 18 Europe Industrial Gases Market, by Country, 2016 – 2026 (USD Million)
      Table 19 Europe Industrial Gases Market, by Country, 2016 – 2026 (Million SCF)
      Table 20 Europe Industrial Gases Market, by Type, 2016 – 2026 (USD Million)
      Table 21 Europe Industrial Gases Market, by Type, 2016 – 2026 (Million SCF)
      Table 22 Europe Industrial Gases Market, by Application, 2016 – 2026 (USD Million)
      Table 23 Europe Industrial Gases Market, by Application, 2016 – 2026 (Million SCF)
      Table 24 Europe Industrial Gases Market, by Distribution Channel, 2016 – 2026 (USD Million)
      Table 25 Europe Industrial Gases Market, by Distribution Channel, 2016 – 2026 (Million SCF)
      Table 26 Asia Pacific Industrial Gases Market, by Country, 2016 – 2026 (USD Million)
      Table 27 Asia Pacific Industrial Gases Market, by Country, 2016 – 2026 (Million SCF)
      Table 28 Asia Pacific Industrial Gases Market, by Type, 2016 – 2026 (USD Million)
      Table 29 Asia Pacific Industrial Gases Market, by Type, 2016 – 2026 (Million SCF)
      Table 30 Asia Pacific Industrial Gases Market, by Application, 2016 – 2026 (USD Million)
      Table 31 Asia Pacific Industrial Gases Market, by Application, 2016 – 2026 (Million SCF)
      Table 32 Asia Pacific Industrial Gases Market, by Distribution Channel, 2016 – 2026 (USD Million)
      Table 33 Asia Pacific Industrial Gases Market, by Distribution Channel, 2016 – 2026 (Million SCF)
      Table 34 Latin America Industrial Gases Market, by Country, 2016 – 2026 (USD Million)
      Table 35 Latin America Industrial Gases Market, by Country, 2016 – 2026 (Million SCF)
      Table 36 Latin America Industrial Gases Market, by Type, 2016 – 2026 (USD Million)
      Table 37 Latin America Industrial Gases Market, by Type, 2016 – 2026 (Million SCF)
      Table 38 Latin America Industrial Gases Market, by Application, 2016 – 2026 (USD Million)
      Table 39 Latin America Industrial Gases Market, by Application, 2016 – 2026 (Million SCF)
      Table 40 Latin America Industrial Gases Market, by Distribution Channel, 2016 – 2026 (USD Million)
      Table 41 Latin America Industrial Gases Market, by Distribution Channel, 2016 – 2026 (Million SCF)
      Table 42 The Middle-East and Africa Industrial Gases Market, by Country, 2016 – 2026 (USD Million)
      Table 43 The Middle-East and Africa Industrial Gases Market, by Country, 2016 – 2026 (Million SCF)
      Table 44 The Middle-East and Africa Industrial Gases Market, by Type, 2016 – 2026 (USD Million)
      Table 45 The Middle-East and Africa Industrial Gases Market, by Type, 2016 – 2026 (Million SCF)
      Table 46 The Middle-East and Africa Industrial Gases Market, by Application, 2016 – 2026 (USD Million)
      Table 47 The Middle-East and Africa Industrial Gases Market, by Application, 2016 – 2026 (Million SCF)
      Table 48 The Middle-East and Africa Industrial Gases Market, by Distribution Channel, 2016 – 2026 (USD Million)
      Table 49 The Middle-East and Africa Industrial Gases Market, by Distribution Channel, 2016 – 2026 (Million SCF)
      Table 50 North America Industrial Gases Production, Consumption, Export, Import, 2016 – 2020
      Table 51 Europe Industrial Gases Production, Consumption, Export, Import, 2016 – 2020
      Table 52 Asia Pacific Industrial Gases Production, Consumption, Export, Import, 2016 – 2020
      Table 53 Latin America Industrial Gases Production, Consumption, Export, Import, 2016 – 2020
      Table 54 The Middle-East and Africa Industrial Gases Production, Consumption, Export, Import, 2016 – 2020
      Table 55 Global Industrial Gases Market - Company Revenue Analysis, 2016 – 2020 (USD Million)
      Table 56 Global Industrial Gases Market - Company Revenue Share Analysis, 2016 – 2020 (%)
      Table 57 Global Industrial Gases Market - Company Volume Analysis, 2016 – 2020 (Million SCF)
      Table 58 Global Industrial Gases Market - Company Volume Share Analysis, 2016 – 2020 (%)
      Table 59 Acquisitions and Mergers
      Table 60 Market Drivers – Impact Analysis
      Table 61 Market Restraints
      Table 62 Market Opportunities
      Table 63 Production Base and Market Concentration Rate of Raw Material
      Table 64 Key Suppliers of Raw Materials
      Table 65 Raw Materials Sources of Industrial Gases Major Manufacturers
      Table 66 Major Buyers of Industrial Gases
      Table 67 Distributors/Traders of Industrial Gases by Region
      

Industry Major Market Players

  • Linde plc
  • SOL Group
  • INOX Air Products Ltd.
  • India Glycols Ltd.
  • Yateem Oxygen
  • Taiyo Nippon Sanso Corporation
  • Dubai Industrial Gases
  • Sicgil India Limited
  • Mohammed Hamad Al Mana Group
  • Tripti Gases Pvt. Ltd.
  • Air Liquide
  • Air Products and Chemicals Inc.
  • Ellenbarrie Industrial Gases Ltd.
  • Iwatani Corporation
  • Abdullah Hashim Industrial Gases & Equipment Co. Ltd
  • Buzwair Industrial Gases Factory
  • Gulf Cryo
  • Bristol Gases – Concorde Corodex Group
  • Bhuruka Gases Ltd.
  • The Southern Gas Ltd.
  • Mohsin Haider Darwish LLC