Search Market Research Report

Discover Our Latest Reports
Discover Our Featured Reports
Discover Top Selling Reports

Industrial Alcohol Market Size, Share Global Analysis Report, 2021 – 2026

report img

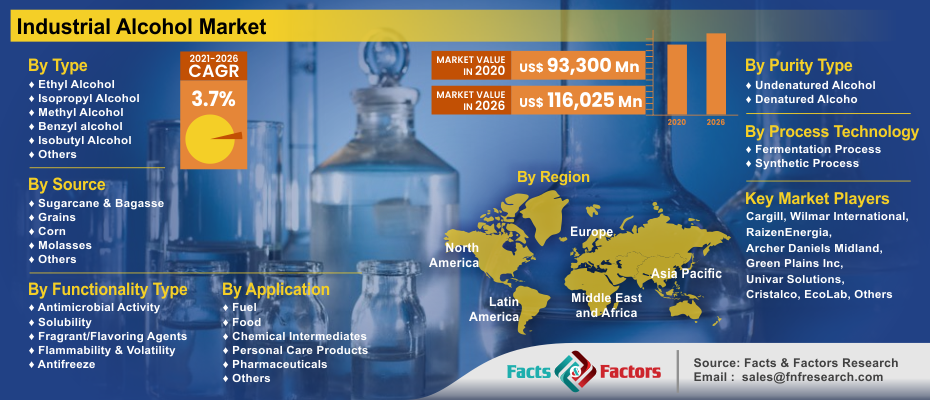
Industrial Alcohol Market by Type (Ethyl Alcohol, Isopropyl Alcohol, Methyl Alcohol, Benzyl alcohol, Isobutyl Alcohol, and Others) By Source (Sugarcane & Bagasse, Grains, Corn, Molasses, and Others), By Functionality Type (Antimicrobial Activity, Solubility, Fragrant/Flavoring Agents, Flammability & Volatility, and Antifreeze), By Purity Type (Undenatured Alcohol and Denatured Alcohol), By Process Technology (Fermentation Process and Synthetic Process),By Application (Fuel, Food, Chemical Intermediates, Personal Care Products, Pharmaceuticals, and Others), By Region: Global & Regional Industry Perspective, Comprehensive Analysis, and Forecast 2021 – 2026

Industry Insights

[197+ Pages Report] According to Facts and Factors, the global industrial alcohol market was valued at around USD 93,300 Million in 2020 and is predicted to create revenue of approximately USD 116,025 Million by the end of 2026, with a CAGR of roughly 3.7% between 2021 and 2026.

logoMarket Overview      

Industrial alcohols are used as a reagent and a solvent in a variety of sectors, including medicines, healthcare, energy, and chemicals. Apart from drinks, these alcohols are used in a variety of applications. Multifunctionality also boosts the adoption of a variety of end-user applications. Furthermore, ethanol, which is mostly manufactured and consumed as an alcoholic beverage, is widely used as a biofuel worldwide. Sugars generated from sugar cane, corn, sugar beets, wheat, and molasses are fermented to produce these fuels. It's also used as a substitute for gasoline in gasoline engines. Alcohols including methanol, benzyl alcohol, and isopropyl alcohol are also utilized in the manufacturing of food, flavorings, cosmetics, and adhesives. In addition, the market is anticipated to rise due to aggressive government initiatives and increased usage of methanol in chemical industries, as well as exponential expansion in manufacturing facilities. Furthermore, an increase in the number of corporate collaborations aimed at reducing greenhouse gas emissions and reducing the energy sector's reliance on imported fossil fuels is projected to enhance the market growth.

Industrial Alcohol Market

To know more about this report | Request Free Sample Copy

logoIndustry Growth Factors

The growing need for biofuels among end-users for energy security, as well as the growing demand for low-cost feedstock in the chemical sector, are driving the worldwide industrial alcohols market. Furthermore, owing to the good qualities of these alcohols, such as high octane number and increased flammability characteristics, there is a spike in demand for organic solvents, which promotes market growth in transportation. Furthermore, a lack of petroleum and rising energy prices have intensified the problem of energy scarcity, leading to an increase in the use of alcohol as a source of energy. Bioethanol is also blended with gasoline and diesel to be used as a vehicle fuel. However, changing feedstock prices, such as molasses, are likely to hinder alcohol production and, the development of the industry in the future.

logoSegmentation Analysis

The global industrial alcohol market is segregated based on type, source, process technology, functionality type, purity type, application, and region.

Ethyl alcohol, isopropyl alcohol, methyl alcohol, benzyl alcohol, isobutyl alcohol, and others make up a type segment of the global industrial alcohol industry. The global industrial alcohol market can be divided into sugarcane & bagasse, grains, corn, molasses, and others based on the source segment. Based on functionality type, the global industrial alcohol industry is categorized into antimicrobial activity, solubility, fragrant/flavoring agents, flammability & volatility, and antifreeze. Undenatured alcohol and denatured alcohol are the purity type segment of the global industrial alcohol market. The fermentation process and synthetic process make up the process technology of the global industrial alcohol industry. The global industrial alcohol market can be divided into fuel, food, chemical intermediates, personal care products, pharmaceuticals, and others based on the application segment.

logoIndustrial Alcohol Market: Report Scope

Report Attribute

Details

Market Size in 2020

USD 93,300 Million

Projected Market Size in 2026

USD 116,025 Million

CAGR Growth Rate

3.7%

Base Year

2026

Forecast Years

2021-2026

Key Market Players

Cargill, Wilmar International, RaizenEnergia, Archer Daniels Midland, Green Plains Inc, Univar Solutions, Cristalco, EcoLab, Royal Dutch Shell Plc, MGP Ingredients, Lindeplc, The Andersons Inc, LyondellBasell Industries, Sigma-Aldrich, Dow Chemical Company, Grain Processing Corporation, Eastman Chemical Company, Greenfield Global Inc., Exxon Mobil Corporation, and Flint Hills Resources, amongst others.

Key Segments

Type, Source, Functionality Type, Purity Type, Process Technology, Application, and Region

Major Regions Covered

North America, Europe, Asia Pacific, Latin America, and Middle East & Africa

Purchase Options

Request customized purchase options to meet your research needs. Explore purchase options

logo Regional Analysis

Owing to the large production and consumption of methyl alcohol and ethanol in Asian countries like India and China, the industry is dominated by the Asia Pacific region. The government of India's attempts to utilize ethanol as an automotive fuel is expected to boost ethanol consumption considerably in India. China dominates the worldwide methanol business, owing to increased demand for methanol for gasoline blending and the manufacture of olefins from methanol, which has resulted in new price, economic, and market dynamics. With consumption objectives established by the governments of China and India, methyl alcohol and ethyl alcohol dominated the Asia Pacific. In this sector, ethanol use is low, and gasoline use is quickly expanding, accompanied by rising worries about air quality, notably in China and India. With rising GDP and population, the amount of fuel required for transportation is expected to climb dramatically by 2030, necessitating the use of additional biofuels. China is the world's fourth-largest producer of biofuels, whereas India has the best bioethanol demand conditions.

logo Competitive Players

Some main participants of the global industrial alcohol market are :

  • Cargill
  • Wilmar International
  • RaizenEnergia
  • Archer Daniels Midland
  • Green Plains Inc
  • Univar Solutions
  • Cristalco
  • EcoLab
  • Royal Dutch Shell Plc
  • MGP Ingredients
  • Lindeplc
  • The Andersons Inc
  • LyondellBasell Industries
  • Sigma-Aldrich
  • Dow Chemical Company
  • Grain Processing Corporation
  • Eastman Chemical Company
  • Greenfield Global Inc.
  • Exxon Mobil Corporation
  • Flint Hills Resources

logo By Type

  • Ethyl Alcohol
  • Isopropyl Alcohol
  • Methyl Alcohol
  • Benzyl alcohol
  • Isobutyl Alcohol
  • Others

logo By Source

  • Sugarcane & Bagasse
  • Grains
  • Corn
  • Molasses
  • Others

logo By Functionality Type

  • Antimicrobial Activity
  • Solubility
  • Fragrant/Flavoring Agents
  • Flammability & Volatility
  • Antifreeze

logo By Purity Type

  • Undenatured Alcohol
  • Denatured Alcohol

logo By Process Technology

  • Fermentation Process
  • Synthetic Process

logo By Application

  • Fuel
  • Food
  • Chemical Intermediates
  • Personal Care Products
  • Pharmaceuticals
  • Others

logo By Region

  • North America
    • The U.S.
    • Canada
  • Europe
    • France
    • The UK
    • Spain
    • Germany
    • Italy
    • Rest of Europe
  • Asia Pacific
    • China
    • Japan
    • India
    • South Korea
    • Southeast Asia
    • Rest of Asia Pacific
  • Latin America
    • Brazil
    • Mexico
    • Rest of Latin America
  • Middle East & Africa
    • GCC Countries
    • South Africa
    • Rest of Middle East & Africa

Table of Content

  1. Chapter 1 Executive Summary
    1. 1.1. Introduction of Industrial Alcohol
    2. 1.2. Global Industrial Alcohol Market, 2020 & 2026 (USD Million)
    3. 1.3. Global Industrial Alcohol Market, 2016 – 2026 (USD Million) (Kilo Tons)
    4. 1.4. Global Industrial Alcohol Market Absolute Revenue Opportunity, 2016 – 2026 (USD Million)
    5. 1.5. Global Industrial Alcohol Market Incremental Revenue Opportunity, 2020 – 2026 (USD Million)
  2. Chapter 2 Industrial Alcohol Market – Sales Channel Analysis
    1. 2.1. Global Industrial Alcohol Market – Sales Channel Overview
    2. 2.2. Global Industrial Alcohol Market Share, by Sales Channel, 2020 & 2026 (USD Million)
    3. 2.3. Global Industrial Alcohol Market share, by Sales Channel, 2020 & 2026 (Kilo Tons)
    4. 2.4. Premium Food Service
      1. 2.4.1. Global Premium Food Service Industrial Alcohol Market, 2016 – 2026 (USD Million)
      2. 2.4.2. Global Premium Food Service Industrial Alcohol Market, 2016 – 2026 (Kilo Tons)
    5. 2.5. Non Premium Food Service
      1. 2.5.1. Global Non Premium Food Service Industrial Alcohol Market, 2016 – 2026 (USD Million)
      2. 2.5.2. Global Non Premium Food Service Industrial Alcohol Market, 2016 – 2026 (Kilo Tons)
    6. 2.6. B2B
      1. 2.6.1. Global B2B Industrial Alcohol Market, 2016 – 2026 (USD Million)
      2. 2.6.2. Global B2B Industrial Alcohol Market, 2016 – 2026 (Kilo Tons)
  3. Chapter 3 Industrial Alcohol Market – Application Analysis
    1. 3.1. Global Industrial Alcohol Market – Application Overview
    2. 3.2. Global Industrial Alcohol Market Share, by Application, 2020 & 2026 (USD Million)
    3. 3.3. Global Industrial Alcohol Market Share, by Application, 2020 & 2026 (Kilo Tons)
    4. 3.4. Savory
      1. 3.4.1. Global Savory Industrial Alcohol Market, 2016 – 2026 (USD Million)
      2. 3.4.2. Global Savory Industrial Alcohol Market, 2016 – 2026 (Kilo Tons)
    5. 3.5. Sandwich
      1. 3.5.1. Global Sandwich Industrial Alcohol Market, 2016 – 2026 (USD Million)
      2. 3.5.2. Global Sandwich Industrial Alcohol Market, 2016 – 2026 (Kilo Tons)
    6. 3.6. Salad Dressings & Dip
      1. 3.6.1. Global Salad Dressings & Dip Industrial Alcohol Market, 2016 – 2026 (USD Million)
      2. 3.6.2. Global Salad Dressings & Dip Industrial Alcohol Market, 2016 – 2026 (Kilo Tons)
    7. 3.7. Baked Goods/Desserts
      1. 3.7.1. Global Baked Goods/Desserts Industrial Alcohol Market, 2016 – 2026 (USD Million)
      2. 3.7.2. Global Baked Goods/Desserts Industrial Alcohol Market, 2016 – 2026 (Kilo Tons)
    8. 3.8. Ice Creams & Smoothies
      1. 3.8.1. Global Ice Creams & Smoothies Industrial Alcohol Market, 2016 – 2026 (USD Million)
      2. 3.8.2. Global Ice Creams & Smoothies Industrial Alcohol Market, 2016 – 2026 (Kilo Tons)
  4. Chapter 4 Industrial Alcohol Market – Regional Analysis
    1. 4.1. Global Industrial Alcohol Market Regional Overview
    2. 4.2. Global Industrial Alcohol Market Share, by Region, 2020 & 2026 (USD Million)
    3. 4.3. Global Industrial Alcohol Market Share, by Region, 2020 & 2026 (Kilo Tons)
    4. 4.4. North America
      1. 4.4.1. North America Industrial Alcohol Market, 2016 – 2026 (USD Million)
        1. 4.4.1.1. North America Industrial Alcohol Market, by Country, 2016 - 2026 (USD Million)
      2. 4.4.2. North America Market, 2016 – 2026 (Kilo Tons)
        1. 4.4.2.1. North America Industrial Alcohol Market, by Country, 2016 - 2026 (Kilo Tons)
      3. 4.4.3. North America Industrial Alcohol Market, by Sales Channel, 2016 – 2026
        1. 4.4.3.1. North America Industrial Alcohol Market, by Sales Channel, 2016 – 2026 (USD Million)
        2. 4.4.3.2. North America Industrial Alcohol Market, by Sales Channel, 2016 – 2026 (Kilo Tons)
      4. 4.4.4. North America Industrial Alcohol Market, by Application, 2016 – 2026
        1. 4.4.4.1. North America Industrial Alcohol Market, by Application, 2016 – 2026 (USD Million)
        2. 4.4.4.2. North America Industrial Alcohol Market, by Application, 2016 – 2026 (Kilo Tons)
      5. 4.4.5. U.S.
        1. 4.4.5.1. U.S. Industrial Alcohol Market, 2016 – 2026 (USD Million)
        2. 4.4.5.2. U.S. Industrial Alcohol Market, 2016 – 2026 (Kilo Tons)
      6. 4.4.6. Canada
        1. 4.4.6.1. Canada Industrial Alcohol Market, 2016 – 2026 (USD Million)
        2. 4.4.6.2. Canada Industrial Alcohol Market, 2016 – 2026 (Kilo Tons)
    5. 4.5. Europe
      1. 4.5.1. Europe Industrial Alcohol Market, 2016 – 2026 (USD Million)
        1. 4.5.1.1. Europe Industrial Alcohol Market, by Country, 2016 - 2026 (USD Million)
      2. 4.5.2. Europe Industrial Alcohol Market, 2016 – 2026 (Kilo Tons)
        1. 4.5.2.1. Europe Industrial Alcohol Market, by Country, 2016 - 2026 (Kilo Tons)
      3. 4.5.3. Europe Industrial Alcohol Market, by Sales Channel, 2016 – 2026
        1. 4.5.3.1. Europe Industrial Alcohol Market, by Sales Channel, 2016 – 2026 (USD Million)
        2. 4.5.3.2. Europe Industrial Alcohol Market, by Sales Channel, 2016 – 2026 (Kilo Tons)
      4. 4.5.4. Europe Industrial Alcohol Market, by Application, 2016 – 2026
        1. 4.5.4.1. Europe Industrial Alcohol Market, by Application, 2016 – 2026 (USD Million)
        2. 4.5.4.2. Europe Industrial Alcohol Market, by Application, 2016 – 2026 (Kilo Tons)
      5. 4.5.5. Germany
        1. 4.5.5.1. Germany Industrial Alcohol Market, 2016 – 2026 (USD Million)
        2. 4.5.5.2. Germany Industrial Alcohol Market, 2016 – 2026 (Kilo Tons)
      6. 4.5.6. France
        1. 4.5.6.1. France Industrial Alcohol Market, 2016 – 2026 (USD Million)
        2. 4.5.6.2. France Industrial Alcohol Market, 2016 – 2026 (Kilo Tons)
      7. 4.5.7. U.K.
        1. 4.5.7.1. U.K. Industrial Alcohol Market, 2016 – 2026 (USD Million)
        2. 4.5.7.2. U.K. Industrial Alcohol Market, 2016 – 2026 (Kilo Tons)
      8. 4.5.8. Italy
        1. 4.5.8.1. Italy Industrial Alcohol Market, 2016 – 2026 (USD Million)
        2. 4.5.8.2. Italy Industrial Alcohol Market, 2016 – 2026 (Kilo Tons)
      9. 4.5.9. Spain
        1. 4.5.9.1. Spain Industrial Alcohol Market, 2016 – 2026 (USD Million)
        2. 4.5.9.2. Spain Industrial Alcohol Market, 2016 – 2026 (Kilo Tons)
      10. 4.5.10. Rest of Europe
        1. 4.5.10.1. Rest of Europe Industrial Alcohol Market, 2016 – 2026 (USD Million)
        2. 4.5.10.2. Rest of Europe Industrial Alcohol Market, 2016 – 2026 (Kilo Tons)
    6. 4.6. Asia Pacific
      1. 4.6.1. Asia Pacific Industrial Alcohol Market, 2016 – 2026 (USD Million)
        1. 4.6.1.1. Asia Pacific Industrial Alcohol Market, by Country, 2016 - 2026 (USD Million)
      2. 4.6.2. Asia Pacific Industrial Alcohol Market, 2016 – 2026 (Kilo Tons)
        1. 4.6.2.1. Asia Pacific Industrial Alcohol Market, by Country, 2016 - 2026 (Kilo Tons)
      3. 4.6.3. Asia Pacific Industrial Alcohol Market, by Sales Channel, 2016 – 2026
        1. 4.6.3.1. Asia Pacific Industrial Alcohol Market, by Sales Channel, 2016 – 2026 (USD Million)
        2. 4.6.3.2. Asia Pacific Industrial Alcohol Market, by Sales Channel, 2016 – 2026 (Kilo Tons)
      4. 4.6.4. Asia Pacific Industrial Alcohol Market, by Application, 2016 – 2026
        1. 4.6.4.1. Asia Pacific Industrial Alcohol Market, by Application, 2016 – 2026 (USD Million)
        2. 4.6.4.2. Asia Pacific Industrial Alcohol Market, by Application, 2016 – 2026 (Kilo Tons)
      5. 4.6.5. China
        1. 4.6.5.1. China Industrial Alcohol Market, 2016 – 2026 (USD Million)
        2. 4.6.5.2. China Industrial Alcohol Market, 2016 – 2026 (Kilo Tons)
      6. 4.6.6. India
        1. 4.6.6.1. India Industrial Alcohol Market, 2016 – 2026 (USD Million)
        2. 4.6.6.2. India Industrial Alcohol Market, 2016 – 2026 (Kilo Tons)
      7. 4.6.7. Japan
        1. 4.6.7.1. Japan Industrial Alcohol Market, 2016 – 2026 (USD Million)
        2. 4.6.7.2. Japan Industrial Alcohol Market, 2016 – 2026 (Kilo Tons)
      8. 4.6.8. South Korea
        1. 4.6.8.1. South Korea Industrial Alcohol Market, 2016 – 2026 (USD Million)
        2. 4.6.8.2. South Korea Industrial Alcohol Market, 2016 – 2026 (Kilo Tons)
      9. 4.6.9. South-East Asia
        1. 4.6.9.1. South-East Asia Industrial Alcohol Market, 2016 – 2026 (USD Million)
        2. 4.6.9.2. South-East Asia Industrial Alcohol Market, 2016 – 2026 (Kilo Tons)
      10. 4.6.10. Rest of Asia Pacific
        1. 4.6.10.1. Rest of Asia Pacific Industrial Alcohol Market, 2016 – 2026 (USD Million)
        2. 4.6.10.2. Rest of Asia Pacific Industrial Alcohol Market, 2016 – 2026 (Kilo Tons)
    7. 4.7. Latin America
      1. 4.7.1. Latin America Industrial Alcohol Market, 2016 – 2026 (USD Million)
        1. 4.7.1.1. Latin America Industrial Alcohol Market, by Country, 2016 - 2026 (USD Million)
      2. 4.7.2. Latin America Industrial Alcohol Market, 2016 – 2026 (Kilo Tons)
        1. 4.7.2.1. Latin America Industrial Alcohol Market, by Country, 2016 - 2026 (Kilo Tons)
      3. 4.7.3. Latin America Industrial Alcohol Market, by Sales Channel, 2016 – 2026
        1. 4.7.3.1. Latin America Industrial Alcohol Market, by Sales Channel, 2016 – 2026 (USD Million)
        2. 4.7.3.2. Latin America Industrial Alcohol Market, by Sales Channel, 2016 – 2026 (Kilo Tons)
      4. 4.7.4. Latin America Industrial Alcohol Market, by Application, 2016 – 2026
        1. 4.7.4.1. Latin America Industrial Alcohol Market, by Application, 2016 – 2026 (USD Million)
        2. 4.7.4.2. Latin America Industrial Alcohol Market, by Application, 2016 – 2026 (Kilo Tons)
      5. 4.7.5. Brazil
        1. 4.7.5.1. Brazil Industrial Alcohol Market, 2016 – 2026 (USD Million)
        2. 4.7.5.2. Brazil Industrial Alcohol Market, 2016 – 2026 (Kilo Tons)
      6. 4.7.6. Mexico
        1. 4.7.6.1. Mexico Industrial Alcohol Market, 2016 – 2026 (USD Million)
        2. 4.7.6.2. Mexico Industrial Alcohol Market, 2016 – 2026 (Kilo Tons)
      7. 4.7.7. Rest of Latin America
        1. 4.7.7.1. Rest of Latin America Industrial Alcohol Market, 2016 – 2026 (USD Million)
        2. 4.7.7.2. Rest of Latin America Industrial Alcohol Market, 2016 – 2026 (Kilo Tons)
    8. 4.8. Middle East & Africa
      1. 4.8.1. Middle East & Africa Industrial Alcohol Market, 2016 – 2026 (USD Million)
        1. 4.8.1.1. Middle East & Africa Industrial Alcohol Market, by Country, 2016 - 2026 (USD Million)
      2. 4.8.2. Middle East & Africa Industrial Alcohol Market, 2016 – 2026 (Kilo Tons)
        1. 4.8.2.1. Middle East & Africa Industrial Alcohol Market, by Country, 2016 - 2026 (Kilo Tons)
      3. 4.8.3. Middle East & Africa Industrial Alcohol Market, by Sales Channel, 2016 – 2026
        1. 4.8.3.1. Middle East & Africa Industrial Alcohol Market, by Sales Channel, 2016 – 2026 (USD Million)
        2. 4.8.3.2. Middle East & Africa Industrial Alcohol Market, by Sales Channel, 2016 – 2026 (Kilo Tons)
      4. 4.8.4. Middle East & Africa Industrial Alcohol Market, by Application, 2016 – 2026
        1. 4.8.4.1. Middle East & Africa Industrial Alcohol Market, by Application, 2016 – 2026 (USD Million)
        2. 4.8.4.2. Middle East & Africa Industrial Alcohol Market, by Application, 2016 – 2026 (Kilo Tons)
      5. 4.8.5. GCC
        1. 4.8.5.1. GCC Industrial Alcohol Market, 2016 – 2026 (USD Million)
        2. 4.8.5.2. GCC Industrial Alcohol Market, 2016 – 2026 (Kilo Tons)
      6. 4.8.6. South Africa
        1. 4.8.6.1. South Africa Industrial Alcohol Market, 2016 – 2026 (USD Million)
        2. 4.8.6.2. South Africa Industrial Alcohol Market, 2016 – 2026 (Kilo Tons)
      7. 4.8.7. Rest of Middle East & Africa
        1. 4.8.7.1. Rest of Middle East & Africa Industrial Alcohol Market, 2016 – 2026 (USD Million)
        2. 4.8.7.2. Rest of Middle East & Africa Industrial Alcohol Market, 2016 – 2026 (Kilo Tons)
  5. Chapter 5 Industrial Alcohol Production, Consumption, Export, Import by Regions
    1. 5.1. Global Industrial Alcohol Production and Consumption, 2016 – 2026 (Kilo Tons)
    2. 5.2. Global Import and Export Analysis, by Region
  6. Chapter 6 Industrial Alcohol Market – Competitive Landscape
    1. 6.1. Competitor Market Share – Revenue
    2. 6.2. Market Concentration Rate Analysis, Top 3 and Top 5 Players
    3. 6.3. Competitor Market Share – Volume
    4. 6.4. Strategic Developments
      1. 6.4.1. Acquisitions and Mergers
      2. 6.4.2. New Products
      3. 6.4.3. Research & Development Activities
  7. Chapter 7 Company Profiles
    1. 7.1. Daisy Brand LLC
      1. 7.1.1. Company Overview
      2. 7.1.2. Product/Service Portfolio
      3. 7.1.3. Daisy Brand LLC Sales, Revenue, Price, and Gross Margin
      4. 7.1.4. Daisy Brand LLC Revenue and Growth Rate
      5. 7.1.5. Daisy Brand LLC Market Share
      6. 7.1.6. Recent Initiatives, Funding/VC Activities, and Technological Innovations
    2. 7.2. Dean Foods
      1. 7.2.1. Company Overview
      2. 7.2.2. Product/Service Portfolio
      3. 7.2.3. Dean Foods Sales, Revenue, Price, and Gross Margin
      4. 7.2.4. Dean Foods Revenue and Growth Rate
      5. 7.2.5. Dean Foods Market Share
      6. 7.2.6. Recent Initiatives, Funding/VC Activities, and Technological Innovations
    3. 7.3. Land O’ Lakes
      1. 7.3.1. Company Overview
      2. 7.3.2. Product/Service Portfolio
      3. 7.3.3. Land O’ Lakes Sales, Revenue, Price, and Gross Margin
      4. 7.3.4. Land O’ Lakes Revenue and Growth Rate
      5. 7.3.5. Land O’ Lakes Market Share
      6. 7.3.6. Recent Initiatives, Funding/VC Activities, and Technological Innovations
    4. 7.4. Scott Brothers Diary Inc.
      1. 7.4.1. Company Overview
      2. 7.4.2. Product/Service Portfolio
      3. 7.4.3. Scott Brothers Diary Inc. Sales, Revenue, Price, and Gross Margin
      4. 7.4.4. Scott Brothers Diary Inc. Revenue and Growth Rate
      5. 7.4.5. Scott Brothers Diary Inc. Market Share
      6. 7.4.6. Recent Initiatives, Funding/VC Activities, and Technological Innovations
    5. 7.5. Uelzena Ingredients
      1. 7.5.1. Company Overview
      2. 7.5.2. Product/Service Portfolio
      3. 7.5.3. Uelzena Ingredients Sales, Revenue, Price, and Gross Margin
      4. 7.5.4. Uelzena Ingredients Revenue and Growth Rate
      5. 7.5.5. Uelzena Ingredients Market Share
      6. 7.5.6. Recent Initiatives, Funding/VC Activities, and Technological Innovations
    6. 7.6. Compsey Creamery
      1. 7.6.1. Company Overview
      2. 7.6.2. Product/Service Portfolio
      3. 7.6.3. Compsey Creamery Sales, Revenue, Price, and Gross Margin
      4. 7.6.4. Compsey Creamery Revenue and Growth Rate
      5. 7.6.5. Compsey Creamery Market Share
      6. 7.6.6. Recent Initiatives, Funding/VC Activities, and Technological Innovations
    7. 7.7. Prairie Farms Dairy
      1. 7.7.1. Company Overview
      2. 7.7.2. Product/Service Portfolio
      3. 7.7.3. Prairie Farms Dairy Sales, Revenue, Price, and Gross Margin
      4. 7.7.4. Prairie Farms Dairy Revenue and Growth Rate
      5. 7.7.5. Prairie Farms Dairy Market Share
      6. 7.7.6. Recent Initiatives, Funding/VC Activities, and Technological Innovations
    8. 7.8. HP Hood LLC
      1. 7.8.1. Company Overview
      2. 7.8.2. Product/Service Portfolio
      3. 7.8.3. HP Hood LLC Sales, Revenue, Price, and Gross Margin
      4. 7.8.4. HP Hood LLC Revenue and Growth Rate
      5. 7.8.5. HP Hood LLC Market Share
      6. 7.8.6. Recent Initiatives, Funding/VC Activities, and Technological Innovations
    9. 7.9. Cabot Creamery
      1. 7.9.1. Company Overview
      2. 7.9.2. Product/Service Portfolio
      3. 7.9.3. Cabot Creamery Sales, Revenue, Price, and Gross Margin
      4. 7.9.4. Cabot Creamery Revenue and Growth Rate
      5. 7.9.5. Cabot Creamery Market Share
      6. 7.9.6. Recent Initiatives, Funding/VC Activities, and Technological Innovations
    10. 7.10. Barambah Organics Pty Ltd.
      1. 7.10.1. Company Overview
      2. 7.10.2. Product/Service Portfolio
      3. 7.10.3. Barambah Organics Pty Ltd. Sales, Revenue, Price, and Gross Margin
      4. 7.10.4. Barambah Organics Pty Ltd. Revenue and Growth Rate
      5. 7.10.5. Barambah Organics Pty Ltd. Market Share
      6. 7.10.6. Recent Initiatives, Funding/VC Activities, and Technological Innovations
    11. 7.11. Meggle
      1. 7.11.1. Company Overview
      2. 7.11.2. Product/Service Portfolio
      3. 7.11.3. Meggle Sales, Revenue, Price, and Gross Margin
      4. 7.11.4. Meggle Revenue and Growth Rate
      5. 7.11.5. Meggle Market Share
      6. 7.11.6. Recent Initiatives, Funding/VC Activities, and Technological Innovations
  8. Chapter 8 Industrial Alcohol — Industry Analysis
    1. 8.1. Introduction and Taxonomy
    2. 8.2. Industrial Alcohol Market – Key Trends
      1. 8.2.1. Market Drivers
      2. 8.2.2. Market Restraints
      3. 8.2.3. Market Opportunities
    3. 8.3. Value Chain Analysis
    4. 8.4. Key Mandates and Regulations
    5. 8.5. Technology Roadmap and Timeline
    6. 8.6. Industrial Alcohol Market – Attractiveness Analysis
      1. 8.6.1. By Sales Channel
      2. 8.6.2. By Application
      3. 8.6.3. By Region
  9. Chapter 9 Raw Material Analysis
    1. 9.1. Industrial Alcohol Key Raw Material Analysis
      1. 9.1.1. Key Raw Materials
      2. 9.1.2. Price Trend of Key Raw Materials
    2. 9.2. Key Suppliers of Raw Materials
    3. 9.3. Proportion of Manufacturing Cost Structure
      1. 9.3.1. Raw Materials Cost
      2. 9.3.2. Labor Cost
      3. 9.3.3. Manufacturing Expenses
      4. 9.3.4. Miscellaneous Expenses
    4. 9.4. Manufacturing Cost Analysis of Industrial Alcohol
  10. Chapter 10 Industrial Chain, Sourcing Strategy, and Downstream Buyers
    1. 10.1. Industrial Alcohol Industrial Chain Analysis
    2. 10.2. Upstream Raw Materials Sourcing
      1. 10.2.1. Risk Mitigation:
      2. 10.2.2. Supplier Relationships:
      3. 10.2.3. Business Processes:
      4. 10.2.4. Securing the Product:
    3. 10.3. Raw Materials Sources of Industrial Alcohol Major Manufacturers
    4. 10.4. Downstream Buyers
    5. 10.5. Distributors/Traders List
  11. Chapter 11 Marketing Strategy Analysis, Distributors
    1. 11.1. Marketing Channel
    2. 11.2. Direct Marketing
    3. 11.3. Indirect Marketing
    4. 11.4. Marketing Channel Development Trends
    5. 11.5. Economic/Political Environmental Change
  12. Chapter 12 Report Conclusion & Key Insights
    1. 12.1. Key Insights from Primary Interviews & Surveys Respondents
    2. 12.2. Key Takeaways from Analysts, Consultants, and Industry Leaders
  13. Chapter 13 Research Approach & Methodology
    1. 13.1. Report Description
    2. 13.2. Research Scope
    3. 13.3. Research Methodology
      1. 13.3.1. Secondary Research
      2. 13.3.2. Primary Research
      3. 13.3.3. Statistical Models
        1. 13.3.3.1. Company Share Analysis Model
        2. 13.3.3.2. Revenue Based Modeling
      4. 13.3.4. Research Limitations

      List of Figures

      Fig.1	Product Picture of Industrial Alcohol
      Fig.2	Global Industrial Alcohol Market, 2016 – 2026 (USD Million)
      Fig.3	Global Industrial Alcohol Market, 2016 – 2026 (Kilo Tons)
      Fig.4	Global Industrial Alcohol Market Absolute Revenue Opportunity, 2016 – 2026 (USD Million)
      Fig.5	Global Industrial Alcohol Market Incremental Revenue Opportunity, 2020 – 2026 (USD Million)
      Fig.6	Global Industrial Alcohol Market Share, by Sales Channel, 2020 & 2026 (USD Million)
      Fig.7	Global Industrial Alcohol Market Share, by Sales Channel, 2020 & 2026 (Kilo Tons)
      Fig.8	Global Premium Food Service Industrial Alcohol Market, 2016 – 2026 (USD Million)
      Fig.9	Global Premium Food Service Industrial Alcohol Market, 2016 – 2026 (Kilo Tons)
      Fig.10	Global Non Premium Food Service Industrial Alcohol Market, 2016 – 2026 (USD Million)
      Fig.11	Global Non Premium Food Service Industrial Alcohol  Market, 2016 – 2026 (Kilo Tons)
      Fig.12	Global B2B Industrial Alcohol Market, 2016 – 2026 (USD Million)
      Fig.13	Global B2B Industrial Alcohol  Market, 2016 – 2026 (Kilo Tons)
      Fig.14	Global Industrial Alcohol Market Share, by Application, 2020 & 2026 (USD Million)
      Fig.15	Global Industrial Alcohol Market Share, by Application, 2020 & 2026 (Kilo Tons)
      Fig.16	Global Savory Industrial Alcohol Market, 2016 – 2026 (USD Million)
      Fig.17	Global Savory Industrial Alcohol  Market, 2016 – 2026 (Kilo Tons)
      Fig.18	Global Sandwich Industrial Alcohol Market, 2016 – 2026 (USD Million)
      Fig.19	Global Sandwich Industrial Alcohol  Market, 2016 – 2026 (Kilo Tons)
      Fig.20	Global Salad Dressings & Dip Industrial Alcohol Market, 2016 – 2026 (USD Million)
      Fig.21	Global Salad Dressings & Dip Industrial Alcohol  Market, 2016 – 2026 (Kilo Tons)
      Fig.22	Global Baked Goods/Desserts Industrial Alcohol Market, 2016 – 2026 (USD Million)
      Fig.23	Global Baked Goods/Desserts Industrial Alcohol  Market, 2016 – 2026 (Kilo Tons)
      Fig.24	Global Ice Creams & Smoothies Industrial Alcohol Market, 2016 – 2026 (USD Million)
      Fig.25	Global Ice Creams & Smoothies Industrial Alcohol  Market, 2016 – 2026 (Kilo Tons)
      Fig.26	Global Industrial Alcohol Market Share, by Region, 2020 & 2026 (USD Million)
      Fig.27	Global Industrial Alcohol Market Share, by Region, 2020 & 2026 (Kilo Tons)
      Fig.28	North America Industrial Alcohol Market, 2016 – 2026 (USD Million)
      Fig.29	North America Industrial Alcohol Market, 2016 – 2026 (Kilo Tons)
      Fig.30	U.S. Industrial Alcohol Market, 2016 – 2026 (USD Million)
      Fig.31	U.S. Industrial Alcohol  Market, 2016 – 2026 (Kilo Tons)
      Fig.32	Canada Industrial Alcohol Market, 2016 – 2026 (USD Million)
      Fig.33	Canada Industrial Alcohol  Market, 2016 – 2026 (Kilo Tons)
      Fig.34	Europe Industrial Alcohol Market, 2016 – 2026 (USD Million)
      Fig.35	Europe Industrial Alcohol  Market, 2016 – 2026 (Kilo Tons)
      Fig.36	Germany Industrial Alcohol Market, 2016 – 2026 (USD Million)
      Fig.37	Germany Industrial Alcohol  Market, 2016 – 2026 (Kilo Tons)
      Fig.38	France Industrial Alcohol Market, 2016 – 2026 (USD Million)
      Fig.39	France Industrial Alcohol  Market, 2016 – 2026 (Kilo Tons)
      Fig.40	U.K. Industrial Alcohol Market, 2016 – 2026 (USD Million)
      Fig.41	U.K. Industrial Alcohol  Market, 2016 – 2026 (Kilo Tons)
      Fig.42	Italy Industrial Alcohol Market, 2016 – 2026 (USD Million)
      Fig.43	Italy Industrial Alcohol  Market, 2016 – 2026 (Kilo Tons)
      Fig.44	Spain Industrial Alcohol Market, 2016 – 2026 (USD Million)
      Fig.45	Spain Industrial Alcohol  Market, 2016 – 2026 (Kilo Tons)
      Fig.46	Rest of Europe Industrial Alcohol Market, 2016 – 2026 (USD Million)
      Fig.47	Rest of Europe Industrial Alcohol  Market, 2016 – 2026 (Kilo Tons)
      Fig.48	Asia Pacific Industrial Alcohol Market, 2016 – 2026 (USD Million)
      Fig.49	Asia Pacific Industrial Alcohol  Market, 2016 – 2026 (Kilo Tons)
      Fig.50	China Industrial Alcohol Market, 2016 – 2026 (USD Million)
      Fig.51	China Industrial Alcohol  Market, 2016 – 2026 (Kilo Tons)
      Fig.52	India Industrial Alcohol Market, 2016-2026 (USD Million)
      Fig.53	India Industrial Alcohol  Market, 2016 – 2026 (Kilo Tons)
      Fig.54	Japan Industrial Alcohol Market, 2016 – 2026 (USD Million)
      Fig.55	Japan Industrial Alcohol  Market, 2016 – 2026 (Kilo Tons)
      Fig.56	South Korea Industrial Alcohol Market, 2016 – 2026 (USD Million)
      Fig.57	South Korea Industrial Alcohol  Market, 2016 – 2026 (Kilo Tons)
      Fig.58	South-East Asia Industrial Alcohol Market, 2016 – 2026 (USD Million)
      Fig.59	South-East Asia Industrial Alcohol  Market, 2016 – 2026 (Kilo Tons)
      Fig.60	Rest of Asia Pacific Industrial Alcohol Market, 2016 – 2026 (USD Million)
      Fig.61	Rest of Asia Pacific Industrial Alcohol  Market, 2016 – 2026 (Kilo Tons)
      Fig.62	Latin America Industrial Alcohol Market, 2016 – 2026 (USD Million)
      Fig.63	Latin America Industrial Alcohol  Market, 2016 – 2026 (Kilo Tons)
      Fig.64	Brazil Industrial Alcohol Market, 2016 – 2026 (USD Million)
      Fig.65	Brazil Industrial Alcohol  Market, 2016 – 2026 (Kilo Tons)
      Fig.66	Mexico Industrial Alcohol Market, 2016 – 2026 (USD Million)
      Fig.67	Mexico Industrial Alcohol  Market, 2016 – 2026 (Kilo Tons)
      Fig.68	Rest of Latin America Industrial Alcohol Market, 2016 – 2026 (USD Million)
      Fig.69	Rest of Latin America Industrial Alcohol  Market, 2016 – 2026 (Kilo Tons)
      Fig.70	Middle East & Africa Industrial Alcohol Market, 2016 – 2026 (USD Million)
      Fig.71	Middle East & Africa Industrial Alcohol  Market, 2016 – 2026 (Kilo Tons)
      Fig.72	GCC Industrial Alcohol Market, 2016 – 2026 (USD Million)
      Fig.73	GCC Industrial Alcohol Market, 2016 – 2026 (Kilo Tons)
      Fig.74	South Africa Industrial Alcohol Market, 2016 – 2026 (USD Million)
      Fig.75	South Africa Industrial Alcohol  Market, 2016 – 2026 (Kilo Tons)
      Fig.76	Rest of Middle East & Africa Industrial Alcohol Market, 2016 – 2026 (USD Million)
      Fig.77	Rest of Middle East & Africa Industrial Alcohol Market, 2016 – 2026 (Kilo Tons)
      Fig.78	Global Industrial Alcohol Production and Consumption, 2016 – 2026 (Kilo Tons)
      Fig.79	North America Industrial Alcohol Production and Consumption, 2016 – 2026 (Kilo Tons)
      Fig.80	Europe Industrial Alcohol Production and Consumption, 2016 – 2026 (USD Million) (Kilo Tons)
      Fig.81	Asia Pacific Industrial Alcohol Production and Consumption, 2016 – 2026 (USD Million) (Kilo Tons)
      Fig.82	Latin America Industrial Alcohol Production and Consumption, 2016 – 2026 (USD Million) (Kilo Tons)
      Fig.83	Middle East and Africa Industrial Alcohol Production and Consumption, 2016 – 2026 (USD Million) (Kilo Tons)
      Fig.84	Competitor Market Share – Revenue
      Fig.85	Competitor Market Share – Volume
      Fig.86	Daisy Brand LLC Revenue and Growth Rate
      Fig.87	Daisy Brand LLC Market Share
      Fig.88	Market Dynamics
      Fig.89	Global Industrial Alcohol – Value Chain Analysis
      Fig.90	Key Mandates and Regulations
      Fig.91	Technology Roadmap and Timeline
      Fig.92	Market Attractiveness Analysis – By Sales Channel
      Fig.93	Market Attractiveness Analysis – By Application
      Fig.94	Market Attractiveness Analysis – By Region
      Fig.95	Manufacturing Cost Structure of Industrial Alcohol
      Fig.96	Industrial Alcohol Industrial Chain Analysis
      Fig.97	Market Channels
      Fig.98	Marketing Channel Development Trend
      Fig.99	Growth in World Gross Product, 2008-2018
      

      List of Tables

      Table 1	Global Industrial Alcohol Market, 2020 & 2026 (USD Million)
      Table 2	Global Industrial Alcohol Market, by Sales Channel, 2016 – 2026 (USD Million)
      Table 3	Global Industrial Alcohol Market, by Sales Channel, 2016 – 2026 (Kilo Tons)
      Table 4	Global Industrial Alcohol Market, by Application, 2016 – 2026 (USD Million)
      Table 5	Global Industrial Alcohol Market, by Application, 2016 – 2026 (Kilo Tons)
      Table 6	Global Industrial Alcohol Market, by Region, 2016 – 2026 (USD Million)
      Table 7	Global Industrial Alcohol Market, by Region, 2016 – 2026 (Kilo Tons)
      Table 8	North America Industrial Alcohol Market, by Country, 2016 – 2026 (USD Million)
      Table 9	North America Industrial Alcohol Market, by Country, 2016 – 2026 (Kilo Tons)
      Table 10 North America Industrial Alcohol Market, by Sales Channel, 2016 – 2026 (USD Million)
      Table 11 North America Industrial Alcohol Market, by Sales Channel, 2016 – 2026 (Kilo Tons)
      Table 12 North America Industrial Alcohol Market, by Application, 2016 – 2026 (USD Million)
      Table 13 North America Industrial Alcohol Market, by Application, 2016 – 2026 (Kilo Tons)
      Table 14 Europe Industrial Alcohol Market, by Country, 2016 – 2026 (USD Million)
      Table 15 Europe Industrial Alcohol Market, by Country, 2016 – 2026 (Kilo Tons)
      Table 16 Europe Industrial Alcohol Market, by Sales Channel, 2016 – 2026 (USD Million)
      Table 17 Europe Industrial Alcohol Market, by Sales Channel, 2016 – 2026 (Kilo Tons)
      Table 18 Europe Industrial Alcohol Market, by Application, 2016 – 2026 (USD Million)
      Table 19 Europe Industrial Alcohol Market, by Application, 2016 – 2026 (Kilo Tons)
      Table 20 Asia Pacific Industrial Alcohol Market, by Country, 2016 – 2026 (USD Million)
      Table 21 Europe Industrial Alcohol Market, by Country, 2016 – 2026 (Kilo Tons)
      Table 22 Asia Pacific Industrial Alcohol Market, by Sales Channel, 2016 – 2026 (USD Million)
      Table 23 Asia Pacific Industrial Alcohol Market, by Sales Channel, 2016 – 2026 (Kilo Tons)
      Table 24 Asia Pacific Industrial Alcohol Market, by Application (Recipes), 2016 – 2026 (USD Million)
      Table 25 Asia Pacific Industrial Alcohol Market, by Application, 2016 – 2026 (Kilo Tons)
      Table 26 Latin America Industrial Alcohol Market, by Country, 2016 – 2026 (USD Million)
      Table 27 Latin America Industrial Alcohol Market, by Country, 2016 – 2026 (Kilo Tons)
      Table 28 Latin America Industrial Alcohol Market, by Sales Channel, 2016 – 2026 (USD Million)
      Table 29 Latin America Industrial Alcohol Market, by Sales Channel, 2016 – 2026 (Kilo Tons)
      Table 30 Latin America Industrial Alcohol Market, by Application, 2016 – 2026 (USD Million)
      Table 31 Latin America Industrial Alcohol Market, by Application, 2016 – 2026 (Kilo Tons)
      Table 32 Middle East & Africa Industrial Alcohol Market, by Country, 2016 – 2026 (USD Million)
      Table 33 Middle East & Africa Industrial Alcohol Market, by Country, 2016 – 2026 (Kilo Tons)
      Table 34 Middle East & Africa Industrial Alcohol Market, by Sales Channel, 2016 – 2026 (USD Million)
      Table 35 Middle East & Africa Industrial Alcohol Market, by Sales Channel, 2016 – 2026 (Kilo Tons)
      Table 36 Middle East & Africa Industrial Alcohol Market, by Application, 2016 – 2026 (USD Million)
      Table 37 Middle East & Africa Industrial Alcohol Market, by Application, 2016 – 2026 (Kilo Tons)
      Table 38 North America Industrial Alcohol Production, Consumption, Export, Import, 2016 – 2019
      Table 39 Europe Industrial Alcohol Production, Consumption, Export, Import, 2016 – 2019
      Table 40 Asia Pacific Industrial Alcohol Production, Consumption, Export, Import, 2016 – 2019
      Table 41 Latin America Industrial Alcohol Production, Consumption, Export, Import, 2016 – 2019
      Table 42 Middle East & Africa Industrial Alcohol Production, Consumption, Export, Import, 2016 – 2019
      Table 43 Global Industrial Alcohol Market - Company Revenue Analysis, 2016 – 2019 (USD Million)
      Table 44 Global Industrial Alcohol Market - Company Revenue Share Analysis, 2016 – 2019 (%)
      Table 45 Global Industrial Alcohol Market - Company Volume Analysis, 2016 – 2019 (Kilo Tons)
      Table 46 Global Industrial Alcohol Market - Company Volume Share Analysis, 2016 – 2019 (%)
      Table 47 Acquisitions and Mergers
      Table 48 Market Drivers – Impact Analysis
      Table 49 Market Restraints
      Table 50 Market Opportunities
      Table 51 Production Base and Market Concentration Rate of Raw Material
      Table 52 Key Suppliers of Raw Materials
      Table 53 Raw Materials Sources of Industrial Alcohol Major Manufacturers
      Table 54 Major Buyers of Industrial Alcohol
      Table 55 Distributors/Traders of Industrial Alcohol by Region
      

Industry Major Market Players

  • Cargill
  • Wilmar International
  • RaizenEnergia
  • Archer Daniels Midland
  • Green Plains Inc
  • Univar Solutions
  • Cristalco
  • EcoLab
  • Royal Dutch Shell Plc
  • MGP Ingredients
  • Lindeplc
  • The Andersons Inc
  • LyondellBasell Industries
  • Sigma-Aldrich
  • Dow Chemical Company
  • Grain Processing Corporation
  • Eastman Chemical Company
  • Greenfield Global Inc.
  • Exxon Mobil Corporation
  • Flint Hills Resources