Search Market Research Report

Discover Our Latest Reports
Discover Our Featured Reports
Discover Top Selling Reports

In-vehicle Payment Services Market Size, Share Global Analysis Report, , 2021 – 2026

report img

In-vehicle Payment Services Market By Mode Of Payment (QR Code/ RFID, App-based/e-wallet, Credit/Debit Card-based, and NFC), By Vehicle Type (Passenger cars, Light Commercial Vehicles (LCVs), Heavy Commercial Vehicles (HCVs), and Automated Guided Vehicles), By Form Factor (Embedded System, Tethered System, and Integrated System), By Application (Shopping, Gas/Charging Stations, Food and Beverages, Toll Collection, Parking, and Others), and By Region: Global Industry Perspective, Comprehensive Analysis, and Forecast, 2021 – 2026

Industry Insights

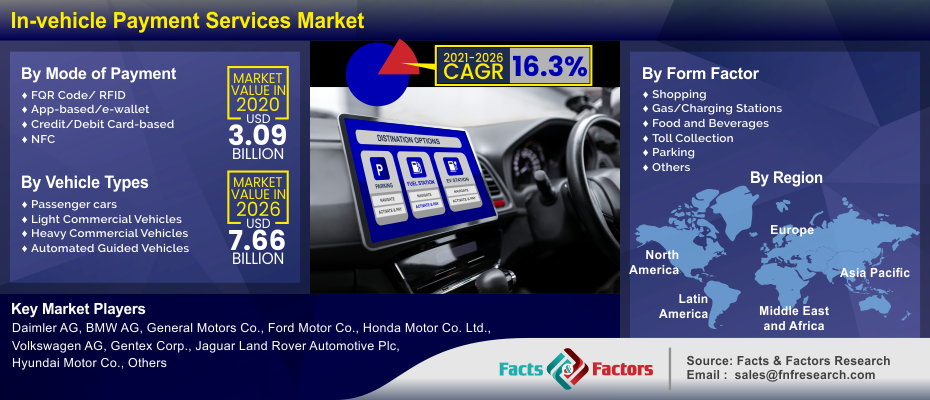
[193+ Pages Report] According to a Facts and Factors report, the global in-vehicle payment services market was accounted to be around USD 3.09 Billion in 2020, with annual sales of approximately USD 7.66 Billion by the end of 2026, representing a CAGR of around 16.3% from 2021 to 2026.

logoMarket Overview

In-vehicle payment services related to vehicle systems that are equipped with a payment technology that allows drivers to see and complete transactions with a variety of businesses, including gas stations, smart parking, and toll gates. In-vehicle payment systems allow passengers to make purchases from their car dashboards without having to take out any cards or gadgets, saving time for drivers and allowing them to arrive at their destination in a safer, faster, and more efficient manner.

In-vehicle Payment Services Market

To know more about this report | Request Free Sample Copy

logoIndustry Growth Factors

With the simplicity and convenience that various modalities of payment services provider to their drivers and passengers, in-vehicle payment services are gaining popularity. Automobile manufacturers like Mercedes-Benz, Honda, Jaguar Land Rover, BMW, General Motors, and Ford have included solutions and services into their vehicles. In-vehicle payment systems are likely to grow in popularity in the future years as linked automobiles and sophisticated entertainment become more common. Vehicle owners are currently searching for a hassle-free experience and an enhanced lifestyle in their hectic schedules. As a result, the ability to buy, order, and pay on the move without having to use a card or cash transaction saves time and allows commuters to travel securely. As a result, payment service providers such as MasterCard, Visa, and PayPal are aggressively forming alliances and cooperation with OEMs in order to provide effective in-vehicle payment systems.

The global pandemic has had a significant impact on the global economy. Due to the lockdowns and other limitations imposed by governments in various regions of the world as part of their efforts to contain the spread of the virus, supply chains have been interrupted and manufacturing activities at many production facilities have been temporarily suspended. As a result, COVID-19 had a negative influence on the market in the short term. Nonetheless, the growing demand among individuals for contactless payments to avoid any potential exposure to coronavirus, as urged by various governments, is projected to contribute to the expansion of the in-vehicle payment services market in the post-COVID-19 period.

logoSegmentation Analysis

The global in-vehicle payment services market is segmented on the basis of mode of payment as QR code/ RFID, app-based/e-wallet, credit/debit card-based, and NFC. By vehicle types, the market is divided into passenger cars, light commercial vehicles (LCVs), heavy commercial vehicles (HCVs), and automated guided vehicles. By form factor, the market is segmented into an embedded system, tethered system, and integrated system. By application, the market is divided into shopping; gas/charging stations, food and beverages, toll collection, parking, and others.

logoReport Scope

Report Attribute

Details

Market Size in 2020

USD 3.09 Billion

Projected Market Size in 2026

USD 7.66 Billion

CAGR Growth Rate

16.3% CAGR

Base Year

2020

Forecast Years

2021-2026

Key Market Players

Daimler AG, BMW AG, General Motors Co., Ford Motor Co., Honda Motor Co. Ltd., Volkswagen AG, Gentex Corp., Jaguar Land Rover Automotive Plc, Hyundai Motor Co., and ZF Friedrichshafen AG among others.

Key Segment

By Mode Of Payment, By Vehicle Type, By Form Factor, By Application and By Region

Major Regions Covered

North America, Europe, Asia Pacific, Latin America, and the Middle East & Africa

Purchase Options

Request customized purchase options to meet your research needs. Explore purchase options

logo Regional Analysis

Regionally the in-vehicle payment services market is segmented into five parts namely North America, Europe, Latin America, Asia Pacific, and The Middle East and Africa.

In 2020, North America had the highest revenue share, accounting for approximately more than 39% of the market share. The area has the highest percentage of linked vehicles. Furthermore, technological firms located in North America, such as Apple Inc. and Google Inc., have joined the automobile sector with their ability to develop and compete with automotive companies.

Similarly, in-between 2021 to 2026, the Asia Pacific regional market is expected to grow at a rapid rate. The expansion of the regional market is projected to be grow owing to the expanding population and rising levels of disposable income. Over the projection period, the adoption of the most modern technologies and continuous advancements in the way payments are made and processed will also play a key part in fuelling the regional market's growth.

logo Competitive Players

Some major players operating in the in-vehicle payment services market are :

  • Daimler AG
  • BMW AG
  • General Motors Co.
  • Ford Motor Co.
  • Honda Motor Co. Ltd.
  • Volkswagen AG
  • Gentex Corp.
  • Jaguar Land Rover Automotive Plc
  • Hyundai Motor Co.
  • ZF Friedrichshafen AG

logo By Mode of Payment:

  • QR Code/ RFID
  • App-based/e-wallet
  • Credit/Debit Card-based
  • NFC

logo By Vehicle Types:

  • Passenger cars
  • Light Commercial Vehicles (LCVs)
  • Heavy Commercial Vehicles (HCVs)
  • Automated Guided Vehicles

logo By Form Factor:

  • Embedded System
  • Tethered System
  • Integrated System

logo By Application:

  • Shopping
  • Gas/Charging Stations
  • Food and Beverages
  • Toll Collection
  • Parking
  • Others

logo By Region:

  • North America
    • The U.S.
    • Canada
  • Europe
    • France
    • The UK
    • Spain
    • Germany
    • Italy
    • Rest of Europe
  • Asia Pacific
    • China
    • Japan
    • India
    • South Korea
    • Southeast Asia
    • Rest of Asia Pacific
  • Latin America
    • Brazil
    • Mexico
    • Rest of Latin America
  • Middle East & Africa
    • GCC
    • South Africa
    • Rest of Middle East & Africa

Table of Content

  1. Chapter 1 Executive Summary
    1. 1.1. Introduction of In-vehicle Payment Services
    2. 1.2. Global In-vehicle Payment Services Market, 2020 & 2026 (USD Million)
    3. 1.3. Global In-vehicle Payment Services Market, 2016 – 2026 (USD Million)
    4. 1.4. Global In-vehicle Payment Services Market Absolute Revenue Opportunity, 2016 – 2026 (USD Million)
    5. 1.5. Global In-vehicle Payment Services Market Incremental Revenue Opportunity, 2020 – 2026 (USD Million)
    6. 1.6. COVID-19 Impacts on In-vehicle Payment Services Market
      1. 1.6.1. COVID-19 Impact on the Player
      2. 1.6.2. Business Strategies and Recommendations
  2. Chapter 2 In-vehicle Payment Services Market – Mode of Payment Analysis
    1. 2.1. Global In-vehicle Payment Services Market – Mode of Payment Overview
    2. 2.2. Global In-vehicle Payment Services Market Share, by Mode of Payment, 2020 & 2026 (USD Million)
    3. 2.3. QR Code/ RFID
      1. 2.3.1. Global QR Code/ RFID In-vehicle Payment Services Market, 2016 – 2026 (USD Million)
    4. 2.4. App-based/e-wallet
      1. 2.4.1. Global App-based/e-wallet In-vehicle Payment Services Market, 2016 – 2026 (USD Million)
    5. 2.5. Credit/Debit Card-based
      1. 2.5.1. Global Credit/Debit Card-based In-vehicle Payment Services Market, 2016 – 2026 (USD Million)
    6. 2.6. NFC
      1. 2.6.1. Global NFC In-vehicle Payment Services Market, 2016 – 2026 (USD Million)
  3. Chapter 3 In-vehicle Payment Services Market – Vehicle Types Analysis
    1. 3.1. Global In-vehicle Payment Services Market – Vehicle Types Overview
    2. 3.2. Global In-vehicle Payment Services Market Share, by Vehicle Types, 2020 & 2026 (USD Million)
    3. 3.3. Passenger cars
      1. 3.3.1. Global Passenger cars In-vehicle Payment Services Market, 2016 – 2026 (USD Million)
    4. 3.4. Light Commercial Vehicles (LCVs)
      1. 3.4.1. Global Light Commercial Vehicles (LCVs) In-vehicle Payment Services Market, 2016 – 2026 (USD Million)
    5. 3.5. Heavy Commercial Vehicles (HCVs)
      1. 3.5.1. Global Heavy Commercial Vehicles (HCVs) In-vehicle Payment Services Market, 2016 – 2026 (USD Million)
    6. 3.6. Automated Guided Vehicles
      1. 3.6.1. Global Automated Guided Vehicles In-vehicle Payment Services Market, 2016 – 2026 (USD Million)
  4. Chapter 4 In-vehicle Payment Services Market – Form Factor Analysis
    1. 4.1. Global In-vehicle Payment Services Market – Form Factor Overview
    2. 4.2. Global In-vehicle Payment Services Market Share, by Form Factor, 2020 & 2026 (USD Million)
    3. 4.3. Embedded System
      1. 4.3.1. Global Embedded System In-vehicle Payment Services Market, 2016 – 2026 (USD Million)
    4. 4.4. Tethered System
      1. 4.4.1. Global Tethered System In-vehicle Payment Services Market, 2016 – 2026 (USD Million)
    5. 4.5. Integrated System
      1. 4.5.1. Global Integrated System In-vehicle Payment Services Market, 2016 – 2026 (USD Million)
  5. Chapter 5 In-vehicle Payment Services Market – Application Analysis
    1. 5.1. Global In-vehicle Payment Services Market – Application Overview
    2. 5.2. Global In-vehicle Payment Services Market Share, by Application, 2020 & 2026 (USD Million)
    3. 5.3. Shopping
      1. 5.3.1. Global Shopping In-vehicle Payment Services Market, 2016 – 2026 (USD Million)
    4. 5.4. Gas/Charging Stations
      1. 5.4.1. Global Gas/Charging Stations In-vehicle Payment Services Market, 2016 – 2026 (USD Million)
    5. 5.5. Food and Beverages
      1. 5.5.1. Global Food and Beverages In-vehicle Payment Services Market, 2016 – 2026 (USD Million)
    6. 5.6. Toll Collection
      1. 5.6.1. Global Toll Collection In-vehicle Payment Services Market, 2016 – 2026 (USD Million)
    7. 5.7. Parking
      1. 5.7.1. Global Parking In-vehicle Payment Services Market, 2016 – 2026 (USD Million)
    8. 5.8. Others
      1. 5.8.1. Global Others In-vehicle Payment Services Market, 2016 – 2026 (USD Million)
  6. Chapter 6 In-vehicle Payment Services Market – Regional Analysis
    1. 6.1. Global In-vehicle Payment Services Market Regional Overview
    2. 6.2. Global In-vehicle Payment Services Market Share, by Region, 2020 & 2026 (USD Million)
    3. 6.3. North America
      1. 6.3.1. North America In-vehicle Payment Services Market, 2016 – 2026 (USD Million)
        1. 6.3.1.1. North America In-vehicle Payment Services Market, by Country, 2016 - 2026 (USD Million)
      2. 6.3.2. North America In-vehicle Payment Services Market, by Mode of Payment, 2016 – 2026
        1. 6.3.2.1. North America In-vehicle Payment Services Market, by Mode of Payment, 2016 – 2026 (USD Million)
      3. 6.3.3. North America In-vehicle Payment Services Market, by Vehicle Types, 2016 – 2026
        1. 6.3.3.1. North America In-vehicle Payment Services Market, by Vehicle Types, 2016 – 2026 (USD Million)
      4. 6.3.4. North America In-vehicle Payment Services Market, by Form Factor, 2016 – 2026
        1. 6.3.4.1. North America In-vehicle Payment Services Market, by Form Factor, 2016 – 2026 (USD Million)
      5. 6.3.5. North America In-vehicle Payment Services Market, by Application, 2016 – 2026
        1. 6.3.5.1. North America In-vehicle Payment Services Market, by Application, 2016 – 2026 (USD Million)
      6. 6.3.6. U.S.
        1. 6.3.6.1. U.S. In-vehicle Payment Services Market, 2016 – 2026 (USD Million)
      7. 6.3.7. Canada
        1. 6.3.7.1. Canada In-vehicle Payment Services Market, 2016 – 2026 (USD Million)
    4. 6.4. Europe
      1. 6.4.1. Europe In-vehicle Payment Services Market, 2016 – 2026 (USD Million)
        1. 6.4.1.1. Europe In-vehicle Payment Services Market, by Country, 2016 - 2026 (USD Million)
      2. 6.4.2. Europe In-vehicle Payment Services Market, by Mode of Payment, 2016 – 2026
        1. 6.4.2.1. Europe In-vehicle Payment Services Market, by Mode of Payment, 2016 – 2026 (USD Million)
      3. 6.4.3. Europe In-vehicle Payment Services Market, by Vehicle Types, 2016 – 2026
        1. 6.4.3.1. Europe In-vehicle Payment Services Market, by Vehicle Types, 2016 – 2026 (USD Million)
      4. 6.4.4. Europe In-vehicle Payment Services Market, by Form Factor, 2016 – 2026
        1. 6.4.4.1. Europe In-vehicle Payment Services Market, by Form Factor, 2016 – 2026 (USD Million)
      5. 6.4.5. Europe In-vehicle Payment Services Market, by Application, 2016 – 2026
        1. 6.4.5.1. Europe In-vehicle Payment Services Market, by Application, 2016 – 2026 (USD Million)
      6. 6.4.6. Germany
        1. 6.4.6.1. Germany In-vehicle Payment Services Market, 2016 – 2026 (USD Million)
      7. 6.4.7. France
        1. 6.4.7.1. France In-vehicle Payment Services Market, 2016 – 2026 (USD Million)
      8. 6.4.8. U.K.
        1. 6.4.8.1. U.K. In-vehicle Payment Services Market, 2016 – 2026 (USD Million)
      9. 6.4.9. Italy
        1. 6.4.9.1. Italy In-vehicle Payment Services Market, 2016 – 2026 (USD Million)
      10. 6.4.10. Spain
        1. 6.4.10.1. Spain In-vehicle Payment Services Market, 2016 – 2026 (USD Million)
      11. 6.4.11. Rest of Europe
        1. 6.4.11.1. Rest of Europe In-vehicle Payment Services Market, 2016 – 2026 (USD Million)
    5. 6.5. Asia Pacific
      1. 6.5.1. Asia Pacific In-vehicle Payment Services Market, 2016 – 2026 (USD Million)
        1. 6.5.1.1. Asia Pacific In-vehicle Payment Services Market, by Country, 2016 - 2026 (USD Million)
      2. 6.5.2. Asia Pacific In-vehicle Payment Services Market, by Mode of Payment, 2016 – 2026
        1. 6.5.2.1. Asia Pacific In-vehicle Payment Services Market, by Mode of Payment, 2016 – 2026 (USD Million)
      3. 6.5.3. Asia Pacific In-vehicle Payment Services Market, by Vehicle Types, 2016 – 2026
        1. 6.5.3.1. Asia Pacific In-vehicle Payment Services Market, by Vehicle Types, 2016 – 2026 (USD Million)
      4. 6.5.4. Asia Pacific In-vehicle Payment Services Market, by Form Factor, 2016 – 2026
        1. 6.5.4.1. Asia Pacific In-vehicle Payment Services Market, by Form Factor, 2016 – 2026 (USD Million)
      5. 6.5.5. Asia Pacific In-vehicle Payment Services Market, by Application, 2016 – 2026
        1. 6.5.5.1. Asia Pacific In-vehicle Payment Services Market, by Application, 2016 – 2026 (USD Million)
      6. 6.5.6. China
        1. 6.5.6.1. China In-vehicle Payment Services Market, 2016 – 2026 (USD Million)
      7. 6.5.7. Japan
        1. 6.5.7.1. Japan In-vehicle Payment Services Market, 2016 – 2026 (USD Million)
      8. 6.5.8. India
        1. 6.5.8.1. India In-vehicle Payment Services Market, 2016 – 2026 (USD Million)
      9. 6.5.9. South Korea
        1. 6.5.9.1. South Korea In-vehicle Payment Services Market, 2016 – 2026 (USD Million)
      10. 6.5.10. South-East Asia
        1. 6.5.10.1. South-East Asia In-vehicle Payment Services Market, 2016 – 2026 (USD Million)
      11. 6.5.11. Rest of Asia Pacific
        1. 6.5.11.1. Rest of Asia Pacific In-vehicle Payment Services Market, 2016 – 2026 (USD Million)
    6. 6.6. Latin America
      1. 6.6.1. Latin America In-vehicle Payment Services Market, 2016 – 2026 (USD Million)
        1. 6.6.1.1. Latin America In-vehicle Payment Services Market, by Country, 2016 - 2026 (USD Million)
      2. 6.6.2. Latin America In-vehicle Payment Services Market, by Mode of Payment, 2016 – 2026
        1. 6.6.2.1. Latin America In-vehicle Payment Services Market, by Mode of Payment, 2016 – 2026 (USD Million)
      3. 6.6.3. Latin America In-vehicle Payment Services Market, by Vehicle Types, 2016 – 2026
        1. 6.6.3.1. Latin America In-vehicle Payment Services Market, by Vehicle Types, 2016 – 2026 (USD Million)
      4. 6.6.4. Latin America In-vehicle Payment Services Market, by Form Factor, 2016 – 2026
        1. 6.6.4.1. Latin America In-vehicle Payment Services Market, by Form Factor, 2016 – 2026 (USD Million)
      5. 6.6.5. Latin America In-vehicle Payment Services Market, by Application, 2016 – 2026
        1. 6.6.5.1. Latin America In-vehicle Payment Services Market, by Application, 2016 – 2026 (USD Million)
      6. 6.6.6. Brazil
        1. 6.6.6.1. Brazil In-vehicle Payment Services Market, 2016 – 2026 (USD Million)
      7. 6.6.7. Mexico
        1. 6.6.7.1. Mexico In-vehicle Payment Services Market, 2016 – 2026 (USD Million)
      8. 6.6.8. Rest of Latin America
        1. 6.6.8.1. Rest of Latin America In-vehicle Payment Services Market, 2016 – 2026 (USD Million)
    7. 6.7. The Middle-East and Africa
      1. 6.7.1. The Middle-East and Africa In-vehicle Payment Services Market, 2016 – 2026 (USD Million)
        1. 6.7.1.1. The Middle-East and Africa In-vehicle Payment Services Market, by Country, 2016 - 2026 (USD Million)
      2. 6.7.2. The Middle-East and Africa In-vehicle Payment Services Market, by Mode of Payment, 2016 – 2026
        1. 6.7.2.1. The Middle-East and Africa In-vehicle Payment Services Market, by Mode of Payment, 2016 – 2026 (USD Million)
      3. 6.7.3. The Middle-East and Africa In-vehicle Payment Services Market, by Vehicle Types, 2016 – 2026
        1. 6.7.3.1. The Middle-East and Africa In-vehicle Payment Services Market, by Vehicle Types, 2016 – 2026 (USD Million)
      4. 6.7.4. The Middle-East and Africa In-vehicle Payment Services Market, by Form Factor, 2016 – 2026
        1. 6.7.4.1. The Middle-East and Africa In-vehicle Payment Services Market, by Form Factor, 2016 – 2026 (USD Million)
      5. 6.7.5. The Middle-East and Africa In-vehicle Payment Services Market, by Application, 2016 – 2026
        1. 6.7.5.1. The Middle-East and Africa In-vehicle Payment Services Market, by Application, 2016 – 2026 (USD Million)
      6. 6.7.6. GCC Countries
        1. 6.7.6.1. GCC Countries In-vehicle Payment Services Market, 2016 – 2026 (USD Million)
      7. 6.7.7. South Africa
        1. 6.7.7.1. South Africa In-vehicle Payment Services Market, 2016 – 2026 (USD Million)
      8. 6.7.8. Rest of Middle-East Africa
        1. 6.7.8.1. Rest of Middle-East Africa In-vehicle Payment Services Market, 2016 – 2026 (USD Million)
  7. Chapter 7 In-vehicle Payment Services Market – Competitive Landscape
    1. 7.1. Competitor Market Share – Revenue
    2. 7.2. Market Concentration Rate Analysis, Top 3 and Top 5 Players
    3. 7.3. Strategic Developments
      1. 7.3.1. Acquisitions and Mergers
      2. 7.3.2. New Products
      3. 7.3.3. Research & Development Activities
  8. Chapter 8 Company Profiles
    1. 8.1. BMW AG
      1. 8.1.1. Company Overview
      2. 8.1.2. Product/Service Portfolio
      3. 8.1.3. BMW AG Sales, Revenue, and Gross Margin
      4. 8.1.4. BMW AG Revenue and Growth Rate
      5. 8.1.5. BMW AG Market Share
      6. 8.1.6. Recent Initiatives, Funding/VC Activities, and Technological Innovations
    2. 8.2. Daimler AG
      1. 8.2.1. Company Overview
      2. 8.2.2. Product/Service Portfolio
      3. 8.2.3. Daimler AG Sales, Revenue, and Gross Margin
      4. 8.2.4. Daimler AG Revenue and Growth Rate
      5. 8.2.5. Daimler AG Market Share
      6. 8.2.6. Recent Initiatives, Funding/VC Activities, and Technological Innovations
    3. 8.3. Ford Motor Co.
      1. 8.3.1. Company Overview
      2. 8.3.2. Product/Service Portfolio
      3. 8.3.3. Ford Motor Co. Sales, Revenue, and Gross Margin
      4. 8.3.4. Ford Motor Co. Revenue and Growth Rate
      5. 8.3.5. Ford Motor Co. Market Share
      6. 8.3.6. Recent Initiatives, Funding/VC Activities, and Technological Innovations
    4. 8.4. General Motors Co.
      1. 8.4.1. Company Overview
      2. 8.4.2. Product/Service Portfolio
      3. 8.4.3. General Motors Co. Sales, Revenue, and Gross Margin
      4. 8.4.4. General Motors Co. Revenue and Growth Rate
      5. 8.4.5. General Motors Co. Market Share
      6. 8.4.6. Recent Initiatives, Funding/VC Activities, and Technological Innovations
    5. 8.5. Gentex Corp.
      1. 8.5.1. Company Overview
      2. 8.5.2. Product/Service Portfolio
      3. 8.5.3. Gentex Corp. Sales, Revenue, and Gross Margin
      4. 8.5.4. Gentex Corp. Revenue and Growth Rate
      5. 8.5.5. Gentex Corp. Market Share
      6. 8.5.6. Recent Initiatives, Funding/VC Activities, and Technological Innovations
    6. 8.6. Honda Motor Co. Ltd.
      1. 8.6.1. Company Overview
      2. 8.6.2. Product/Service Portfolio
      3. 8.6.3. Honda Motor Co. Ltd. Sales, Revenue, and Gross Margin
      4. 8.6.4. Honda Motor Co. Ltd. Revenue and Growth Rate
      5. 8.6.5. Honda Motor Co. Ltd. Market Share
      6. 8.6.6. Recent Initiatives, Funding/VC Activities, and Technological Innovations
    7. 8.7. Hyundai Motor Co.
      1. 8.7.1. Company Overview
      2. 8.7.2. Product/Service Portfolio
      3. 8.7.3. Hyundai Motor Co. Sales, Revenue, and Gross Margin
      4. 8.7.4. Hyundai Motor Co. Revenue and Growth Rate
      5. 8.7.5. Hyundai Motor Co. Market Share
      6. 8.7.6. Recent Initiatives, Funding/VC Activities, and Technological Innovations
    8. 8.8. JAGUAR LAND ROVER AUTOMOTIVE PLC
      1. 8.8.1. Company Overview
      2. 8.8.2. Product/Service Portfolio
      3. 8.8.3. JAGUAR LAND ROVER AUTOMOTIVE PLC Sales, Revenue, and Gross Margin
      4. 8.8.4. JAGUAR LAND ROVER AUTOMOTIVE PLC Revenue and Growth Rate
      5. 8.8.5. JAGUAR LAND ROVER AUTOMOTIVE PLC Market Share
      6. 8.8.6. Recent Initiatives, Funding/VC Activities, and Technological Innovations
    9. 8.9. Volkswagen AG
      1. 8.9.1. Company Overview
      2. 8.9.2. Product/Service Portfolio
      3. 8.9.3. Volkswagen AG Sales, Revenue, and Gross Margin
      4. 8.9.4. Volkswagen AG Revenue and Growth Rate
      5. 8.9.5. Volkswagen AG Market Share
      6. 8.9.6. Recent Initiatives, Funding/VC Activities, and Technological Innovations
    10. 8.10. ZF Friedrichshafen AG
      1. 8.10.1. Company Overview
      2. 8.10.2. Product/Service Portfolio
      3. 8.10.3. ZF Friedrichshafen AG Sales, Revenue, and Gross Margin
      4. 8.10.4. ZF Friedrichshafen AG Revenue and Growth Rate
      5. 8.10.5. ZF Friedrichshafen AG Market Share
      6. 8.10.6. Recent Initiatives, Funding/VC Activities, and Technological Innovations
  9. Chapter 9 In-vehicle Payment Services — Industry Analysis
    1. 9.1. Introduction and Taxonomy
    2. 9.2. In-vehicle Payment Services Market – Key Trends
      1. 9.2.1. Market Drivers
      2. 9.2.2. Market Restraints
      3. 9.2.3. Market Opportunities
    3. 9.3. Porter’s Five Forces Model
      1. 9.3.1. Bargaining Power of Buyers
      2. 9.3.2. Bargaining Power of Suppliers
      3. 9.3.3. Threat of Substitute
      4. 9.3.4. Threat of New Entrants
      5. 9.3.5. Rivalry among Existing Competitors
    4. 9.4. PESTEL Analysis
    5. 9.5. SWOT Analysis
    6. 9.6. Technology Roadmap and Timeline
    7. 9.7. In-vehicle Payment Services Market – Attractiveness Analysis
      1. 9.7.1. By Mode of Payment
      2. 9.7.2. By Vehicle Types
      3. 9.7.3. By Form Factor
      4. 9.7.4. By Application
      5. 9.7.5. By Region
  10. Chapter 10 Marketing Strategy Analysis
    1. 10.1. Marketing Channel
    2. 10.2. Direct Marketing
    3. 10.3. Indirect Marketing
    4. 10.4. Marketing Channel Development Trends
    5. 10.5. Economic/Political Environmental Change
  11. Chapter 11 Report Conclusion & Key Insights
    1. 11.1. Key Insights from Primary Interviews & Surveys Respondents
    2. 11.2. Key Takeaways from Analysts, Consultants, and Industry Leaders
  12. Chapter 12 Research Approach & Methodology
    1. 12.1. Report Description
    2. 12.2. Research Scope
    3. 12.3. Research Methodology
      1. 12.3.1. Secondary Research
      2. 12.3.2. Primary Research
      3. 12.3.3. Statistical Models
        1. 12.3.3.1. Company Share Analysis Model
        2. 12.3.3.2. Revenue Based Modeling
      4. 12.3.4. Research Limitations

      List of Figures

      Fig.1	Product Picture of In-vehicle Payment Services
      Fig.2	Global In-vehicle Payment Services Market, 2016 – 2026 (USD Million)
      Fig.3	Global In-vehicle Payment Services Market Absolute Revenue Opportunity, 2016 – 2026 (USD Million)
      Fig.4	Global In-vehicle Payment Services Market Incremental Revenue Opportunity, 2020 – 2026 (USD Million)
      Fig.5	COVID-19 Impacts on In-vehicle Payment Services Market
      Fig.6	COVID-19 Impact on the Player
      Fig.7	Business Strategies and Recommendations
      Fig.8	Global In-vehicle Payment Services Market Share, by Mode of Payment, 2020 & 2026 (USD Million)
      Fig.9	Global QR Code/ RFID In-vehicle Payment Services Market, 2016 – 2026 (USD Million)
      Fig.10	Global App-based/e-wallet In-vehicle Payment Services Market, 2016 – 2026 (USD Million)
      Fig.11	Global Credit/Debit Card-based In-vehicle Payment Services Market, 2016 – 2026 (USD Million)
      Fig.12	Global NFC In-vehicle Payment Services Market, 2016 – 2026 (USD Million)
      Fig.13	Global In-vehicle Payment Services Market Share, by Vehicle Types, 2020 & 2026 (USD Million)
      Fig.14	Global Passenger cars In-vehicle Payment Services Market, 2016 – 2026 (USD Million)
      Fig.15	Global Light Commercial Vehicles (LCVs) In-vehicle Payment Services Market, 2016 – 2026 (USD Million)
      Fig.16	Global Heavy Commercial Vehicles (HCVs) In-vehicle Payment Services Market, 2016 – 2026 (USD Million)
      Fig.17	Global Automated Guided Vehicles In-vehicle Payment Services Market, 2016 – 2026 (USD Million)
      Fig.18	Global In-vehicle Payment Services Market Share, by Form Factor, 2020 & 2026 (USD Million)
      Fig.19	Global Embedded System In-vehicle Payment Services Market, 2016 – 2026 (USD Million)
      Fig.20	Global Tethered System In-vehicle Payment Services Market, 2016 – 2026 (USD Million)
      Fig.21	Global Integrated System In-vehicle Payment Services Market, 2016 – 2026 (USD Million)
      Fig.22	Global In-vehicle Payment Services Market Share, by Application, 2020 & 2026 (USD Million)
      Fig.23	Global Shopping In-vehicle Payment Services Market, 2016 – 2026 (USD Million)
      Fig.24	Global Gas/Charging Stations In-vehicle Payment Services Market, 2016 – 2026 (USD Million)
      Fig.25	Global Food and Beverages In-vehicle Payment Services Market, 2016 – 2026 (USD Million)
      Fig.26	Global Toll Collection In-vehicle Payment Services Market, 2016 – 2026 (USD Million)
      Fig.27	Global Parking In-vehicle Payment Services Market, 2016 – 2026 (USD Million)
      Fig.28	Global Others In-vehicle Payment Services Market, 2016 – 2026 (USD Million)
      Fig.29	Global In-vehicle Payment Services Market Share, by Region, 2020 & 2026 (USD Million)
      Fig.30	North America In-vehicle Payment Services Market, 2016 – 2026 (USD Million)
      Fig.31	U.S. In-vehicle Payment Services Market, 2016 – 2026 (USD Million)
      Fig.32	Canada In-vehicle Payment Services Market, 2016 – 2026 (USD Million)
      Fig.33	Europe In-vehicle Payment Services Market, 2016 – 2026 (USD Million)
      Fig.34	Germany In-vehicle Payment Services Market, 2016 – 2026 (USD Million)
      Fig.35	France In-vehicle Payment Services Market, 2016 – 2026 (USD Million)
      Fig.36	U.K. In-vehicle Payment Services Market, 2016 – 2026 (USD Million)
      Fig.37	Italy In-vehicle Payment Services Market, 2016 – 2026 (USD Million)
      Fig.38	Spain In-vehicle Payment Services Market, 2016 – 2026 (USD Million)
      Fig.39	Rest of Europe In-vehicle Payment Services Market, 2016 – 2026 (USD Million)
      Fig.40	Asia Pacific In-vehicle Payment Services Market, 2016 – 2026 (USD Million)
      Fig.41	China In-vehicle Payment Services Market, 2016 – 2026 (USD Million)
      Fig.42	Japan In-vehicle Payment Services Market, 2016 – 2026 (USD Million)
      Fig.43	India In-vehicle Payment Services Market, 2016 – 2026 (USD Million)
      Fig.44	South  Korea In-vehicle Payment Services Market, 2016 – 2026 (USD Million)
      Fig.45	South-East Asia In-vehicle Payment Services Market, 2016 – 2026 (USD Million)
      Fig.46	Rest of Asia Pacific In-vehicle Payment Services Market, 2016 – 2026 (USD Million)
      Fig.47	Latin America In-vehicle Payment Services Market, 2016 – 2026 (USD Million)
      Fig.48	Brazil In-vehicle Payment Services Market, 2016 – 2026 (USD Million)
      Fig.49	Mexico In-vehicle Payment Services Market, 2016 – 2026 (USD Million)
      Fig.50	Rest of Latin America In-vehicle Payment Services Market, 2016 – 2026 (USD Million)
      Fig.51	The Middle-East and Africa In-vehicle Payment Services Market, 2016 – 2026 (USD Million)
      Fig.52	GCC Countries In-vehicle Payment Services Market, 2016 – 2026 (USD Million)
      Fig.53	South Africa In-vehicle Payment Services Market, 2016 – 2026 (USD Million)
      Fig.54	Rest of Middle-East Africa In-vehicle Payment Services Market, 2016 – 2026 (USD Million)
      Fig.55	Competitor Market Share – Revenue
      Fig.56	BMW AG Revenue and Growth Rate
      Fig.57	BMW AG Market Share
      Fig.58	Daimler AG Revenue and Growth Rate
      Fig.59	Daimler AG Market Share
      Fig.60	Ford Motor Co. Revenue and Growth Rate
      Fig.61	Ford Motor Co. Market Share
      Fig.62	General Motors Co. Revenue and Growth Rate
      Fig.63	General Motors Co. Market Share
      Fig.64	Gentex Corp. Revenue and Growth Rate
      Fig.65	Gentex Corp. Market Share
      Fig.66	Honda Motor Co. Ltd. Revenue and Growth Rate
      Fig.67	Honda Motor Co. Ltd. Market Share
      Fig.68	Hyundai Motor Co. Revenue and Growth Rate
      Fig.69	Hyundai Motor Co. Market Share
      Fig.70	JAGUAR LAND ROVER AUTOMOTIVE PLC Revenue and Growth Rate
      Fig.71	JAGUAR LAND ROVER AUTOMOTIVE PLC Market Share
      Fig.72	Volkswagen AG Revenue and Growth Rate
      Fig.73	Volkswagen AG Market Share
      Fig.74	ZF Friedrichshafen AG Revenue and Growth Rate
      Fig.75	ZF Friedrichshafen AG Market Share
      Fig.76	Market Dynamics
      Fig.77	PESTEL Analysis
      Fig.78	SWOT Analysis
      Fig.79	Technology Roadmap and Timeline
      Fig.80	Market Attractiveness Analysis – By Mode of Payment
      Fig.81	Market Attractiveness Analysis – By Vehicle Types
      Fig.82	Market Attractiveness Analysis – By Form Factor
      Fig.83	Market Attractiveness Analysis – By Application
      Fig.84	Market Attractiveness Analysis – By Region
      Fig.85	Market Channels
      Fig.86	Marketing Channel Development Trend
      Fig.87	Growth in World Gross Product, 2008-2018
      

      List of Tables

      	
      Table 1	Global In-vehicle Payment Services Market, 2020 & 2026 (USD Million)
      Table 2	Global In-vehicle Payment Services Market, by Mode of Payment, 2016 – 2026 (USD Million)
      Table 3	Global In-vehicle Payment Services Market, by Vehicle Types, 2016 – 2026 (USD Million)
      Table 4	Global In-vehicle Payment Services Market, by Form Factor, 2016 – 2026 (USD Million)
      Table 5	Global In-vehicle Payment Services Market, by Application, 2016 – 2026 (USD Million)
      Table 6	Global In-vehicle Payment Services Market, by Region, 2016 – 2026 (USD Million)
      Table 7	North America In-vehicle Payment Services Market, by Country, 2016 – 2026 (USD Million)
      Table 8	North America In-vehicle Payment Services Market, by Mode of Payment, 2016 – 2026 (USD Million)
      Table 9	North America In-vehicle Payment Services Market, by Vehicle Types, 2016 – 2026 (USD Million)
      Table 10 North America In-vehicle Payment Services Market, by Form Factor, 2016 – 2026 (USD Million)
      Table 11 North America In-vehicle Payment Services Market, by Application, 2016 – 2026 (USD Million)
      Table 12 Europe In-vehicle Payment Services Market, by Country, 2016 – 2026 (USD Million)
      Table 13 Europe In-vehicle Payment Services Market, by Mode of Payment, 2016 – 2026 (USD Million)
      Table 14 Europe In-vehicle Payment Services Market, by Vehicle Types, 2016 – 2026 (USD Million)
      Table 15 Europe In-vehicle Payment Services Market, by Form Factor, 2016 – 2026 (USD Million)
      Table 16 Europe In-vehicle Payment Services Market, by Application, 2016 – 2026 (USD Million)
      Table 17 Asia Pacific In-vehicle Payment Services Market, by Country, 2016 – 2026 (USD Million)
      Table 18 Asia Pacific In-vehicle Payment Services Market, by Mode of Payment, 2016 – 2026 (USD Million)
      Table 19 Asia Pacific In-vehicle Payment Services Market, by Vehicle Types, 2016 – 2026 (USD Million)
      Table 20 Asia Pacific In-vehicle Payment Services Market, by Form Factor, 2016 – 2026 (USD Million)
      Table 21 Asia Pacific In-vehicle Payment Services Market, by Application, 2016 – 2026 (USD Million)
      Table 22 Latin America In-vehicle Payment Services Market, by Country, 2016 – 2026 (USD Million)
      Table 23 Latin America In-vehicle Payment Services Market, by Mode of Payment, 2016 – 2026 (USD Million)
      Table 24 Latin America In-vehicle Payment Services Market, by Vehicle Types, 2016 – 2026 (USD Million)
      Table 25 Latin America In-vehicle Payment Services Market, by Form Factor, 2016 – 2026 (USD Million)
      Table 26 Latin America In-vehicle Payment Services Market, by Application, 2016 – 2026 (USD Million)
      Table 27 The Middle-East and Africa In-vehicle Payment Services Market, by Country, 2016 – 2026 (USD Million)
      Table 28 The Middle-East and Africa In-vehicle Payment Services Market, by Mode of Payment, 2016 – 2026 (USD Million)
      Table 29 The Middle-East and Africa In-vehicle Payment Services Market, by Vehicle Types, 2016 – 2026 (USD Million)
      Table 30 The Middle-East and Africa In-vehicle Payment Services Market, by Form Factor, 2016 – 2026 (USD Million)
      Table 31 The Middle-East and Africa In-vehicle Payment Services Market, by Application, 2016 – 2026 (USD Million)
      Table 32 Global In-vehicle Payment Services Market - Company Revenue Analysis, 2016 – 2019 (USD Million)
      Table 33 Global In-vehicle Payment Services Market - Company Revenue Share Analysis, 2016 – 2019 (%)
      Table 34 Acquisitions and Mergers
      Table 35 Market Drivers – Impact Analysis
      Table 36 Market Restraints
      Table 37 Market Opportunities
      

Industry Major Market Players

  • Daimler AG
  • BMW AG
  • General Motors Co.
  • Ford Motor Co.
  • Honda Motor Co. Ltd.
  • Volkswagen AG
  • Gentex Corp.
  • Jaguar Land Rover Automotive Plc
  • Hyundai Motor Co.
  • ZF Friedrichshafen AG