![]()
Search Market Research Report
Hemp Juice Market Size, Share Global Analysis Report, 2019 – 2026

Hemp Juice Market by Type (Organic, and Conventional), and By Application (Household, and Commercial), By Distribution Channel (Business to Business (B2B), Business to Consumer (B2C) (Hypermarket/Supermarket, Specialty Stores, Online Retailers, and Others)): Global Industry Perspective, Comprehensive Analysis and Forecast 2019 – 2026
Industry Insights
The report encompasses the forecast as well as analysis of the hemp juice market on the global and regional levels. The study displays historical data of 2016 to 2019along with a forecast from 2020 to 2026 based on revenue (USD Million) and volume (Thousand Liters). Additionally, the market growth drivers, opportunities, limitations, and trends are also included in the hemp juice market report.
We have included industry analysis models in our report and extensively demonstrated the key business strategies and competitive landscape of the hemp juice market in our study.
Our study also includes an analysis of Porter’s Five Forces framework for understanding the competitive strategies used by market competitors. It also encompasses PESTLE analysis and SWOT analysis.
 Key Insights from Primary Research
- As per our primary respondents, the North AmericaHemp Juicemarket is set to grow annually at a rate of around 5.0%
- It was established through primary research that the North AmericaHemp Juicemarket was valued at more than USD 170.00million in 2019
- In terms of volume, the North AmericaHemp Juicemarketstood at around 830.00Thousand Liters, in 2019.
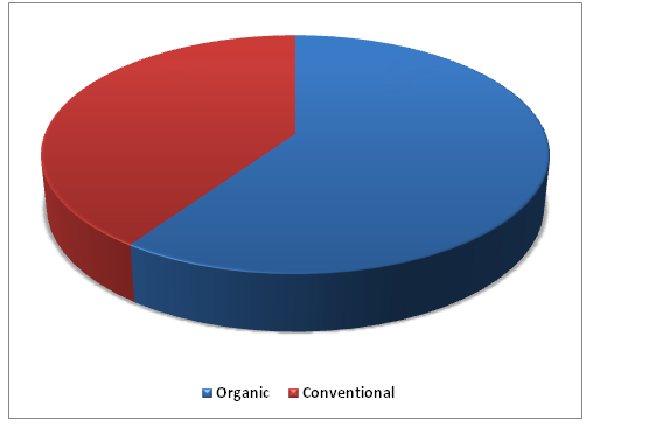
- The “organic hemp juice” category, on the basis of type segmentation, was the leading revenue-generating category stood at around 60.0% share, in 2019.
- On the basis of application segmentation, the “commercial”category accounting more than 60.0%, in 2019
Key Recommendations from Analysts
- Growing awareness of the benefits of hemp juice in the various countries across the globe is increasing the demand of hemp juice for pharmaceutical industry segment. There is a huge demand for pharmaceutical industryin North America, which is driving the pharmaceutical industry in the regions.
- Growing at a CAGR around 5.0%, North AmericaHemp Juicemarket provides numerous opportunities for all of the involved stakeholders across the entire value chain
- Our analysts have identified “organic hemp juice” and “commercial” categories as the leading investment pockets for North Americahemp juice marketin terms of type and application segmentations respectively
Global Hemp JuiceMarket Revenue Sharein 2019 – By Type
The report also offers an in-depth analysis of the market share of each industry player and gives an outline of the market position of key players in the hemp juice market. Moreover, the study offers wide coverage of key strategic improvements witnessed in the market such as acquisitions & mergers, new product launches, agreements, partnerships, collaborations & joint ventures, R&D activities, and geographical expansion of key players of the hemp juice market.
The study provides a decisive view of the hemp juice market by segmenting the hemp juice market based on type, application, distribution channel, and regions. All the segments have been analyzed based on present and future trends and the market is estimated from 2020 to 2026. The regional segmentation includes the current and forecast demand for North America, Europe, Asia Pacific, Latin America, and the Middle East and Africa.
The global hemp juice market is experiencing significant growth that is expected to continue over the upcoming years. A massive rise in the demand for hemp juice in cosmetic and pharmaceutical industries is likely to act as a key driver of the global hemp juice market.
The hemp juice market is segmented based on type, application, distribution channel, and region. Type-wise, the market is classified as intoorganic and conventional. In terms of application, the market segment is sectored into household and commercial. In terms of the distribution channel, the market is segmented into business to business (B2B) and business to consumer (B2C). Business to consumer (B2C) further segmented into hypermarket/supermarket, specialty stores, online retailers, and others.
Report Scope
Report Attribute |
Details |
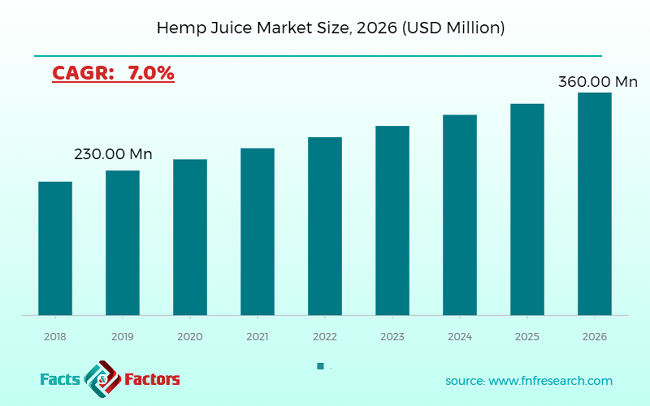
Market Size in 2019 |
USD 230.00 Million |
Projected Market Size in 2026 |
USD 360.00 Million |
CAGR Growth Rate |
7.0% CAGR |
Base Year |
2019 |
Forecast Years |
2020-2026 |
Key Market Players |
cloud 9 Hemp, Sana Hemp Juice, The Bristol Hemp Co., Portland Juice Co., Venus Hemp, Kama Hemp, and Claremont Collection GmbH., and others. |
Key Segment |
By Type, Application, and Region |
Major Regions Covered |
North America, Europe, Asia Pacific, Latin America, and the Middle East &, Africa |
Purchase Options |
Request customized purchase options to meet your research needs. Explore purchase options |
Key players operating in the Hemp Juice industry are as follows:
- Cloud 9 Hemp
- Sana Hemp Juice
- The Bristol Hemp Co.
- Portl Juice Co.
- Venus Hemp
- Kama Hemp
- Claremont Collection GmbH.
This report segments the hemp juice market as follows:
Type Analysis
- Organic
- Conventional
Application Analysis
- Household
- Commercial
Distribution Channel Analysis
- Business to Business (B2B)
- Business to Consumer (B2C)
- Hypermarket/Supermarket
- Specialty Stores
- Online Retailers
- Others
Regional Analysis
- North America
- U.S
- Canada
- Europe
- Germany
- France
- The U.K.
- Italy
- Spain
- Rest of Europe
- Asia Pacific
- China
- Japan
- India
- South Korea
- South-East Asia
- Rest of Asia pacific
- Latin America
- Brazil
- Mexico
- Rest of Latin America
- The Middle East and Africa
- GCC Countries
- South Africa
- Rest of Middle East & Africa
Key Pointers Addressed by the Report
- Historical data and forecast analysis of the market
- Drivers and Restraints affecting market dynamics
- Exhaustive analysis about the future market trends
- Comprehensive information about the leading market segments and region
- Strategic developments made by the competitive players and in-depth analysis about its impact on market growth
Table of Content
Industry Major Market Players
- Cloud 9 Hemp
- Sana Hemp Juice
- The Bristol Hemp Co.
- Portl Juice Co.
- Venus Hemp
- Kama Hemp
- Claremont Collection GmbH.


Copyright © 2025 - 2026, All Rights Reserved, Facts and Factors