Search Market Research Report

Discover Our Latest Reports
Discover Our Featured Reports
Discover Top Selling Reports

Hardware Security Modules (HSM) Market Size, Share Global Analysis Report, 2021 – 2026

report img

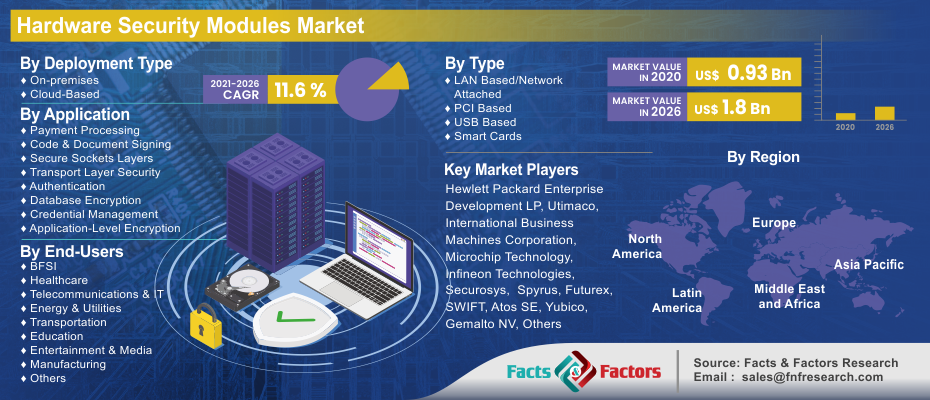
Hardware Security Modules (HSM) Market By Deployment Type (On-premises, Cloud Based), By Type (LAN Based/Network Attached, PCI Based, USB Based, Smart Cards), By Application (Payment Processing, Code & Document Signing, Secure Sockets Layers, Transport Layer Security, Authentication, Database Encryption, Credential Management, Application-Level Encryption), By End-Users (BFSI, Healthcare, Telecommunications & IT, Energy & Utilities, Transportation, Education, Entertainment & Media, Manufacturing and Others), By Region: Global Industry Perspective, Comprehensive Analysis, and Forecast 2021 – 2026

Industry Insights

[197+ Pages Report] The report published by Facts and Factors states that the global hardware security modules (HSM) market is estimated at USD 0.93 Billion in 2020 and it is further projected to reach USD 1.8 Billion by the end of 2026, rising at a CAGR of about 11.6% between 2021 and 2026. The report analyzes the hardware security modules (HSM) market’s drivers, restraints, opportunities, and challenges and the impact they have on consumption during the projection period.

logoGlobal Hardware Security Modules Market: Overview

A Hardware Security Module (HSM) is a physical device that adds additional security to sensitive data. This device is used to perform critical operations like encryption, decryption, and authentication for applications, identities, and databases. Businesses can employ hardware security modules to protect valuable trade secrets by guaranteeing that only authorized persons have access to the module in order to perform a cryptography key exchange. The hardware security modules module manages the whole cryptographic key lifecycle, from provisioning, maintaining, and storing keys to disposing or archiving them. A hardware security modules module can also record digital signatures, and all access transactions are logged to generate an audit trail.

Hardware Security Modules Market

To know more about this report | Request Free Sample Copy

logoGlobal Hardware Security Modules Market: Growth Factors

Cryptography at the hardware level is the root of providing security to many processes such as document signing, authentication, and application-level encryption. If these processes are not properly managed, they can become complex, expensive, and risk-prone. To manage the entire life cycle of keys, hardware security modules can be used. These modules are dedicated cryptographic hardware modules that create an isolated zone for the cryptographic functions. Key management is employed within an organization’s IT infrastructure to manage the number and diversity of keys. Hardware security modules enable organizations to improve the security of data encryption and digital signing processes by protecting keys and operations with tamper-resistant hardware.

Thus, the ability of these modules to enable effective management of cryptographic keys is expected to drive the market. Adoption of cloud is rapidly increasing among the industries, giving rise to many security challenges for the providers of cloud services, especially in dealing with the complexity of privacy and data protection regulations. Companies are accumulating massive amounts of data, ranging from highly confidential financial, business, and customer data to fairly unimportant information. They are also moving more of their data to the cloud and collecting it in more places than ever – private, public, and hybrid clouds, software-as-a-service applications, and so on. As they do this, companies are finding how complicated it can be to protect all their data across multiple environments.

For instance, they no longer know where all their data and applications are. With most of their functions and data housed on third-party structures, companies no longer have prominence in who is using and accessing their data and applications, which devices are being used for access, or how their data is potentially being used or shared. They have no understanding of how cloud providers are securing and storing their data. Even though nearly all cloud providers have state-of-the-art security, this security is limited due to the limited usage of this security by cloud users. Different cloud providers have different capabilities, which can result in unreliable cloud data security and protection.

To guarantee the security of data on the cloud, providers of cloud services are adopting technologies such as encryption, tokenization, and other cryptographic solutions, which can provide secure data transfers and safety for data stored on the cloud. The demand for HSMs for securing the data and information on the cloud environment is likely to provide huge opportunities to the manufacturers and cloud service providers to develop customized solutions that provide key management and key storage as a managed service.

logoGlobal Hardware Security Modules Market: Segmentation

The global hardware security modules market is segmented on the basis of deployment type as on-premises, cloud-based.

Based on type, the market has been categorized into LAN Based/Network Attached, PCI-based, USB based and smart cards. On the basis of Applications payment processing, code & document signing, secure sockets layers, transport layer security, authentication, database encryption, credential management, and application-level encryption.  In terms of end-users, the market has been segmented intoBFSI, healthcare, telecommunications & IT, energy & utilities, transportation, education, entertainment & media, manufacturing, and others.

logoReport Scope

Report Attribute

Details

Market Size in 2020

USD 0.93 Billion

Projected Market Size in 2026

USD 1.8 Billion

CAGR Growth Rate

11.6% CAGR

Base Year

2020

Forecast Years

2021-2026

Key Market Players

Hewlett Packard Enterprise Development LP, Utimaco, International Business Machines Corporation, Microchip Technology, Infineon Technologies, Securosys,  Spyrus, Futurex, SWIFT, Atos SE, Yubico, Gemalto NV,  Thales e-Security, Ultra Electronics, Enthrust Co., Rambus.com, Cardcontact Systems, JN UNION, JN TASS, Beijing Sansec Technology, and Micro Focus among others.

Key Segment

By Deployment Type, By Type, By Application, By End-Users, and By Region

Major Regions Covered

North America, Europe, Asia Pacific, Latin America, and the Middle East & Africa

Purchase Options

Request customized purchase options to meet your research needs. Explore purchase options

logoGlobal Hardware Security Modules Market: Regional Analysis

Geographically, the market is widespread across five major regions, namely North America, Europe, Asia Pacific, the Middle East & Africa, and Latin America. They are further categorized into countries. Furthermore, the fastest-growing region for Hardware Security Modules Market is projected to be Latin America, followed by the Asia Pacific during the forecast period. Due to the introduction of new regulatory compliance requirements and implementation of modern technologies such as cloud loT, the demand in Latin America is expected to grow at the highest rate during the forecast period, creating an enormous opportunity for data and information security.

However, high anticipated growth in the Asia Pacific HSM market can be attributed to the growing focus on payment system digitization.  Due to its various benefits such as cheaper price compared to LAN-based HSMs and USB-based HSMs, compactness, profitability functionality, demand is also projected to rise during the forecast period. In February 2017, Utimaco introduces the new generation HSM, Utimaco security server 4.10 with a strong security boost that is needed for cloud applications. It provides unrivaled flexibility and security for HSM service in the cloud.

The European market for hardware security modules has been segmented into Germany, the UK, France, Italy, the Netherlands, and the Rest of Europe. The thriving BFSI, IT & Telecommunications, and medical and life sciences, along with the automotive industry in the region, act as an opportunity for the market. The growth of 4G LTE technology in the region and ongoing developments and smaller deployments of 5G infrastructure is expected to drive the need for enhanced network security, leading to increased demand for hardware security modules across the IT and telecommunications sector.

logoGlobal Hardware Security Modules Market: Competitive Players

Major players in the market are :

  • Hewlett Packard Enterprise Development LP
  • Utimaco
  • International Business Machines Corporation
  • Microchip Technology
  • Infineon Technologies
  • Securosys
  • Spyrus
  • Futurex
  • SWIFT
  • Atos SE
  • Yubico
  • Gemalto NV
  • Thales e-Security
  • Ultra Electronics
  • Enthrust Co.
  • Rambus.com
  • Cardcontact Systems
  • JN UNION
  • JN TASS
  • Beijing Sansec Technology
  • Micro Focus 

logoGlobal Hardware Security Modules Market: Deployment Type

  • On-premises
  • Cloud-Based

logoGlobal Hardware Security Modules Market: By Type

  • LAN Based/Network Attached
  • PCI Based
  • USB Based
  • Smart Cards

logoGlobal Hardware Security Modules Market: By Application

  • Payment Processing
  • Code & Document Signing
  • Secure Sockets Layers
  • Transport Layer Security
  • Authentication
  • Database Encryption
  • Credential Management
  • Application-Level Encryption

logoGlobal Hardware Security Modules Market: By End-Users

  • BFSI
  • Healthcare
  • Telecommunications & IT
  • Energy & Utilities
  • Transportation
  • Education
  • Entertainment & Media
  • Manufacturing
  • Others

logoGlobal Hardware Security Modules Market: By Region

  • North America
    • The U.S.
    • Canada
  • Europe
    • France
    • The UK
    • Spain
    • Germany
    • Italy
    • Rest of Europe
  • Asia Pacific
    • China
    • Japan
    • India
    • South Korea
    • Southeast Asia
    • Rest of Asia Pacific
  • Latin America
    • Brazil
    • Mexico
    • Rest of Latin America
  • Middle East & Africa
    • GCC
    • South Africa
    • Rest of the Middle East & Africa

Table of Content

  1. Chapter 1 Executive Summary
    1. 1.1. Introduction of Hardware Security Modules
    2. 1.2. Global Hardware Security Modules Market, 2020 & 2026 (USD Billion)
    3. 1.3. GlobalHardware Security ModulesMarket, 2016 – 2026 (USD Billion)
    4. 1.4. GlobalHardware Security ModulesMarket Absolute Revenue Opportunity, 2016 – 2026 (USD Billion)
    5. 1.5. GlobalHardware Security ModulesMarket Incremental Revenue Opportunity, 2020 – 2026 (USD Billion)
    6. 1.6. COVID-19 Impacts on Hardware Security Modules Market
      1. 1.6.1. COVID-19 Impact on the Players
      2. 1.6.2. Business Strategies and Recommendations
  2. Chapter 2 Hardware Security ModulesMarket – Deployment Type Analysis
    1. 2.1. GlobalHardware Security ModulesMarket – Deployment Type Overview
    2. 2.2. GlobalHardware Security ModulesMarket Share, by Deployment Type, 2020 & 2026 (USD Billion)
    3. 2.3. On-premises
      1. 2.3.1. Global On-premisesHardware Security ModulesMarket, 2016 – 2026 (USD Billion)
    4. 2.4. Cloud Based
      1. 2.4.1. Global Cloud BasedHardware Security ModulesMarket, 2016 – 2026 (USD Billion)
  3. Chapter 3 Hardware Security ModulesMarket – Type Analysis
    1. 3.1. GlobalHardware Security ModulesMarket – Type Overview
    2. 3.2. GlobalHardware Security ModulesMarket Share, by Type, 2020 & 2026 (USD Billion)
    3. 3.3. LAN Based/Network Attached
      1. 3.3.1. Global LAN Based/Network AttachedHardware Security ModulesMarket, 2016 – 2026 (USD Billion)
    4. 3.4. PCI Based
      1. 3.4.1. Global PCI BasedHardware Security ModulesMarket, 2016 – 2026 (USD Billion)
    5. 3.5. USB Based
      1. 3.5.1. Global USB BasedHardware Security ModulesMarket, 2016 – 2026 (USD Billion)
    6. 3.6. Smart Cards
      1. 3.6.1. Global Smart CardsHardware Security ModulesMarket, 2016 – 2026 (USD Billion)
  4. Chapter 4 Hardware Security ModulesMarket – Application Analysis
    1. 4.1. GlobalHardware Security ModulesMarket – Application Overview
    2. 4.2. GlobalHardware Security ModulesMarket Share, by Application, 2020 & 2026 (USD Billion)
    3. 4.3. Payment Processing
      1. 4.3.1. Global Payment ProcessingHardware Security ModulesMarket, 2016 – 2026 (USD Billion)
    4. 4.4. Code & Document Signing
      1. 4.4.1. Global Code & Document SigningHardware Security ModulesMarket, 2016 – 2026 (USD Billion)
    5. 4.5. Secure Sockets Layers
      1. 4.5.1. Global Secure Sockets LayersHardware Security ModulesMarket, 2016 – 2026 (USD Billion)
    6. 4.6. Transport Layer Security
      1. 4.6.1. Global Transport Layer SecurityHardware Security ModulesMarket, 2016 – 2026 (USD Billion)
    7. 4.7. Authentication
      1. 4.7.1. Global AuthenticationHardware Security ModulesMarket, 2016 – 2026 (USD Billion)
    8. 4.8. Database Encryption
      1. 4.8.1. Global Database EncryptionHardware Security ModulesMarket, 2016 – 2026 (USD Billion)
    9. 4.9. Credential Management
      1. 4.9.1. Global Credential ManagementHardware Security ModulesMarket, 2016 – 2026 (USD Billion)
    10. 4.10. Application-Level Encryption
      1. 4.10.1. Global Application-Level EncryptionHardware Security ModulesMarket, 2016 – 2026 (USD Billion)
  5. Chapter 5 Hardware Security ModulesMarket – End-Users Analysis
    1. 5.1. GlobalHardware Security ModulesMarket – End-Users Overview
    2. 5.2. GlobalHardware Security ModulesMarket Share, by End-Users, 2020 & 2026 (USD Billion)
    3. 5.3. BFSI
      1. 5.3.1. Global BFSIHardware Security ModulesMarket, 2016 – 2026 (USD Billion)
    4. 5.4. Healthcare
      1. 5.4.1. Global HealthcareHardware Security ModulesMarket, 2016 – 2026 (USD Billion)
    5. 5.5. Telecommunications & IT
      1. 5.5.1. Global Telecommunications & ITHardware Security ModulesMarket, 2016 – 2026 (USD Billion)
    6. 5.6. Energy & Utilities
      1. 5.6.1. Global Energy & UtilitiesHardware Security ModulesMarket, 2016 – 2026 (USD Billion)
    7. 5.7. Transportation
      1. 5.7.1. Global TransportationHardware Security ModulesMarket, 2016 – 2026 (USD Billion)
    8. 5.8. Education
      1. 5.8.1. Global EducationHardware Security ModulesMarket, 2016 – 2026 (USD Billion)
    9. 5.9. Entertainment & Media
      1. 5.9.1. Global Entertainment & MediaHardware Security ModulesMarket, 2016 – 2026 (USD Billion)
    10. 5.10. Manufacturing
      1. 5.10.1. Global ManufacturingHardware Security ModulesMarket, 2016 – 2026 (USD Billion)
    11. 5.11. Others
      1. 5.11.1. Global OthersHardware Security ModulesMarket, 2016 – 2026 (USD Billion)
  6. Chapter 6 Hardware Security ModulesMarket – Regional Analysis
    1. 6.1. GlobalHardware Security ModulesMarket Regional Overview
    2. 6.2. GlobalHardware Security ModulesMarket Share, by Region, 2020 & 2026 (USD Billion)
    3. 6.3. North America
      1. 6.3.1. North AmericaHardware Security ModulesMarket, 2016 – 2026 (USD Billion)
        1. 6.3.1.1. North AmericaHardware Security ModulesMarket, by Country, 2016 - 2026 (USD Billion)
      2. 6.3.2. North AmericaHardware Security ModulesMarket, by Deployment Type, 2016 – 2026
        1. 6.3.2.1. North AmericaHardware Security ModulesMarket, by Deployment Type, 2016 – 2026 (USD Billion)
      3. 6.3.3. North AmericaHardware Security ModulesMarket, by Type, 2016 – 2026
        1. 6.3.3.1. North AmericaHardware Security ModulesMarket, by Type, 2016 – 2026 (USD Billion)
      4. 6.3.4. North AmericaHardware Security ModulesMarket, by Application, 2016 – 2026
        1. 6.3.4.1. North AmericaHardware Security ModulesMarket, by Application, 2016 – 2026 (USD Billion)
      5. 6.3.5. North AmericaHardware Security ModulesMarket, by End-Users, 2016 – 2026
        1. 6.3.5.1. North AmericaHardware Security ModulesMarket, by End-Users, 2016 – 2026 (USD Billion)
      6. 6.3.6. U.S.
        1. 6.3.6.1. U.S.Hardware Security ModulesMarket, 2016 – 2026 (USD Billion)
      7. 6.3.7. Canada
        1. 6.3.7.1. CanadaHardware Security ModulesMarket, 2016 – 2026 (USD Billion)
    4. 6.4. Europe
      1. 6.4.1. EuropeHardware Security ModulesMarket, 2016 – 2026 (USD Billion)
        1. 6.4.1.1. EuropeHardware Security ModulesMarket, by Country, 2016 - 2026 (USD Billion)
      2. 6.4.2. EuropeHardware Security ModulesMarket, by Deployment Type, 2016 – 2026
        1. 6.4.2.1. EuropeHardware Security ModulesMarket, by Deployment Type, 2016 – 2026 (USD Billion)
      3. 6.4.3. EuropeHardware Security ModulesMarket, by Type, 2016 – 2026
        1. 6.4.3.1. EuropeHardware Security ModulesMarket, by Type, 2016 – 2026 (USD Billion)
      4. 6.4.4. EuropeHardware Security ModulesMarket, by Application, 2016 – 2026
        1. 6.4.4.1. EuropeHardware Security ModulesMarket, by Application, 2016 – 2026 (USD Billion)
      5. 6.4.5. EuropeHardware Security ModulesMarket, by End-Users, 2016 – 2026
        1. 6.4.5.1. EuropeHardware Security ModulesMarket, by End-Users, 2016 – 2026 (USD Billion)
      6. 6.4.6. Germany
        1. 6.4.6.1. GermanyHardware Security ModulesMarket, 2016 – 2026 (USD Billion)
      7. 6.4.7. France
        1. 6.4.7.1. FranceHardware Security ModulesMarket, 2016 – 2026 (USD Billion)
      8. 6.4.8. U.K.
        1. 6.4.8.1. U.K.Hardware Security ModulesMarket, 2016 – 2026 (USD Billion)
      9. 6.4.9. Italy
        1. 6.4.9.1. ItalyHardware Security ModulesMarket, 2016 – 2026 (USD Billion)
      10. 6.4.10. Spain
        1. 6.4.10.1. SpainHardware Security ModulesMarket, 2016 – 2026 (USD Billion)
      11. 6.4.11. Rest of Europe
        1. 6.4.11.1. Rest of EuropeHardware Security ModulesMarket, 2016 – 2026 (USD Billion)
    5. 6.5. Asia Pacific
      1. 6.5.1. Asia PacificHardware Security ModulesMarket, 2016 – 2026 (USD Billion)
        1. 6.5.1.1. Asia PacificHardware Security ModulesMarket, by Country, 2016 - 2026 (USD Billion)
      2. 6.5.2. Asia PacificHardware Security ModulesMarket, by Deployment Type, 2016 – 2026
        1. 6.5.2.1. Asia PacificHardware Security ModulesMarket, by Deployment Type, 2016 – 2026 (USD Billion)
      3. 6.5.3. Asia PacificHardware Security ModulesMarket, by Type, 2016 – 2026
        1. 6.5.3.1. Asia PacificHardware Security ModulesMarket, by Type, 2016 – 2026 (USD Billion)
      4. 6.5.4. Asia PacificHardware Security ModulesMarket, by Application, 2016 – 2026
        1. 6.5.4.1. Asia PacificHardware Security ModulesMarket, by Application, 2016 – 2026 (USD Billion)
      5. 6.5.5. Asia PacificHardware Security ModulesMarket, by End-Users, 2016 – 2026
        1. 6.5.5.1. Asia PacificHardware Security ModulesMarket, by End-Users, 2016 – 2026 (USD Billion)
      6. 6.5.6. China
        1. 6.5.6.1. ChinaHardware Security ModulesMarket, 2016 – 2026 (USD Billion)
      7. 6.5.7. Japan
        1. 6.5.7.1. JapanHardware Security ModulesMarket, 2016 – 2026 (USD Billion)
      8. 6.5.8. India
        1. 6.5.8.1. IndiaHardware Security ModulesMarket, 2016 – 2026 (USD Billion)
      9. 6.5.9. SouthKorea
        1. 6.5.9.1. SouthKoreaHardware Security ModulesMarket, 2016 – 2026 (USD Billion)
      10. 6.5.10. South-East Asia
        1. 6.5.10.1. South-East AsiaHardware Security ModulesMarket, 2016 – 2026 (USD Billion)
      11. 6.5.11. Rest of Asia Pacific
        1. 6.5.11.1. Rest of Asia PacificHardware Security ModulesMarket, 2016 – 2026 (USD Billion)
    6. 6.6. Latin America
      1. 6.6.1. Latin AmericaHardware Security ModulesMarket, 2016 – 2026 (USD Billion)
        1. 6.6.1.1. Latin AmericaHardware Security ModulesMarket, by Country, 2016 - 2026 (USD Billion)
      2. 6.6.2. Latin AmericaHardware Security ModulesMarket, by Deployment Type, 2016 – 2026
        1. 6.6.2.1. Latin AmericaHardware Security ModulesMarket, by Deployment Type, 2016 – 2026 (USD Billion)
      3. 6.6.3. Latin AmericaHardware Security ModulesMarket, by Type, 2016 – 2026
        1. 6.6.3.1. Latin AmericaHardware Security ModulesMarket, by Type, 2016 – 2026 (USD Billion)
      4. 6.6.4. Latin AmericaHardware Security ModulesMarket, by Application, 2016 – 2026
        1. 6.6.4.1. Latin AmericaHardware Security ModulesMarket, by Application, 2016 – 2026 (USD Billion)
      5. 6.6.5. Latin AmericaHardware Security ModulesMarket, by End-Users, 2016 – 2026
        1. 6.6.5.1. Latin AmericaHardware Security ModulesMarket, by End-Users, 2016 – 2026 (USD Billion)
      6. 6.6.6. Brazil
        1. 6.6.6.1. BrazilHardware Security ModulesMarket, 2016 – 2026 (USD Billion)
      7. 6.6.7. Mexico
        1. 6.6.7.1. MexicoHardware Security ModulesMarket, 2016 – 2026 (USD Billion)
      8. 6.6.8. Rest of Latin America
        1. 6.6.8.1. Rest of Latin AmericaHardware Security ModulesMarket, 2016 – 2026 (USD Billion)
    7. 6.7. The Middle-East and Africa
      1. 6.7.1. The Middle-East and AfricaHardware Security ModulesMarket, 2016 – 2026 (USD Billion)
        1. 6.7.1.1. The Middle-East and AfricaHardware Security ModulesMarket, by Country, 2016 - 2026 (USD Billion)
      2. 6.7.2. The Middle-East and AfricaHardware Security ModulesMarket, by Deployment Type, 2016 – 2026
        1. 6.7.2.1. The Middle-East and AfricaHardware Security ModulesMarket, by Deployment Type, 2016 – 2026 (USD Billion)
      3. 6.7.3. The Middle-East and AfricaHardware Security ModulesMarket, by Type, 2016 – 2026
        1. 6.7.3.1. The Middle-East and AfricaHardware Security ModulesMarket, by Type, 2016 – 2026 (USD Billion)
      4. 6.7.4. The Middle-East and AfricaHardware Security ModulesMarket, by Application, 2016 – 2026
        1. 6.7.4.1. The Middle-East and AfricaHardware Security ModulesMarket, by Application, 2016 – 2026 (USD Billion)
      5. 6.7.5. The Middle-East and AfricaHardware Security ModulesMarket, by End-Users, 2016 – 2026
        1. 6.7.5.1. The Middle-East and AfricaHardware Security ModulesMarket, by End-Users, 2016 – 2026 (USD Billion)
      6. 6.7.6. GCC Countries
        1. 6.7.6.1. GCC CountriesHardware Security ModulesMarket, 2016 – 2026 (USD Billion)
      7. 6.7.7. South Africa
        1. 6.7.7.1. South AfricaHardware Security ModulesMarket, 2016 – 2026 (USD Billion)
      8. 6.7.8. Rest of Middle-East Africa
        1. 6.7.8.1. Rest of Middle-East AfricaHardware Security ModulesMarket, 2016 – 2026 (USD Billion)
  7. Chapter 7 Hardware Security ModulesMarket – Competitive Landscape
    1. 7.1. Competitor Market Share – Revenue
    2. 7.2. Market Concentration Rate Analysis, Top 3 and Top 5 Players
    3. 7.3. Strategic Developments
      1. 7.3.1. Acquisitions and Mergers
      2. 7.3.2. New Products
      3. 7.3.3. Research & Development Activities
  8. Chapter 8 Company Profiles
    1. 8.1. Hewlett Packard Enterprise Development LP
      1. 8.1.1. Company Overview
      2. 8.1.2. Product/Service Portfolio
      3. 8.1.3. Hewlett Packard Enterprise Development LP Sales, Revenue, and Gross Margin
      4. 8.1.4. Hewlett Packard Enterprise Development LP Revenue and Growth Rate
      5. 8.1.5. Hewlett Packard Enterprise Development LP Market Share
      6. 8.1.6. Recent Initiatives, Funding/VC Activities, and Technological Innovations
    2. 8.2. Utimaco
      1. 8.2.1. Company Overview
      2. 8.2.2. Product/Service Portfolio
      3. 8.2.3. Utimaco Sales, Revenue, and Gross Margin
      4. 8.2.4. Utimaco Revenue and Growth Rate
      5. 8.2.5. Utimaco Market Share
      6. 8.2.6. Recent Initiatives, Funding/VC Activities, and Technological Innovations
    3. 8.3. International Business Machines Corporation
      1. 8.3.1. Company Overview
      2. 8.3.2. Product/Service Portfolio
      3. 8.3.3. International Business Machines Corporation Sales, Revenue, and Gross Margin
      4. 8.3.4. International Business Machines Corporation Revenue and Growth Rate
      5. 8.3.5. International Business Machines Corporation Market Share
      6. 8.3.6. Recent Initiatives, Funding/VC Activities, and Technological Innovations
    4. 8.4. Microchip Technology
      1. 8.4.1. Company Overview
      2. 8.4.2. Product/Service Portfolio
      3. 8.4.3. Microchip Technology Sales, Revenue, and Gross Margin
      4. 8.4.4. Microchip Technology Revenue and Growth Rate
      5. 8.4.5. Microchip Technology Market Share
      6. 8.4.6. Recent Initiatives, Funding/VC Activities, and Technological Innovations
    5. 8.5. Infineon Technologies
      1. 8.5.1. Company Overview
      2. 8.5.2. Product/Service Portfolio
      3. 8.5.3. Infineon Technologies Sales, Revenue, and Gross Margin
      4. 8.5.4. Infineon Technologies Revenue and Growth Rate
      5. 8.5.5. Infineon Technologies Market Share
      6. 8.5.6. Recent Initiatives, Funding/VC Activities, and Technological Innovations
    6. 8.6. Securosys
      1. 8.6.1. Company Overview
      2. 8.6.2. Product/Service Portfolio
      3. 8.6.3. Securosys Sales, Revenue, and Gross Margin
      4. 8.6.4. Securosys Revenue and Growth Rate
      5. 8.6.5. Securosys Market Share
      6. 8.6.6. Recent Initiatives, Funding/VC Activities, and Technological Innovations
    7. 8.7. Spyrus
      1. 8.7.1. Company Overview
      2. 8.7.2. Product/Service Portfolio
      3. 8.7.3. Spyrus Sales, Revenue, and Gross Margin
      4. 8.7.4. Spyrus Revenue and Growth Rate
      5. 8.7.5. Spyrus Market Share
      6. 8.7.6. Recent Initiatives, Funding/VC Activities, and Technological Innovations
    8. 8.8. Futurex
      1. 8.8.1. Company Overview
      2. 8.8.2. Product/Service Portfolio
      3. 8.8.3. Futurex Sales, Revenue, and Gross Margin
      4. 8.8.4. Futurex Revenue and Growth Rate
      5. 8.8.5. Futurex Market Share
      6. 8.8.6. Recent Initiatives, Funding/VC Activities, and Technological Innovations
    9. 8.9. SWIFT
      1. 8.9.1. Company Overview
      2. 8.9.2. Product/Service Portfolio
      3. 8.9.3. SWIFT Sales, Revenue, and Gross Margin
      4. 8.9.4. SWIFT Revenue and Growth Rate
      5. 8.9.5. SWIFT Market Share
      6. 8.9.6. Recent Initiatives, Funding/VC Activities, and Technological Innovations
    10. 8.10. Atos SE
      1. 8.10.1. Company Overview
      2. 8.10.2. Product/Service Portfolio
      3. 8.10.3. Atos SE Sales, Revenue, and Gross Margin
      4. 8.10.4. Atos SE Revenue and Growth Rate
      5. 8.10.5. Atos SE Market Share
      6. 8.10.6. Recent Initiatives, Funding/VC Activities, and Technological Innovations
    11. 8.11. Yubico
      1. 8.11.1. Company Overview
      2. 8.11.2. Product/Service Portfolio
      3. 8.11.3. Yubico Sales, Revenue, and Gross Margin
      4. 8.11.4. Yubico Revenue and Growth Rate
      5. 8.11.5. Yubico Market Share
      6. 8.11.6. Recent Initiatives, Funding/VC Activities, and Technological Innovations
    12. 8.12. Gemalto NV
      1. 8.12.1. Company Overview
      2. 8.12.2. Product/Service Portfolio
      3. 8.12.3. Gemalto NV Sales, Revenue, and Gross Margin
      4. 8.12.4. Gemalto NV Revenue and Growth Rate
      5. 8.12.5. Gemalto NV Market Share
      6. 8.12.6. Recent Initiatives, Funding/VC Activities, and Technological Innovations
    13. 8.13. Thales e-Security
      1. 8.13.1. Company Overview
      2. 8.13.2. Product/Service Portfolio
      3. 8.13.3. Thales e-Security Sales, Revenue, and Gross Margin
      4. 8.13.4. Thales e-Security Revenue and Growth Rate
      5. 8.13.5. Thales e-Security Market Share
      6. 8.13.6. Recent Initiatives, Funding/VC Activities, and Technological Innovations
    14. 8.14. Ultra Electronics
      1. 8.14.1. Company Overview
      2. 8.14.2. Product/Service Portfolio
      3. 8.14.3. Ultra Electronics Sales, Revenue, and Gross Margin
      4. 8.14.4. Ultra Electronics Revenue and Growth Rate
      5. 8.14.5. Ultra Electronics Market Share
      6. 8.14.6. Recent Initiatives, Funding/VC Activities, and Technological Innovations
    15. 8.15. Enthrust Co.
      1. 8.15.1. Company Overview
      2. 8.15.2. Product/Service Portfolio
      3. 8.15.3. Enthrust Co. Sales, Revenue, and Gross Margin
      4. 8.15.4. Enthrust Co. Revenue and Growth Rate
      5. 8.15.5. Enthrust Co. Market Share
      6. 8.15.6. Recent Initiatives, Funding/VC Activities, and Technological Innovations
    16. 8.16. Rambus.com
      1. 8.16.1. Company Overview
      2. 8.16.2. Product/Service Portfolio
      3. 8.16.3. Rambus.com Sales, Revenue, and Gross Margin
      4. 8.16.4. Rambus.com Revenue and Growth Rate
      5. 8.16.5. Rambus.com Market Share
      6. 8.16.6. Recent Initiatives, Funding/VC Activities, and Technological Innovations
    17. 8.17. Cardcontact Systems
      1. 8.17.1. Company Overview
      2. 8.17.2. Product/Service Portfolio
      3. 8.17.3. Cardcontact Systems Sales, Revenue, and Gross Margin
      4. 8.17.4. Cardcontact Systems Revenue and Growth Rate
      5. 8.17.5. Cardcontact Systems Market Share
      6. 8.17.6. Recent Initiatives, Funding/VC Activities, and Technological Innovations
    18. 8.18. JN UNION
      1. 8.18.1. Company Overview
      2. 8.18.2. Product/Service Portfolio
      3. 8.18.3. JN UNION Sales, Revenue, and Gross Margin
      4. 8.18.4. JN UNION Revenue and Growth Rate
      5. 8.18.5. JN UNION Market Share
      6. 8.18.6. Recent Initiatives, Funding/VC Activities, and Technological Innovations
    19. 8.19. JN TASS
      1. 8.19.1. Company Overview
      2. 8.19.2. Product/Service Portfolio
      3. 8.19.3. JN TASS Sales, Revenue, and Gross Margin
      4. 8.19.4. JN TASS Revenue and Growth Rate
      5. 8.19.5. JN TASS Market Share
      6. 8.19.6. Recent Initiatives, Funding/VC Activities, and Technological Innovations
    20. 8.20. Beijing Sansec Technology
      1. 8.20.1. Company Overview
      2. 8.20.2. Product/Service Portfolio
      3. 8.20.3. Beijing Sansec Technology Sales, Revenue, and Gross Margin
      4. 8.20.4. Beijing Sansec Technology Revenue and Growth Rate
      5. 8.20.5. Beijing Sansec Technology Market Share
      6. 8.20.6. Recent Initiatives, Funding/VC Activities, and Technological Innovations
    21. 8.21. Micro Focus
      1. 8.21.1. Company Overview
      2. 8.21.2. Product/Service Portfolio
      3. 8.21.3. Micro Focus Sales, Revenue, and Gross Margin
      4. 8.21.4. Micro Focus Revenue and Growth Rate
      5. 8.21.5. Micro Focus Market Share
      6. 8.21.6. Recent Initiatives, Funding/VC Activities, and Technological Innovations
  9. Chapter 9 Hardware Security Modules— Industry Analysis
    1. 9.1. Introduction and Taxonomy
    2. 9.2. Hardware Security ModulesMarket – Key Trends
      1. 9.2.1. Market Drivers
      2. 9.2.2. Market Restraints
      3. 9.2.3. Market Opportunities
    3. 9.3. Porter’s Five Forces Model
      1. 9.3.1. Bargaining Power of Buyers
      2. 9.3.2. Bargaining Power of Suppliers
      3. 9.3.3. Threat of Substitute
      4. 9.3.4. Threat of New Entrants
      5. 9.3.5. Rivalry among Existing Competitors
    4. 9.4. PESTEL Analysis
    5. 9.5. Key Mandates and Regulations
    6. 9.6. Technology Roadmap and Timeline
    7. 9.7. Hardware Security ModulesMarket – Attractiveness Analysis
      1. 9.7.1. By Deployment Type
      2. 9.7.2. By Type
      3. 9.7.3. By Application
      4. 9.7.4. By End-Users
      5. 9.7.5. By Region
  10. Chapter 10 Report Conclusion & Key Insights
    1. 10.1. Key Insights from Primary Interviews & Surveys Respondents
    2. 10.2. Key Takeaways from Analysts, Consultants, and Industry Leaders
  11. Chapter 11 Research Approach & Methodology
    1. 11.1. Report Description
    2. 11.2. Research Scope
    3. 11.3. Research Methodology
      1. 11.3.1. Secondary Research
      2. 11.3.2. Primary Research
      3. 11.3.3. Statistical Models
        1. 11.3.3.1. Company Share Analysis Model
        2. 11.3.3.2. Revenue Based Modeling
      4. 11.3.4. Research Limitations

      List of Figures

      Fig.1 Product Picture ofHardware Security Modules
      Fig.2 GlobalHardware Security ModulesMarket, 2016 – 2026 (USD Billion)
      Fig.3 GlobalHardware Security ModulesMarket Absolute Revenue Opportunity, 2016 – 2026 (USD Billion)
      Fig.4 GlobalHardware Security ModulesMarket Incremental Revenue Opportunity, 2020 – 2026 (USD Billion)
      Fig.5 COVID-19 Impacts on Hardware Security Modules
      Fig.6 COVID-19 Impact on the Players
      Fig.7 Business Strategies and Recommendations
      Fig.8 GlobalHardware Security ModulesMarket Share, by Deployment Type, 2020 & 2026 (USD Billion)
      Fig.9 Global On-premisesHardware Security ModulesMarket, 2016 – 2026 (USD Billion)
      Fig.10 Global Cloud BasedHardware Security ModulesMarket, 2016 – 2026 (USD Billion)
      Fig.11 GlobalHardware Security ModulesMarket Share, by Type, 2020 & 2026 (USD Billion)
      Fig.12 Global LAN Based/Network AttachedHardware Security ModulesMarket, 2016 – 2026 (USD Billion)
      Fig.13 Global PCI BasedHardware Security ModulesMarket, 2016 – 2026 (USD Billion)
      Fig.14 Global USB BasedHardware Security ModulesMarket, 2016 – 2026 (USD Billion)
      Fig.15 Global Smart CardsHardware Security ModulesMarket, 2016 – 2026 (USD Billion)
      Fig.16 GlobalHardware Security ModulesMarket Share, by Application, 2020 & 2026 (USD Billion)
      Fig.17 Global Payment ProcessingHardware Security ModulesMarket, 2016 – 2026 (USD Billion)
      Fig.18 Global Code & Document SigningHardware Security ModulesMarket, 2016 – 2026 (USD Billion)
      Fig.19 Global Secure Sockets LayersHardware Security ModulesMarket, 2016 – 2026 (USD Billion)
      Fig.20 Global Transport Layer SecurityHardware Security ModulesMarket, 2016 – 2026 (USD Billion)
      Fig.21 Global AuthenticationHardware Security ModulesMarket, 2016 – 2026 (USD Billion)
      Fig.22 Global Database EncryptionHardware Security ModulesMarket, 2016 – 2026 (USD Billion)
      Fig.23 Global Credential ManagementHardware Security ModulesMarket, 2016 – 2026 (USD Billion)
      Fig.24 Global Application-Level EncryptionHardware Security ModulesMarket, 2016 – 2026 (USD Billion)
      Fig.25 GlobalHardware Security ModulesMarket Share, by End-Users, 2020 & 2026 (USD Billion)
      Fig.26 Global BFSIHardware Security ModulesMarket, 2016 – 2026 (USD Billion)
      Fig.27 Global HealthcareHardware Security ModulesMarket, 2016 – 2026 (USD Billion)
      Fig.28 Global Telecommunications & ITHardware Security ModulesMarket, 2016 – 2026 (USD Billion)
      Fig.29 Global Energy & UtilitiesHardware Security ModulesMarket, 2016 – 2026 (USD Billion)
      Fig.30 Global TransportationHardware Security ModulesMarket, 2016 – 2026 (USD Billion)
      Fig.31 Global EducationHardware Security ModulesMarket, 2016 – 2026 (USD Billion)
      Fig.32 Global Entertainment & MediaHardware Security ModulesMarket, 2016 – 2026 (USD Billion)
      Fig.33 Global ManufacturingHardware Security ModulesMarket, 2016 – 2026 (USD Billion)
      Fig.34 Global OthersHardware Security ModulesMarket, 2016 – 2026 (USD Billion)
      Fig.35 GlobalHardware Security ModulesMarket Share, by Region, 2020 & 2026 (USD Billion)
      Fig.36 North AmericaHardware Security ModulesMarket, 2016 – 2026 (USD Billion)
      Fig.37 U.S.Hardware Security ModulesMarket, 2016 – 2026 (USD Billion)
      Fig.38 CanadaHardware Security ModulesMarket, 2016 – 2026 (USD Billion)
      Fig.39 EuropeHardware Security ModulesMarket, 2016 – 2026 (USD Billion)
      Fig.40 GermanyHardware Security ModulesMarket, 2016 – 2026 (USD Billion)
      Fig.41 FranceHardware Security ModulesMarket, 2016 – 2026 (USD Billion)
      Fig.42 U.K.Hardware Security ModulesMarket, 2016 – 2026 (USD Billion)
      Fig.43 ItalyHardware Security ModulesMarket, 2016 – 2026 (USD Billion)
      Fig.44 SpainHardware Security ModulesMarket, 2016 – 2026 (USD Billion)
      Fig.45 Rest of EuropeHardware Security ModulesMarket, 2016 – 2026 (USD Billion)
      Fig.46 Asia PacificHardware Security ModulesMarket, 2016 – 2026 (USD Billion)
      Fig.47 ChinaHardware Security ModulesMarket, 2016 – 2026 (USD Billion)
      Fig.48 JapanHardware Security ModulesMarket, 2016 – 2026 (USD Billion)
      Fig.49 IndiaHardware Security ModulesMarket, 2016 – 2026 (USD Billion)
      Fig.50 SouthKoreaHardware Security ModulesMarket, 2016 – 2026 (USD Billion)
      Fig.51 South-East AsiaHardware Security ModulesMarket, 2016 – 2026 (USD Billion)
      Fig.52 Rest of Asia PacificHardware Security ModulesMarket, 2016 – 2026 (USD Billion)
      Fig.53 Latin AmericaHardware Security ModulesMarket, 2016 – 2026 (USD Billion)
      Fig.54 BrazilHardware Security ModulesMarket, 2016 – 2026 (USD Billion)
      Fig.55 MexicoHardware Security ModulesMarket, 2016 – 2026 (USD Billion)
      Fig.56 Rest of Latin AmericaHardware Security ModulesMarket, 2016 – 2026 (USD Billion)
      Fig.57 The Middle-East and AfricaHardware Security ModulesMarket, 2016 – 2026 (USD Billion)
      Fig.58 GCC CountriesHardware Security ModulesMarket, 2016 – 2026 (USD Billion)
      Fig.59 South AfricaHardware Security ModulesMarket, 2016 – 2026 (USD Billion)
      Fig.60 Rest of Middle-East AfricaHardware Security ModulesMarket, 2016 – 2026 (USD Billion)
      Fig.61 Competitor Market Share – Revenue
      Fig.62 Hewlett Packard Enterprise Development LP Revenue and Growth Rate
      Fig.63 Hewlett Packard Enterprise Development LP Market Share
      Fig.64 Utimaco Revenue and Growth Rate
      Fig.65 Utimaco Market Share
      Fig.66 International Business Machines Corporation Revenue and Growth Rate
      Fig.67 International Business Machines Corporation Market Share
      Fig.68 Microchip Technology Revenue and Growth Rate
      Fig.69 Microchip Technology Market Share
      Fig.70 Infineon Technologies Revenue and Growth Rate
      Fig.71 Infineon Technologies Market Share
      Fig.72 Securosys Revenue and Growth Rate
      Fig.73 Securosys Market Share
      Fig.74 Spyrus Revenue and Growth Rate
      Fig.75 Spyrus Market Share
      Fig.76 Futurex Revenue and Growth Rate
      Fig.77 Futurex Market Share
      Fig.78 SWIFT Revenue and Growth Rate
      Fig.79 SWIFT Market Share
      Fig.80 Atos SE Revenue and Growth Rate
      Fig.81 Atos SE Market Share
      Fig.82 Yubico Revenue and Growth Rate
      Fig.83 Yubico Market Share
      Fig.84 Gemalto NV Revenue and Growth Rate
      Fig.85 Gemalto NV Market Share
      Fig.86 Thales e-Security Revenue and Growth Rate
      Fig.87 Thales e-Security Market Share
      Fig.88 Ultra Electronics Revenue and Growth Rate
      Fig.89 Ultra Electronics Market Share
      Fig.90 Enthrust Co. Revenue and Growth Rate
      Fig.91 Enthrust Co. Market Share
      Fig.92 Rambus.com Revenue and Growth Rate
      Fig.93 Rambus.com Market Share
      Fig.94 Cardcontact Systems Revenue and Growth Rate
      Fig.95 Cardcontact Systems Market Share
      Fig.96 JN UNION Revenue and Growth Rate
      Fig.97 JN UNION Market Share
      Fig.98 JN TASS Revenue and Growth Rate
      Fig.99 JN TASS Market Share
      Fig.100 Beijing Sansec Technology Revenue and Growth Rate
      Fig.101 Beijing Sansec Technology Market Share
      Fig.102 Micro Focus Revenue and Growth Rate
      Fig.103 Micro Focus Market Share
      Fig.104 Market Dynamics
      Fig.105 PESTEL Analysis
      Fig.106 Key Mandates and Regulations
      Fig.107 Technology Roadmap and Timeline
      Fig.108 Market Attractiveness Analysis – By Deployment Type
      Fig.109 Market Attractiveness Analysis – By Type
      Fig.110 Market Attractiveness Analysis – By Application
      Fig.111 Market Attractiveness Analysis – By End-Users
      Fig.112 Market Attractiveness Analysis – By Region
      

      List of Tables

      Table 1 GlobalHardware Security ModulesMarket, 2020 & 2026 (USD Billion)
      Table 2 GlobalHardware Security ModulesMarket, by Deployment Type, 2016 – 2026 (USD Billion)
      Table 3 GlobalHardware Security ModulesMarket, by Type, 2016 – 2026 (USD Billion)
      Table 4 GlobalHardware Security ModulesMarket, by Application, 2016 – 2026 (USD Billion)
      Table 5 GlobalHardware Security ModulesMarket, by End-Users, 2016 – 2026 (USD Billion)
      Table 6 GlobalHardware Security ModulesMarket, by Region, 2016 – 2026 (USD Billion)
      Table 7 North AmericaHardware Security ModulesMarket, by Country, 2016 – 2026 (USD Billion)
      Table 8 North AmericaHardware Security ModulesMarket, by Deployment Type, 2016 – 2026 (USD Billion)
      Table 9 North AmericaHardware Security ModulesMarket, by Type, 2016 – 2026 (USD Billion)
      Table 10 North AmericaHardware Security ModulesMarket, by Application, 2016 – 2026 (USD Billion)
      Table 11 North AmericaHardware Security ModulesMarket, by End-Users, 2016 – 2026 (USD Billion)
      Table 12 EuropeHardware Security ModulesMarket, by Country, 2016 – 2026 (USD Billion)
      Table 13 EuropeHardware Security ModulesMarket, by Deployment Type, 2016 – 2026 (USD Billion)
      Table 14 EuropeHardware Security ModulesMarket, by Type, 2016 – 2026 (USD Billion)
      Table 15 EuropeHardware Security ModulesMarket, by Application, 2016 – 2026 (USD Billion)
      Table 16 EuropeHardware Security ModulesMarket, by End-Users, 2016 – 2026 (USD Billion)
      Table 17 Asia PacificHardware Security ModulesMarket, by Country, 2016 – 2026 (USD Billion)
      Table 18 Asia PacificHardware Security ModulesMarket, by Deployment Type, 2016 – 2026 (USD Billion)
      Table 19 Asia PacificHardware Security ModulesMarket, by Type, 2016 – 2026 (USD Billion)
      Table 20 Asia PacificHardware Security ModulesMarket, by Application, 2016 – 2026 (USD Billion)
      Table 21 Asia PacificHardware Security ModulesMarket, by End-Users, 2016 – 2026 (USD Billion)
      Table 22 Latin AmericaHardware Security ModulesMarket, by Country, 2016 – 2026 (USD Billion)
      Table 23 Latin AmericaHardware Security ModulesMarket, by Deployment Type, 2016 – 2026 (USD Billion)
      Table 24 Latin AmericaHardware Security ModulesMarket, by Type, 2016 – 2026 (USD Billion)
      Table 25 Latin AmericaHardware Security ModulesMarket, by Application, 2016 – 2026 (USD Billion)
      Table 26 Latin AmericaHardware Security ModulesMarket, by End-Users, 2016 – 2026 (USD Billion)
      Table 27 The Middle-East and AfricaHardware Security ModulesMarket, by Country, 2016 – 2026 (USD Billion)
      Table 28 The Middle-East and AfricaHardware Security ModulesMarket, by Deployment Type, 2016 – 2026 (USD Billion)
      Table 29 The Middle-East and AfricaHardware Security ModulesMarket, by Type, 2016 – 2026 (USD Billion)
      Table 30 The Middle-East and AfricaHardware Security ModulesMarket, by Application, 2016 – 2026 (USD Billion)
      Table 31 The Middle-East and AfricaHardware Security ModulesMarket, by End-Users, 2016 – 2026 (USD Billion)
      Table 32 GlobalHardware Security ModulesMarket - Company Revenue Analysis, 2016 – 2020 (USD Billion)
      Table 33 GlobalHardware Security ModulesMarket - Company Revenue Share Analysis, 2016 – 2020 (%)
      Table 34 Acquisitions and Mergers
      Table 35 Market Drivers – Impact Analysis
      Table 36 Market Restraints
      Table 37 Market Opportunities
      

Industry Major Market Players

  • Hewlett Packard Enterprise Development LP
  • Utimaco
  • International Business Machines Corporation
  • Microchip Technology
  • Infineon Technologies
  • Securosys
  • Spyrus
  • Futurex,
  • SWIFT
  • Atos SE
  • Yubico
  • Gemalto NV
  • Thales e-Security
  • Ultra Electronics
  • Enthrust Co.
  • Rambus.com
  • Cardcontact Systems
  • JN UNION
  • JN TASS
  • Beijing Sansec Technology
  • Micro Focus