![]()
Search Market Research Report
Pea Protein Market Size, Share Global Analysis Report, 2024 – 2032

Pea Protein Market Size, Share, Growth Analysis Report By Type (Textured, Concentrates, Isolates, and Hydrolysates), By Form (Dry and Liquid), By Source (Yellow Split Peas, and Others), By Application (Food & Beverages, Animal Feed, Personal Care & Cosmetics, and Others), and By Region - Global and Regional Industry Insights, Overview, Comprehensive Analysis, Trends, Statistical Research, Market Intelligence, Historical Data and Forecast 2024 – 2032
Industry Insights
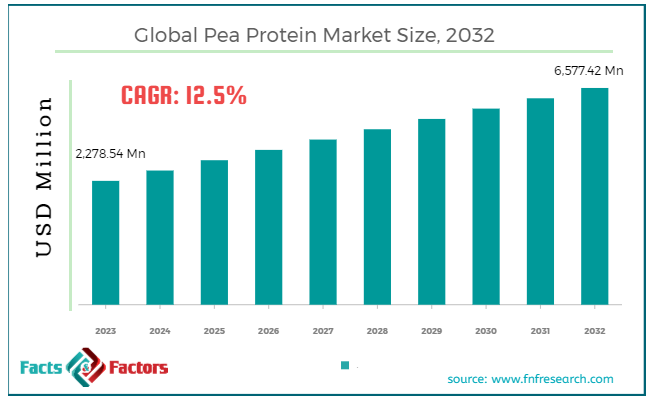
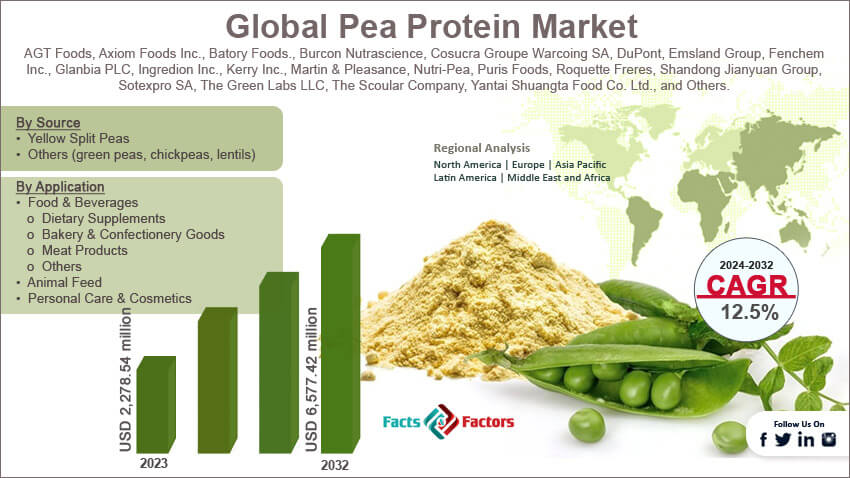
[223+ Pages Report] According to Facts & Factors, the global pea protein market size in terms of revenue was valued at around USD 2,278.54 million in 2023 and is expected to reach a value of USD 6,577.42 million by 2032, growing at a CAGR of roughly 12.5% from 2024 to 2032. The global pea protein market is projected to grow at a significant growth rate due to several driving factors.
 Market Overview
Pea protein is a high-quality protein extracted from peas, specifically yellow and green split peas (Pisum sativum), and is a popular choice among plant-based protein supplements due to its rich amino acid profile and gluten-free, dairy-free, and hypoallergenic properties. It's commonly used in a variety of food products such as meat substitutes, protein bars, and dietary supplements, offering a sustainable and allergen-free alternative to common animal and soy-based proteins.
The market for pea protein is experiencing robust growth, driven by the rising consumer interest in plant-based diets and sustainable food sources. As more people adopt vegetarian and vegan lifestyles, the demand for plant-based proteins has surged, positioning pea protein as a preferred ingredient due to its nutritional benefits and minimal environmental impact. This growth is further supported by the increasing awareness of dietary health and environmental sustainability among consumers globally. The versatility of pea protein also makes it an appealing choice for food manufacturers looking to expand their product offerings in the plant-based food market.
Industrially, pea protein's market expansion is accelerated by innovations in extraction and processing techniques that enhance its texture and flavor, making it more palatable for a broader range of consumers. Additionally, as the global protein supply chain faces pressures from economic and environmental factors, pea protein stands out as a cost-effective and sustainable protein source, reinforcing its position in the market and pointing towards continued growth in the coming years.
Key Highlights
- The pea protein market has registered a CAGR of 12.5% during the forecast period.
- In terms of revenue, the global pea protein market was estimated at roughly USD 2,278.54 million in 2023 and is predicted to attain a value of USD 6,577.42 million by 2032.
- The growth of the pea protein market is being propelled by soaring demand for plant-based diets, health benefits, and pea protein's ability to mimic meat and dairy textures.
- On the basis of type, the pea protein isolates segment is expected to dominate the global market.
- Based on the source, the yellow split peas segment is projected to swipe the largest market share.
- Based on the Form, the dry pea protein holds a larger market share due to its widespread use and versatility.
- By region, the North American region is expected to dominate the global market owing to the robust food and beverage industry, significant consumer demand for plant-based goods, and sufficient yellow split pea supply.
Pea Protein Market Dynamics: A Sprout of Sustainability
The pea protein market is flourishing, driven by several key factors. But like any growing plant, it faces challenges and opportunities that will shape its future. Let's explore these dynamics:
Growth Drivers:
- Increasing Demand for Plant-Based Diets: The increasing popularity of vegan and vegetarian lifestyles is a major driver. Pea protein offers a complete, healthy alternative to animal protein, attracting health-conscious consumers.
- Health Benefits: Pea protein boasts a nutritional punch. It's rich in iron, easily digestible, and a good source of BCAAs, all contributing to its appeal for health-focused consumers and athletes.
- Functional Properties: Pea protein's ability to mimic the textural properties of meat and dairy in plant-based products makes it invaluable for food manufacturers. This versatility fuels its use in meat alternatives, dairy substitutes, and protein bars.
- Sustainability Concerns: Pea protein production is environmentally friendly. Compared to animal protein, it requires less land and water, resonating with eco-conscious consumers.
Restraints:
- Cost Competitiveness: Currently, pea protein can be more expensive than some animal protein sources. As production scales up, costs are expected to decrease, but affordability remains a hurdle for some consumers.
- Flavor and Texture Limitations: While pea protein technology is evolving, achieving the taste and texture parity with animal-based products can be a challenge. Manufacturers are constantly innovating to create more appealing plant-based options.
- Competition from Other Plant Proteins: Pea protein faces intense competition from other sources of plant proteins, such as soy, which has a more established market presence and broader acceptance in various culinary applications.
Opportunities:
- Product Innovation and Diversification: There is significant opportunity for growth through innovation in processing technologies that can improve the sensory attributes of pea protein. Expanding the application of pea protein into new product categories like beverages and specialized nutritional products also presents a substantial market opportunity.
- Increasing Vegan and Allergen-Free Product Demand: As more consumers seek vegan and allergen-free products due to health or ethical reasons, pea protein's importance is expected to rise, given its compatibility with these dietary requirements.
- Expanding Applications: Exploring new applications for pea protein beyond traditional food products, like in nutraceuticals or sports nutrition, can create exciting avenues for market expansion.
Challenges:
- Scaling Production: As demand grows, scaling production while maintaining sustainable practices and product quality is a challenge. This includes ensuring a consistent and reliable supply chain that can support market growth without compromising environmental values.
- Nutritional Misconceptions and Consumer Education: There is still a need to educate consumers about the nutritional benefits of pea protein compared to other protein sources. Overcoming misconceptions about plant-based proteins’ efficacy can be challenging but is essential for market expansion.
Pea Protein Market: Segmentation Analysis
The global pea protein market is segmented based on type, form, source, application, and region.
By Type Insights
Based on Type, the global pea protein market is divided into textured, concentrates, isolates, and hydrolysates. Textured pea protein is primarily used as a meat substitute due to its fibrous texture that mimics the mouthfeel of meat. It is produced through extrusion cooking, which alters the protein structure to create a chewy texture. The demand for textured pea protein is largely driven by the growing vegan and vegetarian population seeking plant-based meat alternatives. It is popular in vegan sausages, burgers, and other meat-like products.
Pea protein concentrates segment contains about 70 to 85% protein and retains more of the fiber and starch from the original pea than isolates. They are used to increase the protein content in food products without altering their texture significantly. Concentrates are favored in the bakery and snack industries for their ability to enhance protein content while maintaining desirable textures in foods. They are also used in nutritional supplements and pet foods. The market for pea protein concentrates is expected to grow at a CAGR of about 12.3% from 2024 to 2032.
Pea protein isolates are the purest form of pea protein available, typically containing 90 to 95% protein. This segment held a market share of around 50.1% in 2023 and dominated the market. They are highly refined to remove most of the non-protein elements, resulting in a powder that is highly digestible and low in allergens. Isolates are particularly popular in the dietary supplement and sports nutrition sectors due to their high protein content and minimal flavor impact. They are also used in beverages and specialized health food products. The segment for pea protein isolates is projected to grow at a CAGR of approximately 14.18%.
Hydrolysates are pre-digested forms of pea protein that are easier for the body to absorb. They are commonly used in specialized dietary products, infant formulas, and medical nutritional supplements. The demand for hydrolysates is driven by their use in hypoallergenic formulas and products aimed at consumers with specific digestive or absorption issues. Though currently a smaller segment, pea protein hydrolysates are expected to exhibit significant growth.
By Form Insights
On the basis of Form, the global pea protein market is bifurcated into dry and liquid. Dry pea protein typically comes in powder form and is the most common form of pea protein available on the market. This segment dominated the market and accounted for 68.2% of the total revenue share in 2023. It is widely used due to its ease of storage, long shelf life, and versatility in various applications. Dry pea protein is popular in powdered supplements, baking mixes, meat substitutes, and many other food products. Its stability and ease of integration into dry mixes make it a preferred choice for food manufacturers and consumers looking for plant-based protein options. It's especially favored in the health and wellness sector for protein powders, bars, and meal replacements.
Liquid pea protein is less common but gaining traction in the beverage industry and other applications where dry powder might not be suitable. It is used in ready-to-drink beverages, plant-based milk, and other liquid products. The use of liquid pea protein is expanding as manufacturers explore new ways to incorporate plant-based proteins into beverages, soups, and sauces. The liquid form is valued for its ability to blend seamlessly into formulations, providing a smooth texture without the grittiness sometimes associated with powders. Although starting from a smaller base, the liquid pea protein segment is expected to grow rapidly, with a projected CAGR of approximately 13.4% from 2024-2032.
By Source Insights
Based on Source, the global pea protein market is categorized into yellow split peas and others. In 2023, yellow split peas led the market, accounting for 78.4% of revenue. Yellow split peas are the most commonly used source for pea protein production. The protein derived from yellow split peas is favored due to its mild flavor, light color, and excellent solubility, making it highly suitable for a wide range of applications including dietary supplements, meat alternatives, and baked goods. The dominance of yellow split peas in the pea protein market is driven by their high protein content and favorable amino acid profile.
Additionally, the processing technology for extracting protein from yellow split peas is well-established, which enhances production efficiency and product quality. The market segment for pea protein derived from yellow split peas is expected to maintain a strong growth trajectory.
Other categories include additional varieties of peas, such as green peas, chickpeas, lentils, and specialty breeds that are occasionally used to produce pea protein. The projected CAGR for this segment is around 11.5% between 2024 to 2032. These sources might offer different flavors or nutritional profiles and are sometimes chosen to diversify product offerings or target specific consumer preferences.
Although less common than yellow split peas, these alternative sources are gaining attention as companies seek to innovate and differentiate their products in a competitive market. They may appeal to consumers looking for variety or those with specific dietary needs that might be better served by different types of pea proteins. The growth rate for pea protein sourced from other types of peas is currently lower than that for yellow split peas but is expected to grow steadily.
By Application Insights
In terms of Application, the global pea protein market is bifurcated into food & beverages, animal feed, personal care & cosmetics, and others. Food & Beverages segment is the largest and most dynamic in the pea protein market. This segment dominated the global market and captured a market share of around 41.6% in 2023. Pea protein is used in a variety of food products such as meat alternatives, protein bars, bakery goods, dairy substitutes, and beverages. It caters to the rising consumer demand for plant-based, high-protein, and gluten-free options. The growth of this segment is driven by health and wellness trends, environmental sustainability concerns, and the increasing prevalence of dietary restrictions like lactose intolerance and celiac disease, this segment has seen significant growth. Innovations in taste and texture enhancement have also helped improve the palatability of pea protein-based products.
Pea protein is used in animal feed to enhance the protein content of feed products, especially for livestock, aquaculture, poultry, and pet foods. It serves as a sustainable and hypoallergenic alternative to common feed ingredients like animal-based or soy proteins. The shift towards sustainable and premium animal feed products that reduce the environmental impact of traditional feed ingredients drives the demand in this segment. Pea protein's nutritional benefits, including its amino acid profile, make it a valuable component of animal nutrition.
Pea protein finds applications in personal care and cosmetics, particularly in hair care and skincare products, due to its moisturizing and film-forming properties that can enhance skin and hair health. The personal care segment is influenced by consumer preferences for natural and plant-derived ingredients in cosmetics, driven by growing awareness of the potential adverse effects of synthetic additives. While relatively smaller than the food and beverages segment, the growth rate in personal care and cosmetics segment is notable, with an expected CAGR of about 13.7% from 2024 to 2032. This growth is fueled by the clean beauty trend, which emphasizes safe, sustainable, and effective ingredients.
Other applications include nutraceuticals, sports nutrition, and pharmaceuticals, where pea protein’s nutritional benefits are leveraged to support overall health and wellness. This segment benefits from the increasing consumer focus on fitness and preventive healthcare, with pea protein being utilized for its excellent amino acid profile and digestibility.
Recent Developments:
- In June 2023, Cosucra announced a significant funding boost, securing a 45 million Euros investment from Wallonie Entreprendre, Sofiprotéol, and the SFPIM (Société Fédérale de Participations et d’Investissement). This financial infusion is earmarked to support the company's strategy for energy transition and to notably enhance its production capabilities.
- In May 2023, Burcon NutraScience expanded its protein development and innovation operations. The company now offers services like pilot plant processing and scale-up validation to its partners, utilizing a 10,000 sq. ft technical center in Winnipeg. This facility is equipped with sophisticated commercial processing equipment, designed to streamline complete product development.
- In March 2023, Nepra Foods entered into a strategic manufacturing and distribution partnership with Scoular to create specialized plant-based products. Nepra will utilize its R&D capabilities to forge new products incorporating specialty ingredients from both firms, while Scoular will use its extensive supply chain network to enhance the distribution of Nepra's innovations.
- In January 2023, Roquette Frères S.A invested in DAIZ, a cutting-edge Japanese food tech startup. This collaboration is set to cater to the increasing global demand for innovative, sustainable plant-based ingredients that do not compromise on taste or nutritional quality.
Report Scope
Report Attribute |
Details |
Market Size in 2023 |
USD 2,278.54 Million |
Projected Market Size in 2032 |
USD 6,577.42 Million |
CAGR Growth Rate |
12.5% CAGR |
Base Year |
2023 |
Forecast Years |
2024-2032 |
Key Market Players |
AGT Foods, Axiom Foods Inc., Batory Foods., Burcon Nutrascience, Cosucra Groupe Warcoing SA, DuPont, Emsland Group, Fenchem Inc., Glanbia PLC, Ingredion Inc., Kerry Inc., Martin & Pleasance, Nutri-Pea, Puris Foods, Roquette Freres, Shandong Jianyuan Group, Sotexpro SA, The Green Labs LLC, The Scoular Company, Yantai Shuangta Food Co. Ltd., and Others. |
Key Segment |
By Type, By Form, By Source, By Application, and By Region |
Major Regions Covered |
North America, Europe, Asia Pacific, Latin America, and the Middle East &, Africa |
Purchase Options |
Request customized purchase options to meet your research needs. Explore purchase options |
Pea Protein Market: Regional Analysis
- North America is poised to dominate the market
North America, led by the United States and Canada, is a mature market for pea protein, characterized by well-established health and wellness trends. The North American region dominated the pea protein market with a revenue share of 33.8% in 2023. The increasing popularity of vegan and vegetarian diets, along with rising consumer interest in sustainable food sources, drives demand for pea protein in this region. The region benefits from advanced food processing technologies and significant investment from major food and beverage companies. North American consumers are highly receptive to innovations in plant-based foods, which fuels the development and adoption of pea protein-enriched products. This growth is supported by continuous product innovations and expanding distribution channels that make plant-based options more accessible to consumers.
Europe's market is driven by a strong regulatory framework supporting sustainable agriculture and food safety, alongside a growing consumer base seeking plant-based dietary options. Countries like Germany, the UK, and France show particularly high demand. The European market is influenced by stringent EU regulations on food ingredients and a cultural shift towards environmental consciousness, which promotes the adoption of sustainable proteins like pea protein. Europe's CAGR is projected to be around 14.6%, one of the highest globally. This is fueled by proactive government policies, the presence of numerous startups focusing on plant-based foods, and increasing consumer awareness of health and sustainability issues. UK is registering growth at a CAGR of 13.2% between 2024 to 2032 due to growing accessibility and increased need for plant-based substitutes.
Asia-Pacific region is rapidly emerging as a significant market for pea protein due to changing dietary habits, economic growth, and an expanding middle class, particularly in China and India. China pea protein market dominated Asia Pacific in 2023 with 26.8% revenue share. Increasing urbanization and the westernization of diets contribute to the growing acceptance of plant-based proteins. The region's vast population and rising health consciousness create a large market for sustainable dietary supplements. With a projected CAGR of 15.7% from 2024 to 2032, Asia-Pacific is expected to experience the fastest growth. This surge is driven by the scalability of health-oriented food products and the increasing influence of fitness and wellness trends among the young and expanding urban population.
Latin America and Middle East & Africa regions are developing markets for pea protein, with increasing interest in health and nutrition driving the adoption of new food technologies. In Latin America and the Middle East & Africa, the demand for plant-based products is influenced by improving economic conditions and the gradual shift in consumer preferences towards healthier, sustainable options. The CAGR for these regions, while starting from a smaller base, is expected to be significant, around 12-15%. Growth is stimulated by urbanization, rising disposable incomes, and the increasing prevalence of chronic diseases related to diet.
Pea Protein Market: List of Key Players
Some of the main competitors dominating the global pea protein market include;
- AGT Foods
- Axiom Foods, Inc.
- Batory Foods.
- Burcon Nutrascience
- Cosucra Groupe Warcoing SA
- DuPont
- Emsland Group
- Fenchem, Inc.
- Glanbia PLC
- Ingredion, Inc.
- Kerry Inc.
- Martin & Pleasance
- Nutri-Pea
- Puris Foods
- Roquette Freres
- Shandong Jianyuan Group
- Sotexpro SA
- The Green Labs LLC
- The Scoular Company
- Yantai Shuangta Food Co. Ltd.
The global pea protein market is segmented as follows:
By Type Segment Analysis
- Textured
- Concentrates
- Isolates
- Hydrolysates
By Form Segment Analysis
- Dry
- Liquid
By Source Segment Analysis
- Yellow Split Peas
- Others (green peas, chickpeas, lentils)
By Application Segment Analysis
- Food & Beverages
- Dietary Supplements
- Bakery & Confectionery Goods
- Meat Products
- Others
- Animal Feed
- Personal Care & Cosmetics
- Others
By Regional Segment Analysis
- North America
- The U.S.
- Canada
- Mexico
- Europe
- France
- The UK
- Spain
- Germany
- Italy
- Rest of Europe
- Asia Pacific
- China
- Japan
- India
- Australia
- Southeast Asia
- Rest of Asia Pacific
- The Middle East & Africa
- Saudi Arabia
- UAE
- Egypt
- Kuwait
- South Africa
- Rest of the Middle East & Africa
- Latin America
- Brazil
- Argentina
- Rest of Latin America
Table of Content
Industry Major Market Players
- AGT Foods
- Axiom Foods, Inc.
- Batory Foods.
- Burcon Nutrascience
- Cosucra Groupe Warcoing SA
- DuPont
- Emsland Group
- Fenchem, Inc.
- Glanbia PLC
- Ingredion, Inc.
- Kerry Inc.
- Martin & Pleasance
- Nutri-Pea
- Puris Foods
- Roquette Freres
- Shandong Jianyuan Group
- Sotexpro SA
- The Green Labs LLC
- The Scoular Company
- Yantai Shuangta Food Co. Ltd.


Copyright © 2025 - 2026, All Rights Reserved, Facts and Factors