Search Market Research Report

Discover Our Latest Reports
Discover Our Featured Reports
Discover Top Selling Reports

Nutraceutical Ingredients Market Size, Share Global Analysis Report, 2021 – 2026

report img

Nutraceutical Ingredients Market By Type (Probiotic, Proteins & Amino Acids, Fibers & Specialty Carbohydrates, Omega 3 Fatty Acids, Vitamins,Prebiotic, Carotenoids, Minerals, & Others), By Application (Food, Beverages, Personal Care, Animal Nutrition, & Others), By Form (Dry &Liquid), And By Regions - Global & Regional Industry Perspective, Comprehensive Analysis, and Forecast 2021 – 2026

Industry Insights

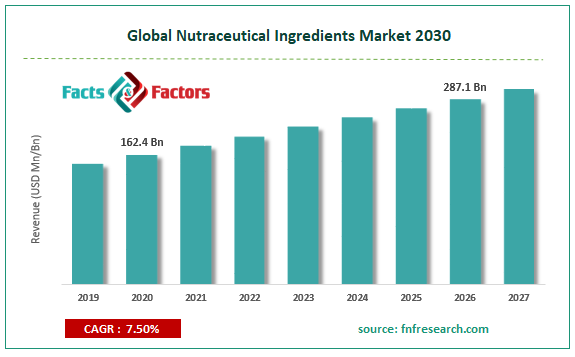
[206+ Pages Report] The latest finding surrounding the “Global Nutraceutical Ingredients Market” published by Facts & Factors offers a neatly packaged and comprehensive read. We at Facts & Factors estimate that the market surrounding nutraceutical ingredients will reach a projected value of USD 287.1 Billion by 2026 growing at a CAGR of 7.5% from an initial value of USD 162.4 Billion in the year 2020.

Global Nutraceutical Ingredients Market Size

To know more about this report | Request Free Sample Copy

logoMarket Overview

Nutraceutical ingredients are the collective family that is often referred to as the fortified food or food sources that are used as a supplementary form to our intake. These ingredients often have the added benefit of additional health advantages and are available in the form of medical foods, functional foods, and designer foods. Nutraceutical ingredients often contain vitamins and the latest generation of the latter further contains plant-based sterols, polyphenols, probiotics, and fatty acids.

logoIndustry Growth Factors

The global nutraceutical ingredients market is expected to reach a significant high in terms of its current consumer base owing to the rising demand for fortified foods coupled with increasing demand for health-conscious related populations to name a few. Additionally, the increasing prevalence of chronic diseases coupled with rising government-based regulatory measures is expected to increase the footprint of the global nutraceutical ingredients market during the forecast period. Moreover, the integration of primary nutritional values and added functional benefits is expected to increase the consumer base for the global nutraceutical ingredients market during the forecast period.

The global nutraceutical ingredients market is expected to be driven by factors such as the changing lifestyle of the targeted consumers coupled with the rising presence of non-communicable diseases to name a few. Factors pertaining to rising product formats in terms of sports drinks and energy bars are further expected to boost the growth of the global nutraceutical ingredients market during the forecast duration. However, the higher cost of fortified food products coupled with less large-scale usage due to low awareness among consumers is expected to hamper the global nutraceutical ingredients market during the forecast period.

logoSegmentation Analysis

The global nutraceutical ingredients market is segmented into type, application, form, and region.

logoOn the basis of type, the global nutraceutical ingredients market is divided into probiotics, proteins & amino acids, fibers &specialtycarbohydrates, omega 3 fatty acids, vitamins, prebiotic, carotenoids, minerals, and others. The segment pertaining to probiotics is expected to witness the largest market share during the advent of the forecast owing to rising positive effects on the overall human health coupled with the integration of the latter in functional food, functional beverage, dietary supplement, and animal nutritional based foods to name a few.

logoBased on application, the global nutraceutical ingredients market can be broken down into food, beverages, personal care, animal nutrition, and others. The segment pertaining to dietary supplements is expected to witness the largest market share during the advent of the forecast owing to rising dietary benefits such as balancing the gut microflora, improvement of intestinal functions, rising calcium absorption, and reduction of toxins from the human anatomy, to name a few.

logoOn the basis of form, the global nutraceutical ingredients market is fragmented into dry & liquid. The dry category is expected to occupy the largest market share during the advent of the forecast owing to the easy availability of the majority of nutraceutical ingredients in this form coupled with increased production means from the prominent market players to name a few.

logo Report Scope

Report Attribute

Details

Market Size in 2020

USD 162.4 Billion

Projected Market Size in 2026

USD 287.1 Billion

CAGR Growth Rate

CAGR of 7.5%

Base Year

2020

Forecast Years

2021-2026

Key Market Players

Associated British Foods, Arla Foods, DSM, Ingredion Incorporated, Tate & Lyle PLC, Ajinomoto Co, Inc., Cargill Incorporated, E.I. Du Pont De Nemours and Company, BASF SE, Archers Daniels Midland Company, and Kerry, Inc., among others

Key Segments

Types, Applications, Form, and Region

Major Regions Covered

North America, Europe, Asia Pacific, Latin America, and Middle East & Africa

Purchase Options

Request customized purchase options to meet your research needs. Explore purchase options

logo Regional Analysis

Asia-Pacific is expected to witness the largest market share during the advent of the forecast owing to the presence of high demand from budding economies such as India and China coupled with changing lifestyles of the consumer base to name a few. Additionally, the rising awareness among the consumers in terms of upscaling nutrition in their daily intake coupled with the rising hospitalization costs is expected to increase the footprint of the nutraceutical ingredients market during the forecast period. Increased consumers opting for an extremely health-conscious mindset coupled with rising spending measures opting for the same is expected to boost the growth of the nutraceutical ingredients market during the forecast period.

logo Competitive Players

The key market participants for the global nutraceutical ingredients market are:

  • Associated British Foods
  • Arla Foods
  • DSM
  • Ingredion Incorporated
  • Tate & Lyle PLC
  • Ajinomoto Co Inc.
  • Cargill Incorporated
  • E.I. Du Pont De Nemours and Company
  • BASF SE
  • Archers Daniels Midland Company
  • Kerry Inc.

logo By Type Segment Analysis

  • Probiotic
  • Proteins & Amino Acids
  • Fibers & Specialty Carbohydrates
  • Omega 3 Fatty Acids
  • Vitamins
  • Prebiotic
  • Carotenoids
  • Minerals
  • Others

logo By Application Segment Analysis

  • Food
  • Beverages
  • Personal Care
  • Animal Nutrition
  • Others

logo By Form Segment Analysis

  • Dry
  • Liquid


Table of Content

  1. Chapter 1 Executive Summary
    1. 1.1. Introduction of Nutraceutical Ingredients
    2. 1.2. Global Nutraceutical Ingredients Market, 2019 & 2026 (USD Billion)
    3. 1.3. Global Nutraceutical Ingredients Market, 2016 – 2026 (USD Billion)
    4. 1.4. Global Nutraceutical Ingredients Market Absolute Revenue Opportunity, 2016 – 2026 (USD Billion)
    5. 1.5. Global Nutraceutical Ingredients Market Incremental Revenue Opportunity, 2020 – 2026 (USD Billion)
  2. Chapter 2 Nutraceutical Ingredients Market – Type Analysis
    1. 2.1. Global Nutraceutical Ingredients Market – Type Overview
    2. 2.2. Global Nutraceutical Ingredients Market Share, by Type, 2019 & 2026 (USD Billion)
    3. 2.3. Probiotic
      1. 2.3.1. Global Probiotic Nutraceutical Ingredients Market, 2016 – 2026 (USD Billion)
    4. 2.4. Proteins & Amino Acids
      1. 2.4.1. Global Proteins & Amino Acids Nutraceutical Ingredients Market, 2016 – 2026 (USD Billion)
    5. 2.5. Fibers & Specialty Carbohydrates
      1. 2.5.1. Global Fibers & Specialty Carbohydrates Nutraceutical Ingredients Market, 2016 – 2026 (USD Billion)
    6. 2.6. Omega 3 Fatty Acids
      1. 2.6.1. Global Omega 3 Fatty Acids Nutraceutical Ingredients Market, 2016 – 2026 (USD Billion)
    7. 2.7. Vitamins
      1. 2.7.1. Global Vitamins Nutraceutical Ingredients Market, 2016 – 2026 (USD Billion)
    8. 2.8. Prebiotic
      1. 2.8.1. Global Prebiotic Nutraceutical Ingredients Market, 2016 – 2026 (USD Billion)
    9. 2.9. Carotenoids
      1. 2.9.1. Global Carotenoids Nutraceutical Ingredients Market, 2016 – 2026 (USD Billion)
    10. 2.10. Minerals
      1. 2.10.1. Global Minerals Nutraceutical Ingredients Market, 2016 – 2026 (USD Billion)
    11. 2.11. Others
      1. 2.11.1. Global Others Nutraceutical Ingredients Market, 2016 – 2026 (USD Billion)
  3. Chapter 3 Nutraceutical Ingredients Market – Application Analysis
    1. 3.1. Global Nutraceutical Ingredients Market – Application Overview
    2. 3.2. Global Nutraceutical Ingredients Market Share, by Application, 2019 & 2026 (USD Billion)
    3. 3.3. Food
      1. 3.3.1. Global Food Nutraceutical Ingredients Market, 2016 – 2026 (USD Billion)
    4. 3.4. Beverages
      1. 3.4.1. Global Beverages Nutraceutical Ingredients Market, 2016 – 2026 (USD Billion)
    5. 3.5. Personal Care
      1. 3.5.1. Global Personal Care Nutraceutical Ingredients Market, 2016 – 2026 (USD Billion)
    6. 3.6. Animal Nutrition
      1. 3.6.1. Global Animal Nutrition Nutraceutical Ingredients Market, 2016 – 2026 (USD Billion)
    7. 3.7. Others
      1. 3.7.1. Global Others Nutraceutical Ingredients Market, 2016 – 2026 (USD Billion)
  4. Chapter 4 Nutraceutical Ingredients Market – Form Analysis
    1. 4.1. Global Nutraceutical Ingredients Market – Form Overview
    2. 4.2. Global Nutraceutical Ingredients Market Share, by Form, 2019 & 2026 (USD Billion)
    3. 4.3. Dry
      1. 4.3.1. Global Dry Nutraceutical Ingredients Market, 2016 – 2026 (USD Billion)
    4. 4.4. Liquid
      1. 4.4.1. Global Liquid Nutraceutical Ingredients Market, 2016 – 2026 (USD Billion)
  5. Chapter 5 Nutraceutical Ingredients Market – Regional Analysis
    1. 5.1. Global Nutraceutical Ingredients Market Regional Overview
    2. 5.2. Global Nutraceutical Ingredients Market Share, by Region, 2019 & 2026 (USD Billion)
    3. 5.3. North America
      1. 5.3.1. North America Nutraceutical Ingredients Market, 2016 – 2026 (USD Billion)
        1. 5.3.1.1. North America Nutraceutical Ingredients Market, by Country, 2016 - 2026 (USD Billion)
      2. 5.3.2. North America Nutraceutical Ingredients Market, by Type, 2016 – 2026
        1. 5.3.2.1. North America Nutraceutical Ingredients Market, by Type, 2016 – 2026 (USD Billion)
      3. 5.3.3. North America Nutraceutical Ingredients Market, by Application, 2016 – 2026
        1. 5.3.3.1. North America Nutraceutical Ingredients Market, by Application, 2016 – 2026 (USD Billion)
      4. 5.3.4. North America Nutraceutical Ingredients Market, by Form, 2016 – 2026
        1. 5.3.4.1. North America Nutraceutical Ingredients Market, by Form, 2016 – 2026 (USD Billion)
      5. 5.3.5. U.S.
        1. 5.3.5.1. U.S. Nutraceutical Ingredients Market, 2016 – 2026 (USD Billion)
      6. 5.3.6. Canada
        1. 5.3.6.1. Canada Nutraceutical Ingredients Market, 2016 – 2026 (USD Billion)
    4. 5.4. Europe
      1. 5.4.1. Europe Nutraceutical Ingredients Market, 2016 – 2026 (USD Billion)
        1. 5.4.1.1. Europe Nutraceutical Ingredients Market, by Country, 2016 - 2026 (USD Billion)
      2. 5.4.2. Europe Nutraceutical Ingredients Market, by Type, 2016 – 2026
        1. 5.4.2.1. Europe Nutraceutical Ingredients Market, by Type, 2016 – 2026 (USD Billion)
      3. 5.4.3. Europe Nutraceutical Ingredients Market, by Application, 2016 – 2026
        1. 5.4.3.1. Europe Nutraceutical Ingredients Market, by Application, 2016 – 2026 (USD Billion)
      4. 5.4.4. Europe Nutraceutical Ingredients Market, by Form, 2016 – 2026
        1. 5.4.4.1. Europe Nutraceutical Ingredients Market, by Form, 2016 – 2026 (USD Billion)
      5. 5.4.5. Germany
        1. 5.4.5.1. Germany Nutraceutical Ingredients Market, 2016 – 2026 (USD Billion)
      6. 5.4.6. France
        1. 5.4.6.1. France Nutraceutical Ingredients Market, 2016 – 2026 (USD Billion)
      7. 5.4.7. U.K.
        1. 5.4.7.1. U.K. Nutraceutical Ingredients Market, 2016 – 2026 (USD Billion)
      8. 5.4.8. Italy
        1. 5.4.8.1. Italy Nutraceutical Ingredients Market, 2016 – 2026 (USD Billion)
      9. 5.4.9. Spain
        1. 5.4.9.1. Spain Nutraceutical Ingredients Market, 2016 – 2026 (USD Billion)
      10. 5.4.10. Rest of Europe
        1. 5.4.10.1. Rest of Europe Nutraceutical Ingredients Market, 2016 – 2026 (USD Billion)
    5. 5.5. Asia Pacific
      1. 5.5.1. Asia Pacific Nutraceutical Ingredients Market, 2016 – 2026 (USD Billion)
        1. 5.5.1.1. Asia Pacific Nutraceutical Ingredients Market, by Country, 2016 - 2026 (USD Billion)
      2. 5.5.2. Asia Pacific Nutraceutical Ingredients Market, by Type, 2016 – 2026
        1. 5.5.2.1. Asia Pacific Nutraceutical Ingredients Market, by Type, 2016 – 2026 (USD Billion)
      3. 5.5.3. Asia Pacific Nutraceutical Ingredients Market, by Application, 2016 – 2026
        1. 5.5.3.1. Asia Pacific Nutraceutical Ingredients Market, by Application, 2016 – 2026 (USD Billion)
      4. 5.5.4. Asia Pacific Nutraceutical Ingredients Market, by Form, 2016 – 2026
        1. 5.5.4.1. Asia Pacific Nutraceutical Ingredients Market, by Form, 2016 – 2026 (USD Billion)
      5. 5.5.5. China
        1. 5.5.5.1. China Nutraceutical Ingredients Market, 2016 – 2026 (USD Billion)
      6. 5.5.6. Japan
        1. 5.5.6.1. Japan Nutraceutical Ingredients Market, 2016 – 2026 (USD Billion)
      7. 5.5.7. India
        1. 5.5.7.1. India Nutraceutical Ingredients Market, 2016 – 2026 (USD Billion)
      8. 5.5.8. South Korea
        1. 5.5.8.1. South Korea Nutraceutical Ingredients Market, 2016 – 2026 (USD Billion)
      9. 5.5.9. South-East Asia
        1. 5.5.9.1. South-East Asia Nutraceutical Ingredients Market, 2016 – 2026 (USD Billion)
      10. 5.5.10. Rest of Asia Pacific
        1. 5.5.10.1. Rest of Asia Pacific Nutraceutical Ingredients Market, 2016 – 2026 (USD Billion)
    6. 5.6. Latin America
      1. 5.6.1. Latin America Nutraceutical Ingredients Market, 2016 – 2026 (USD Billion)
        1. 5.6.1.1. Latin America Nutraceutical Ingredients Market, by Country, 2016 - 2026 (USD Billion)
      2. 5.6.2. Latin America Nutraceutical Ingredients Market, by Type, 2016 – 2026
        1. 5.6.2.1. Latin America Nutraceutical Ingredients Market, by Type, 2016 – 2026 (USD Billion)
      3. 5.6.3. Latin America Nutraceutical Ingredients Market, by Application, 2016 – 2026
        1. 5.6.3.1. Latin America Nutraceutical Ingredients Market, by Application, 2016 – 2026 (USD Billion)
      4. 5.6.4. Latin America Nutraceutical Ingredients Market, by Form, 2016 – 2026
        1. 5.6.4.1. Latin America Nutraceutical Ingredients Market, by Form, 2016 – 2026 (USD Billion)
      5. 5.6.5. Brazil
        1. 5.6.5.1. Brazil Nutraceutical Ingredients Market, 2016 – 2026 (USD Billion)
      6. 5.6.6. Mexico
        1. 5.6.6.1. Mexico Nutraceutical Ingredients Market, 2016 – 2026 (USD Billion)
      7. 5.6.7. Rest of Latin America
        1. 5.6.7.1. Rest of Latin America Nutraceutical Ingredients Market, 2016 – 2026 (USD Billion)
    7. 5.7. The Middle-East and Africa
      1. 5.7.1. The Middle-East and Africa Nutraceutical Ingredients Market, 2016 – 2026 (USD Billion)
        1. 5.7.1.1. The Middle-East and Africa Nutraceutical Ingredients Market, by Country, 2016 - 2026 (USD Billion)
      2. 5.7.2. The Middle-East and Africa Nutraceutical Ingredients Market, by Type, 2016 – 2026
        1. 5.7.2.1. The Middle-East and Africa Nutraceutical Ingredients Market, by Type, 2016 – 2026 (USD Billion)
      3. 5.7.3. The Middle-East and Africa Nutraceutical Ingredients Market, by Application, 2016 – 2026
        1. 5.7.3.1. The Middle-East and Africa Nutraceutical Ingredients Market, by Application, 2016 – 2026 (USD Billion)
      4. 5.7.4. The Middle-East and Africa Nutraceutical Ingredients Market, by Form, 2016 – 2026
        1. 5.7.4.1. The Middle-East and Africa Nutraceutical Ingredients Market, by Form, 2016 – 2026 (USD Billion)
      5. 5.7.5. GCC Countries
        1. 5.7.5.1. GCC Countries Nutraceutical Ingredients Market, 2016 – 2026 (USD Billion)
      6. 5.7.6. South Africa
        1. 5.7.6.1. South Africa Nutraceutical Ingredients Market, 2016 – 2026 (USD Billion)
      7. 5.7.7. Rest of Middle-East Africa
        1. 5.7.7.1. Rest of Middle-East Africa Nutraceutical Ingredients Market, 2016 – 2026 (USD Billion)
  6. Chapter 6 Nutraceutical Ingredients Market – Competitive Landscape
    1. 6.1. Competitor Market Share – Revenue
    2. 6.2. Market Concentration Rate Analysis, Top 3 and Top 5 Players
    3. 6.3. Strategic Developments
      1. 6.3.1. Acquisitions and Mergers
      2. 6.3.2. New Products
      3. 6.3.3. Research & Development Activities
  7. Chapter 7 Company Profiles
    1. 7.1. Associated British Foods
      1. 7.1.1. Company Overview
      2. 7.1.2. Product/Service Portfolio
      3. 7.1.3. Associated British Foods Sales, Revenue, and Gross Margin
      4. 7.1.4. Associated British Foods Revenue and Growth Rate
      5. 7.1.5. Associated British Foods Market Share
      6. 7.1.6. Recent Initiatives, Funding/VC Activities, and Technological Innovations
    2. 7.2. Arla Foods
      1. 7.2.1. Company Overview
      2. 7.2.2. Product/Service Portfolio
      3. 7.2.3. Arla Foods Sales, Revenue, and Gross Margin
      4. 7.2.4. Arla Foods Revenue and Growth Rate
      5. 7.2.5. Arla Foods Market Share
      6. 7.2.6. Recent Initiatives, Funding/VC Activities, and Technological Innovations
    3. 7.3. DSM
      1. 7.3.1. Company Overview
      2. 7.3.2. Product/Service Portfolio
      3. 7.3.3. DSM Sales, Revenue, and Gross Margin
      4. 7.3.4. DSM Revenue and Growth Rate
      5. 7.3.5. DSM Market Share
      6. 7.3.6. Recent Initiatives, Funding/VC Activities, and Technological Innovations
    4. 7.4. Ingredion Incorporated
      1. 7.4.1. Company Overview
      2. 7.4.2. Product/Service Portfolio
      3. 7.4.3. Ingredion Incorporated Sales, Revenue, and Gross Margin
      4. 7.4.4. Ingredion Incorporated Revenue and Growth Rate
      5. 7.4.5. Ingredion Incorporated Market Share
      6. 7.4.6. Recent Initiatives, Funding/VC Activities, and Technological Innovations
    5. 7.5. Tate & Lyle PLC
      1. 7.5.1. Company Overview
      2. 7.5.2. Product/Service Portfolio
      3. 7.5.3. Tate & Lyle PLC Sales, Revenue, and Gross Margin
      4. 7.5.4. Tate & Lyle PLC Revenue and Growth Rate
      5. 7.5.5. Tate & Lyle PLC Market Share
      6. 7.5.6. Recent Initiatives, Funding/VC Activities, and Technological Innovations
    6. 7.6. Ajinomoto Co Inc
      1. 7.6.1. Company Overview
      2. 7.6.2. Product/Service Portfolio
      3. 7.6.3. Ajinomoto Co Inc Sales, Revenue, and Gross Margin
      4. 7.6.4. Ajinomoto Co Inc Revenue and Growth Rate
      5. 7.6.5. Ajinomoto Co Inc Market Share
      6. 7.6.6. Recent Initiatives, Funding/VC Activities, and Technological Innovations
    7. 7.7. Cargill Incorporated
      1. 7.7.1. Company Overview
      2. 7.7.2. Product/Service Portfolio
      3. 7.7.3. Cargill Incorporated Sales, Revenue, and Gross Margin
      4. 7.7.4. Cargill Incorporated Revenue and Growth Rate
      5. 7.7.5. Cargill Incorporated Market Share
      6. 7.7.6. Recent Initiatives, Funding/VC Activities, and Technological Innovations
        1. 7.8. E.I. Du Pont De Nemours and Company
      7. 7.8.1. Company Overview
      8. 7.8.2. Product/Service Portfolio
        1. 7.8.3. E.I. Du Pont De Nemours and Company Sales, Revenue, and Gross Margin
        2. 7.8.4. E.I. Du Pont De Nemours and Company Revenue and Growth Rate
        3. 7.8.5. E.I. Du Pont De Nemours and Company Market Share
    8. 7.8.6. Recent Initiatives, Funding/VC Activities, and Technological Innovations
  8. 7.9. BASF SE
    1. 7.9.1. Company Overview
    2. 7.9.2. Product/Service Portfolio
    3. 7.9.3. BASF SE Sales, Revenue, and Gross Margin
    4. 7.9.4. BASF SE Revenue and Growth Rate
    5. 7.9.5. BASF SE Market Share
    6. 7.9.6. Recent Initiatives, Funding/VC Activities, and Technological Innovations
  9. 7.10. Archers Daniels Midland Company
    1. 7.10.1. Company Overview
    2. 7.10.2. Product/Service Portfolio
    3. 7.10.3. Archers Daniels Midland Company Sales, Revenue, and Gross Margin
    4. 7.10.4. Archers Daniels Midland Company Revenue and Growth Rate
    5. 7.10.5. Archers Daniels Midland Company Market Share
    6. 7.10.6. Recent Initiatives, Funding/VC Activities, and Technological Innovations
  10. 7.11. Kerry Inc
    1. 7.11.1. Company Overview
    2. 7.11.2. Product/Service Portfolio
    3. 7.11.3. Kerry Inc Sales, Revenue, and Gross Margin
    4. 7.11.4. Kerry Inc Revenue and Growth Rate
    5. 7.11.5. Kerry Inc Market Share
    6. 7.11.6. Recent Initiatives, Funding/VC Activities, and Technological Innovations
  • Chapter 8 Nutraceutical Ingredients — Industry Analysis
    1. 8.1. Introduction and Taxonomy
    2. 8.2. Nutraceutical Ingredients Market – Key Trends
      1. 8.2.1. Market Drivers
      2. 8.2.2. Market Restraints
      3. 8.2.3. Market Opportunities
    3. 8.3. Value Chain Analysis
    4. 8.4. Key Mandates and Regulations
    5. 8.5. Technology Roadmap and Timeline
    6. 8.6. Nutraceutical Ingredients Market – Attractiveness Analysis
      1. 8.6.1. By Type
      2. 8.6.2. By Application
      3. 8.6.3. By Form
      4. 8.6.4. By Region
  • Chapter 9 Industrial Chain, Sourcing Strategy, and Downstream Buyers
    1. 9.1. Nutraceutical Ingredients Industrial Chain Analysis
    2. 9.2. Downstream Buyers
    3. 9.3. Distributors/Traders List
  • Chapter 10 Marketing Strategy Analysis
    1. 10.1. Marketing Channel
    2. 10.2. Direct Marketing
    3. 10.3. Indirect Marketing
    4. 10.4. Marketing Channel Development Trends
    5. 10.5. Economic/Political Environmental Change
  • Chapter 11 Report Conclusion & Key Insights
    1. 11.1. Key Insights from Primary Interviews & Surveys Respondents
    2. 11.2. Key Takeaways from Analysts, Consultants, and Industry Leaders
  • Chapter 12 Research Approach & Methodology
    1. 12.1. Report Description
    2. 12.2. Research Scope
    3. 12.3. Research Methodology
      1. 12.3.1. Secondary Research
      2. 12.3.2. Primary Research
      3. 12.3.3. Statistical Models
        1. 12.3.3.1. Company Share Analysis Model
        2. 12.3.3.2. Revenue Based Modeling
      4. 12.3.4. Research Limitations

      List of Figures

      Fig.1	Product Picture of Nutraceutical Ingredients
      Fig.2	Global Nutraceutical Ingredients Market, 2016 – 2026 (USD Billion)
      Fig.3	Global Nutraceutical Ingredients Market Absolute Revenue Opportunity, 2016 – 2026 (USD Billion)
      Fig.4	Global Nutraceutical Ingredients Market Incremental Revenue Opportunity, 2020 – 2026 (USD Billion)
      Fig.5	Global Nutraceutical Ingredients Market Share, by Type, 2019 & 2026 (USD Billion)
      Fig.6	Global Probiotic Nutraceutical Ingredients Market, 2016 – 2026 (USD Billion)
      Fig.7	Global Proteins & Amino Acids  Nutraceutical Ingredients Market, 2016 – 2026 (USD Billion)
      Fig.8	Global Fibers & Specialty Carbohydrates  Nutraceutical Ingredients Market, 2016 – 2026 (USD Billion)
      Fig.9	Global Omega 3 Fatty Acids Nutraceutical Ingredients Market, 2016 – 2026 (USD Billion)
      Fig.10	Global Vitamins  Nutraceutical Ingredients Market, 2016 – 2026 (USD Billion)
      Fig.11	Global Prebiotic  Nutraceutical Ingredients Market, 2016 – 2026 (USD Billion)
      Fig.12	Global Carotenoids  Nutraceutical Ingredients Market, 2016 – 2026 (USD Billion)
      Fig.13	Global Minerals  Nutraceutical Ingredients Market, 2016 – 2026 (USD Billion)
      Fig.14	Global Others Nutraceutical Ingredients Market, 2016 – 2026 (USD Billion)
      Fig.15	Global Nutraceutical Ingredients Market Share, by Application, 2019 & 2026 (USD Billion)
      Fig.16	Global Food  Nutraceutical Ingredients Market, 2016 – 2026 (USD Billion)
      Fig.17	Global Beverages Nutraceutical Ingredients Market, 2016 – 2026 (USD Billion)
      Fig.18	Global Personal Care Nutraceutical Ingredients Market, 2016 – 2026 (USD Billion)
      Fig.19	Global Animal Nutrition  Nutraceutical Ingredients Market, 2016 – 2026 (USD Billion)
      Fig.20	Global Others Nutraceutical Ingredients Market, 2016 – 2026 (USD Billion)
      Fig.21	Global Nutraceutical Ingredients Market Share, by Form, 2019 & 2026 (USD Billion)
      Fig.22	Global Dry  Nutraceutical Ingredients Market, 2016 – 2026 (USD Billion)
      Fig.23	Global Liquid Nutraceutical Ingredients Market, 2016 – 2026 (USD Billion)
      Fig.24	Global Nutraceutical Ingredients Market Share, by Region, 2019 & 2026 (USD Billion)
      Fig.25	North America Nutraceutical Ingredients Market, 2016 – 2026 (USD Billion)
      Fig.26	U.S. Nutraceutical Ingredients Market, 2016 – 2026 (USD Billion)
      Fig.27	Canada Nutraceutical Ingredients Market, 2016 – 2026 (USD Billion)
      Fig.28	Europe Nutraceutical Ingredients Market, 2016 – 2026 (USD Billion)
      Fig.29	Germany Nutraceutical Ingredients Market, 2016 – 2026 (USD Billion)
      Fig.30	France Nutraceutical Ingredients Market, 2016 – 2026 (USD Billion)
      Fig.31	U.K. Nutraceutical Ingredients Market, 2016 – 2026 (USD Billion)
      Fig.32	Italy Nutraceutical Ingredients Market, 2016 – 2026 (USD Billion)
      Fig.33	Spain Nutraceutical Ingredients Market, 2016 – 2026 (USD Billion)
      Fig.34	Rest of Europe Nutraceutical Ingredients Market, 2016 – 2026 (USD Billion)
      Fig.35	Asia Pacific Nutraceutical Ingredients Market, 2016 – 2026 (USD Billion)
      Fig.36	China Nutraceutical Ingredients Market, 2016 – 2026 (USD Billion)
      Fig.37	Japan Nutraceutical Ingredients Market, 2016 – 2026 (USD Billion)
      Fig.38	India Nutraceutical Ingredients Market, 2016 – 2026 (USD Billion)
      Fig.39	South  Korea Nutraceutical Ingredients Market, 2016 – 2026 (USD Billion)
      Fig.40	South-East Asia Nutraceutical Ingredients Market, 2016 – 2026 (USD Billion)
      Fig.41	Rest of Asia Pacific Nutraceutical Ingredients Market, 2016 – 2026 (USD Billion)
      Fig.42	Latin America Nutraceutical Ingredients Market, 2016 – 2026 (USD Billion)
      Fig.43	Brazil Nutraceutical Ingredients Market, 2016 – 2026 (USD Billion)
      Fig.44	Mexico Nutraceutical Ingredients Market, 2016 – 2026 (USD Billion)
      Fig.45	Rest of Latin America Nutraceutical Ingredients Market, 2016 – 2026 (USD Billion)
      Fig.46	The Middle-East and Africa Nutraceutical Ingredients Market, 2016 – 2026 (USD Billion)
      Fig.47	GCC Countries Nutraceutical Ingredients Market, 2016 – 2026 (USD Billion)
      Fig.48	South Africa Nutraceutical Ingredients Market, 2016 – 2026 (USD Billion)
      Fig.49	Rest of Middle-East Africa Nutraceutical Ingredients Market, 2016 – 2026 (USD Billion)
      Fig.50	Competitor Market Share – Revenue
      Fig.51	Associated British Foods Revenue and Growth Rate
      Fig.52	Associated British Foods Market Share
      Fig.53	Arla Foods Revenue and Growth Rate
      Fig.54	Arla Foods Market Share
      Fig.55	DSM Revenue and Growth Rate
      Fig.56	DSM Market Share
      Fig.57	Ingredion Incorporated Revenue and Growth Rate
      Fig.58	Ingredion Incorporated Market Share
      Fig.59	Tate & Lyle PLC Revenue and Growth Rate
      Fig.60	Tate & Lyle PLC Market Share
      Fig.61	Ajinomoto Co Inc Revenue and Growth Rate
      Fig.62	Ajinomoto Co Inc Market Share
      Fig.63	Cargill Incorporated Revenue and Growth Rate
      Fig.64	Cargill Incorporated Market Share
      Fig.65	E.I. Du Pont De Nemours and Company Revenue and Growth Rate
      Fig.66	E.I. Du Pont De Nemours and Company Market Share
      Fig.67	BASF SE Revenue and Growth Rate
      Fig.68	BASF SE Market Share
      Fig.69	Archers Daniels Midland Company Revenue and Growth Rate
      Fig.70	Archers Daniels Midland Company Market Share
      Fig.71	Kerry Inc Revenue and Growth Rate
      Fig.72	Kerry Inc Market Share
      Fig.73	Market Dynamics
      Fig.74	Global Nutraceutical Ingredients – Value Chain Analysis
      Fig.75	Key Mandates and Regulations
      Fig.76	Technology Roadmap and Timeline
      Fig.77	Market Attractiveness Analysis – By Type
      Fig.78	Market Attractiveness Analysis – By Application
      Fig.79	Market Attractiveness Analysis – By Form
      Fig.80	Market Attractiveness Analysis – By Region
      Fig.81	Nutraceutical Ingredients Industrial Chain Analysis
      Fig.82	Market Channels
      Fig.83	Marketing Channel Development Trend
      Fig.84	Growth in World Gross Product, 2008-2018
      

      List of Tables

      Table 1	Global Nutraceutical Ingredients Market, 2019 & 2026 (USD Billion)
      Table 2	Global Nutraceutical Ingredients Market, by Type, 2016 – 2026 (USD Billion)
      Table 3	Global Nutraceutical Ingredients Market, by Application, 2016 – 2026 (USD Billion)
      Table 4	Global Nutraceutical Ingredients Market, by Form, 2016 – 2026 (USD Billion)
      Table 5	Global Nutraceutical Ingredients Market, by Region, 2016 – 2026 (USD Billion)
      Table 6	North America Nutraceutical Ingredients Market, by Country, 2016 – 2026 (USD Billion)
      Table 7	North America Nutraceutical Ingredients Market, by Type, 2016 – 2026 (USD Billion)
      Table 8	North America Nutraceutical Ingredients Market, by Application, 2016 – 2026 (USD Billion)
      Table 9	North America Nutraceutical Ingredients Market, by Form, 2016 – 2026 (USD Billion)
      Table 10 Europe Nutraceutical Ingredients Market, by Country, 2016 – 2026 (USD Billion)
      Table 11 Europe Nutraceutical Ingredients Market, by Type, 2016 – 2026 (USD Billion)
      Table 12 Europe Nutraceutical Ingredients Market, by Application, 2016 – 2026 (USD Billion)
      Table 13 Europe Nutraceutical Ingredients Market, by Form, 2016 – 2026 (USD Billion)
      Table 14 Asia Pacific Nutraceutical Ingredients Market, by Country, 2016 – 2026 (USD Billion)
      Table 15 Asia Pacific Nutraceutical Ingredients Market, by Type, 2016 – 2026 (USD Billion)
      Table 16 Asia Pacific Nutraceutical Ingredients Market, by Application, 2016 – 2026 (USD Billion)
      Table 17 Asia Pacific Nutraceutical Ingredients Market, by Form, 2016 – 2026 (USD Billion)
      Table 18 Latin America Nutraceutical Ingredients Market, by Country, 2016 – 2026 (USD Billion)
      Table 19 Latin America Nutraceutical Ingredients Market, by Type, 2016 – 2026 (USD Billion)
      Table 20 Latin America Nutraceutical Ingredients Market, by Application, 2016 – 2026 (USD Billion)
      Table 21 Latin America Nutraceutical Ingredients Market, by Form, 2016 – 2026 (USD Billion)
      Table 22 The Middle-East and Africa Nutraceutical Ingredients Market, by Country, 2016 – 2026 (USD Billion)
      Table 23 The Middle-East and Africa Nutraceutical Ingredients Market, by Type, 2016 – 2026 (USD Billion)
      Table 24 The Middle-East and Africa Nutraceutical Ingredients Market, by Application, 2016 – 2026 (USD Billion)
      Table 25 The Middle-East and Africa Nutraceutical Ingredients Market, by Form, 2016 – 2026 (USD Billion)
      Table 26 Global Nutraceutical Ingredients Market - Company Revenue Analysis, 2016 – 2019 (USD Billion)
      Table 27 Global Nutraceutical Ingredients Market - Company Revenue Share Analysis, 2016 – 2019 (%)
      Table 28 Acquisitions and Mergers
      Table 29 Market Drivers – Impact Analysis
      Table 30 Market Restraints
      Table 31 Market Opportunities
      Table 32 Major Buyers of Nutraceutical Ingredients
      Table 33 Distributors/Traders of Nutraceutical Ingredients by Region
      
  • Industry Major Market Players

    • Associated British Foods
    • Arla Foods
    • DSM
    • Ingredion Incorporated
    • Tate & Lyle PLC
    • Ajinomoto Co Inc.
    • Cargill Incorporated
    • E.I. Du Pont De Nemours and Company
    • BASF SE
    • Archers Daniels Midland Company
    • Kerry Inc.