![]()
Search Market Research Report
Liquid Nutritional Supplements Market Size, Share Global Analysis Report, 2020–2026

Liquid Nutritional Supplements Market By Product (Medical Supplements, Additional Supplements, and Sports Nutrition), By Route of Administration (Parenteral, Oral, and Enteral), By Age Group (Adults, Old Age, Infants, and Children), By Ingredient (Vitamins, Proteins and Amino Acids, Botanicals, and Minerals), And By Region: Global Industry Outlook, Market Size, Business Intelligence, Consumer Preferences, Statistical Surveys, Comprehensive Analysis, Historical Developments, Current Trends, and Forecast 2020–2026
Industry Insights
This specialized and expertise oriented industry research report scrutinizes the technical and commercial business outlook of the global liquid nutritional supplements industry. The report analyzes and declares the historical and current trends analysis of the global liquid nutritional supplements industry and subsequently recommends the projected trends anticipated to be observed in the global liquid nutritional supplements market during the upcoming years.
The global liquid nutritional supplements market report analyzes and notifies the industry statistics at the global as well as regional and country levels in order to acquire a thorough perspective of the entire global liquid nutritional supplements market. The historical and past insights are provided for FY 2016 to FY 2019 whereas projected trends are delivered for FY 2020 to FY 2026. The quantitative and numerical data is represented in terms of value (USD Million) from FY 2016 – 2026.
The quantitative data is further underlined and reinforced by comprehensive qualitative data which comprises various across-the-board market dynamics. The rationales which directly or indirectly impact the global liquid nutritional supplements industry are exemplified through parameters such as growth drivers, restraints, challenges, and opportunities among other impacting factors.
Throughout our research report, we have encompassed all the proven models and tools of industry analysis and extensively illustrated all the key business strategies and business models adopted in the global liquid nutritional supplements industry. The report provides an all-inclusive and detailed competitive landscape prevalent in the global liquid nutritional supplements market.
The report utilizes established industry analysis tools and models such as Porter’s Five Forces framework to analyze and recognize critical business strategies adopted by various stakeholders involved in the entire value chain of the global liquid nutritional supplements industry. The global liquid nutritional supplements market report additionally employs SWOT analysis and PESTLE analysis models for further in-depth analysis.
The report study further includes an in-depth analysis of industry players' market shares and provides an overview of leading players' market position in the global liquid nutritional supplements sector. Key strategic developments in the global liquid nutritional supplements market competitive landscape such as acquisitions & mergers, inaugurations of different products and services, partnerships & joint ventures, MoU agreements, VC & funding activities, R&D activities, and geographic expansion among other noteworthy activities by key players of the global liquid nutritional supplements market are appropriately highlighted in the report.
The demand for liquid nutritional supplements is rising at a considerable rate due to the augmenting health consciousness and proliferating disposable incomes in different regions of the globe. Based on a general observation, people do not prefer consuming nutritional supplements in pills or capsules form, which is also a key factor propelling the adoption of liquid nutritional supplements worldwide.
The global liquid nutritional supplements market research report delivers an acute valuation and taxonomy of the global liquid nutritional supplements industry by practically splitting the market on the basis of different products, routes of administration, age groups, ingredients, and regions. Through the analysis of the historical and projected trends, all the segments and sub-segments were evaluated through the bottom-up approach, and different market sizes have been projected for FY 2020 to FY 2026. The regional segmentation of the global liquid nutritional supplements industry includes the complete classification of all the major continents including North America, Latin America, Europe, Asia Pacific, and Middle East & Africa. Further, country-wise data for the global liquid nutritional supplements industry is provided for the leading economies of the world.
The global liquid nutritional supplements market is segmented based on the product, route of administration, age group, ingredient, and region. Product-wise, the global liquid nutritional supplements industry is categorized into medical supplements, additional supplements, and sports nutrition. Based on the route of administration, the market is segmented into parenteral, oral, and enteral. By age group, the market is divided into adults, old age, infants, and children. Ingredient-wise, the industry is bifurcated into vitamins, proteins and amino acids, botanicals, and minerals.
 Report Scope
Report Attribute |
Details |
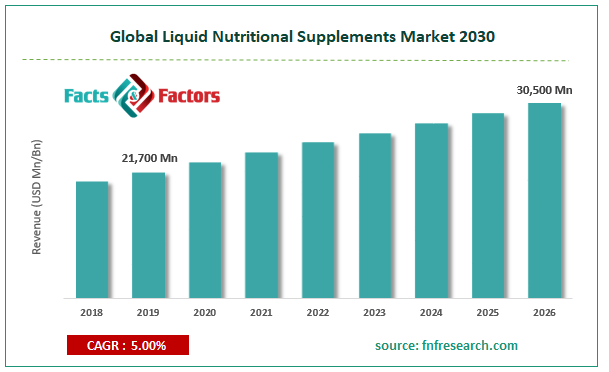
Market Size in 2019 |
USD 21,700 Million |
Projected Market Size in 2026 |
USD 30,500 Million |
Growth Rate |
CAGR 5% |
Base Year |
2019 |
Forecast Years |
2020-2026 |
Key Market Players |
Herbalife International, Bionova Lifesciences, Pfizer, Nu Skin Enterprises, Abbott Laboratories, Glanbia, NBTY Inc., Archer Daniels Midland, Nature’s Sunshine Forms, Amway, Carlyle Group, GlaxoSmithKline, Bayer and Others |
Key Segment |
By Product, By Route Of Administration, By Age Group, By Ingredient and By Region |
Major Regions Covered |
North America, Europe, Asia Pacific, Latin America, and the Middle East & Africa |
Purchase Options |
Request customized purchase options to meet your research needs. Explore purchase options |
Some of the essential players operating in the global liquid nutritional supplements market, but not restricted to include
- Herbalife International
- BionovaLifesciences
- Pfizer
- Nu Skin Enterprises
- Abbott Laboratories
- Glanbia
- NBTY Inc.
- Archer Daniels Midland
- Nature’s Sunshine Forms
- Amway
- Carlyle Group
- GlaxoSmithKline
- Bayer
- among others.
The taxonomy of the global liquid nutritional supplements market by its scope and segmentation is as follows:
Product Segmentation Analysis
- Medical Supplements
- Additional Supplements
- Sports Nutrition
Route Of Administration Segmentation Analysis
- Parenteral
- Oral
- Enteral
Age Group Segmentation Analysis
- Adults
- Old Age
- Infants
- Children
Ingredient Segmentation Analysis
- Vitamins
- Proteins and Amino Acids
- Whey Protein
- Soy Protein
- Casein
- Pea Protein
- Botanicals
- Minerals
Global Liquid Nutritional Supplements Market: Regional Segmentation Analysis
- North America
- The U.S.
- Canada
- Europe
- Germany
- The UK
- France
- Spain
- Italy
- Rest of Europe
- Asia Pacific
- China
- Japan
- India
- South Korea
- Southeast Asia
- Rest of Asia Pacific
- Latin America
- Brazil
- Mexico
- Rest of Latin America
- Middle East & Africa
- GCC
- South Africa
- Rest of Middle East & Africa
Table of Content
Industry Major Market Players
- Herbalife International
- Bionova Life sciences
- Pfizer
- Nu Skin Enterprises
- Abbott Laboratories
- Glanbia
- NBTY Inc.
- Archer Daniels Midland
- Nature’s Sunshine Forms
- Amway
- Carlyle Group
- GlaxoSmithKline
- Bayer


Copyright © 2025 - 2026, All Rights Reserved, Facts and Factors