Search Market Research Report

Discover Our Latest Reports
Discover Our Featured Reports
Discover Top Selling Reports

Green Tea Market Size, Share Global Analysis Report, 2021 - 2026

report img

Green Tea Market By Form (Tea Bags, Loose Leaves, Loose Powder, Read-to-Drink, & Capsules & Tablets), By Flavor (Flavored & Unflavored), By Distribution Channel (Supermarkets/Hypermarkets, Convenience Stores, Specialty Stores, & Online Retail), And By Regions - Global & Regional Industry Perspective, Comprehensive Analysis, and Forecast 2021 - 2026

Industry Insights

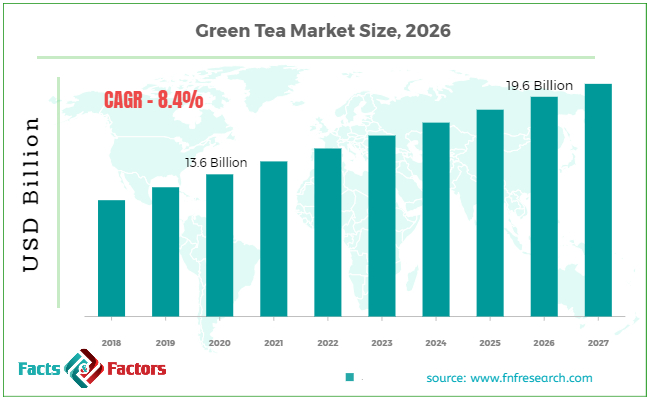
[196+ Pages Report] We at Facts & Factors have recently published a market study “Global Green Tea Market” which focuses as a guide for the latter and aims to capture the highlights and a forecast for the same over the projected duration. We estimate that the global green tea market is estimated to have reached USD 13.6 Billion in 2020 and is further expected to expand at a CAGR of 8.4% to attain a value of USD 19.6 Billion by 2026.

global-green-tea-market-size

To know more about this report | Request Free Sample Copy

logoMarket Overview

Green Tea has said to be originated from the era of Emperor Shennong which was projected to be during the time period of 618-907 AD. It is a form of tea that is procured from camellia sinensis leaves and buds that have not undergone the oxidation and withering process that is used for fermenting oolong teas and black teas. While the origination of green tea is rooted to China, a majority of the production and manufacturing abilities has been shifted to east Asia. Several categories of green tea exist on a variety of camellia sinensis leaves used, growing conditions, horticulture measures, and duration of harvest.

logoIndustry Growth Factors

The primary driving factors for the robust growth of the global green tea market can be credited to rising awareness among consumers regarding health benefits of green tea coupled with lifestyle-related changes to name a few. Several studies have indicated that daily regulated amounts of green tea can lead to a larger boost of nutrients required by the human body which can help delay occurrences of a variety of disorders. Rising popularity of functional beverages among millennial and generation Z will incentivize manufacturers to introduce a wider range of flavors and novel types of green tea in order to keep up with the lucrative demands arising. Prevention of certain diseases that are common among the middle aged population will further boost the sales of the global green tea to a larger extent.

Increased concerns regarding maintaining superior health due to the ongoing pandemic rising demand for nutritional beverages will further increase the footprint of the global green tea market. Change of sedentary and stressful lifestyle and increased prevalence of obesity, diabetes, and cardiovascular conditions will open new revenue for the global green tea market during the forecast. Increasing consumer awareness about the health benefits between consumption of antioxidants-based foods and beverages will further nudge the market toward a positive outlook. Disruptions in supply chains due to COVID-19 and volatile price of raw materials is expected to hamper the growth of the global green tea market to a certain extent.

logoSegmentation Analysis

The global green tea market can be segmented into form, flavor, distribution channel, and regions.

On the basis of form, the global green tea market can be divided into tea bags, loose leaves, loose powder, read-to-drink, and capsules and tablets. Tea bags are expected to occupy the largest market share during the forecast period owing to easy usability, increased convenience due to modern-day hectic lifestyles, easy storage, and portable measures. Furthermore, the inclusion of eco-friendly tea bags will aid in easy disposal and will further appeal to a wider range of consumers. On the basis of flavor, the global green tea market can be fragmented into flavored and unflavored. Flavored green tea will dominate the market segment during the forecast owing to rising consumer preferences for enticing taste profiles coupled with the nutritional benefits. Furthermore, the inclusion of popular flavors such as honey, citrus, floral, and fruity to name a few will aid in boosting the sales of the flavored green tea, thereby cementing the dominant position of the market. On the basis of distribution channels, the global green tea market can be broken down into supermarkets/hypermarkets, convenience stores, specialty stores, and online retail. Supermarkets/hypermarkets are expected to witness the largest market share during the forecast period owing to rising investment from capitalists and the private sector and an overall easy shopping experience when compared to their counterparts. Rising technological advancements will further help in boosting the sales of green tea through the latter due to adequate providence of product directly to consumers.

logo Regional Analysis

Asia-Pacific is expected to recoup the largest market share during the advent of the forecast in terms of global revenue contribution. A healthy dose of nutrients coupled with rising consumer awareness and risen consumer spending power will aid the growth of the global green tea market in the region during the forecast. Rising disposable income among consumers and the presence of key players in the region will further boost the sales of green tea. China is the main exporter in the region and will contribute to the largest market share from the global perspective. North America is expected to witness the fastest growth during the forecast owing to the rising popularity of the market during the forecast coupled with rising consumer awareness about health benefits and hectic lifestyle changes among a majority of the population.

logoReport Scope

Report Attribute

Details

Market Size in 2020

USD 13.6 Billion

Projected Market Size in 2026

USD 19.6 Billion

CAGR Growth Rate

8.4% CAGR

Base Year

2020

Forecast Years

2021-2026

Key Market Players

Associated British Food, plc., Unilever, plc., Tata Consumer Products, The Bigelow Tea Company, East West Tea Company, Numi, Inc., Tazo Tea Company, Shangri La Tea Company, The Republic of Tea, Inc., Keurig Dr. Pepper, Inc., Celestial Seasonings, Finlays Beverages, Inc., Frontier Natural Products Co-op, and AMORE Pacific Corp, among others.

Key Segment

By Form, By Flavor, By Distribution Channels, and By Region

Major Regions Covered

North America, Europe, Asia Pacific, Latin America, and the Middle East & Africa

Purchase Options

Request customized purchase options to meet your research needs. Explore purchase options

logo Competitive Players

logoThe key participants in the global green tea market are

  • Associated British Food plc.
  • Unilever plc.
  • Tata Consumer Products
  • The Bigelow Tea Company
  • East West Tea Company
  • Numi Inc.
  • Tazo Tea Company
  • Shangri La Tea Company
  • The Republic of Tea Inc.
  • Keurig Dr. Pepper Inc.
  • Celestial Seasonings
  • Finlays Beverages Inc.
  • Frontier Natural Products Co-op
  • AMORE Pacific Corp
  • among others.

logo By Form Segment Analysis

  • Tea Bags
  • Loose Leaves
  • Loose Powder
  • Read-to-Drink
  • Capsules & Tablets

logo By Flavor Segment Analysis

  • Flavored
  • Lemon
  • Aloe Vera
  • Cinnamon
  • Vanilla
  • Basil
  • Wild Berry
  • Jasmine
  • Others
  • Unflavored

logo By Distribution Channels Segment Analysis

  • Supermarkets/Hypermarkets
  • Convenience Stores
  • Specialty Stores
  • Online Retail

logo By Regional Segment Analysis

  • North America
    • U.S.
    • Canada
  • Europe
    • UK
    • France
    • Germany
    • Italy
    • Spain
    • Rest of Europe
  • Asia Pacific
    • China
    • Japan
    • India
    • South Korea
    • Southeast Asia
    • Rest of Asia Pacific
  • Latin America
    • Brazil
    • Mexico
    • Rest of Latin America
  • Middle East and Africa
    • GCC Countries
    • South Africa
    • Rest of MEA

Table of Content

  1. Chapter 1 Executive Summary
    1. 1.1. Introduction of Green Tea
    2. 1.2. Global Green Tea Market, 2020 & 2026 (USD Billion)
    3. 1.3. Global Green Tea Market, 2016 – 2026 (USD Billion)
    4. 1.4. Global Green Tea Market Absolute Revenue Opportunity, 2016 – 2026 (USD Billion)
    5. 1.5. Global Green Tea Market Incremental Revenue Opportunity, 2020 – 2026 (USD Billion)
  2. Chapter 2 Green Tea Market – Form Analysis
    1. 2.1. Global Green Tea Market – Form Overview
    2. 2.2. Global Green Tea Market Share, by Form, 2020 & 2026 (USD Billion)
    3. 2.3. Tea Bags
      1. 2.3.1. Global Tea Bags Green Tea Market, 2016 – 2026 (USD Billion)
    4. 2.4. Loose Leaves
      1. 2.4.1. Global Loose Leaves Green Tea Market, 2016 – 2026 (USD Billion)
    5. 2.5. Loose Powder
      1. 2.5.1. Global Loose Powder Green Tea Market, 2016 – 2026 (USD Billion)
    6. 2.6. Read-to-Drink
      1. 2.6.1. Global Read-to-Drink Green Tea Market, 2016 – 2026 (USD Billion)
    7. 2.7. Capsules & Tablets
      1. 2.7.1. Global Capsules & Tablets Green Tea Market, 2016 – 2026 (USD Billion)
  3. Chapter 3 Green Tea Market – Flavour Analysis
    1. 3.1. Global Green Tea Market – Flavour Overview
    2. 3.2. Global Green Tea Market Share, by Flavour, 2020 & 2026 (USD Billion)
    3. 3.3. Flavoured
      1. 3.3.1. Global Flavoured Green Tea Market, 2016 – 2026 (USD Billion)
    4. 3.4. Unflavoured
      1. 3.4.1. Global Unflavoured Green Tea Market, 2016 – 2026 (USD Billion)
  4. Chapter 4 Green Tea Market – Distribution Channel Analysis
    1. 4.1. Global Green Tea Market – Distribution Channel Overview
    2. 4.2. Global Green Tea Market Share, by Distribution Channel, 2020 & 2026 (USD Billion)
    3. 4.3. Supermarkets/Hypermarkets
      1. 4.3.1. Global Supermarkets/Hypermarkets Green Tea Market, 2016 – 2026 (USD Billion)
    4. 4.4. Convenience Stores
      1. 4.4.1. Global Convenience Stores Green Tea Market, 2016 – 2026 (USD Billion)
    5. 4.5. Specialty Stores
      1. 4.5.1. Global Specialty Stores Green Tea Market, 2016 – 2026 (USD Billion)
    6. 4.6. Online Retail
      1. 4.6.1. Global Online Retail Green Tea Market, 2016 – 2026 (USD Billion)
  5. Chapter 5 Green Tea Market – Regional Analysis
    1. 5.1. Global Green Tea Market Regional Overview
    2. 5.2. Global Green Tea Market Share, by Region, 2020 & 2026 (USD Billion)
    3. 5.3. North America
      1. 5.3.1. North America Green Tea Market, 2016 – 2026 (USD Billion)
        1. 5.3.1.1. North America Green Tea Market, by Country, 2016 - 2026 (USD Billion)
      2. 5.3.2. North America Green Tea Market, by Form, 2016 – 2026
        1. 5.3.2.1. North America Green Tea Market, by Form, 2016 – 2026 (USD Billion)
      3. 5.3.3. North America Green Tea Market, by Flavour, 2016 – 2026
        1. 5.3.3.1. North America Green Tea Market, by Flavour, 2016 – 2026 (USD Billion)
      4. 5.3.4. North America Green Tea Market, by Distribution Channel, 2016 – 2026
        1. 5.3.4.1. North America Green Tea Market, by Distribution Channel, 2016 – 2026 (USD Billion)
      5. 5.3.5. U.S.
        1. 5.3.5.1. U.S. Green Tea Market, 2016 – 2026 (USD Billion)
      6. 5.3.6. Canada
        1. 5.3.6.1. Canada Green Tea Market, 2016 – 2026 (USD Billion)
    4. 5.4. Europe
      1. 5.4.1. Europe Green Tea Market, 2016 – 2026 (USD Billion)
        1. 5.4.1.1. Europe Green Tea Market, by Country, 2016 - 2026 (USD Billion)
      2. 5.4.2. Europe Green Tea Market, by Form, 2016 – 2026
        1. 5.4.2.1. Europe Green Tea Market, by Form, 2016 – 2026 (USD Billion)
      3. 5.4.3. Europe Green Tea Market, by Flavour, 2016 – 2026
        1. 5.4.3.1. Europe Green Tea Market, by Flavour, 2016 – 2026 (USD Billion)
      4. 5.4.4. Europe Green Tea Market, by Distribution Channel, 2016 – 2026
        1. 5.4.4.1. Europe Green Tea Market, by Distribution Channel, 2016 – 2026 (USD Billion)
      5. 5.4.5. Germany
        1. 5.4.5.1. Germany Green Tea Market, 2016 – 2026 (USD Billion)
      6. 5.4.6. France
        1. 5.4.6.1. France Green Tea Market, 2016 – 2026 (USD Billion)
      7. 5.4.7. U.K.
        1. 5.4.7.1. U.K. Green Tea Market, 2016 – 2026 (USD Billion)
      8. 5.4.8. Italy
        1. 5.4.8.1. Italy Green Tea Market, 2016 – 2026 (USD Billion)
      9. 5.4.9. Spain
        1. 5.4.9.1. Spain Green Tea Market, 2016 – 2026 (USD Billion)
      10. 5.4.10. Rest of Europe
        1. 5.4.10.1. Rest of Europe Green Tea Market, 2016 – 2026 (USD Billion)
    5. 5.5. Asia Pacific
      1. 5.5.1. Asia Pacific Green Tea Market, 2016 – 2026 (USD Billion)
        1. 5.5.1.1. Asia Pacific Green Tea Market, by Country, 2016 - 2026 (USD Billion)
      2. 5.5.2. Asia Pacific Green Tea Market, by Form, 2016 – 2026
        1. 5.5.2.1. Asia Pacific Green Tea Market, by Form, 2016 – 2026 (USD Billion)
      3. 5.5.3. Asia Pacific Green Tea Market, by Flavour, 2016 – 2026
        1. 5.5.3.1. Asia Pacific Green Tea Market, by Flavour, 2016 – 2026 (USD Billion)
      4. 5.5.4. Asia Pacific Green Tea Market, by Distribution Channel, 2016 – 2026
        1. 5.5.4.1. Asia Pacific Green Tea Market, by Distribution Channel, 2016 – 2026 (USD Billion)
      5. 5.5.5. China
        1. 5.5.5.1. China Green Tea Market, 2016 – 2026 (USD Billion)
      6. 5.5.6. Japan
        1. 5.5.6.1. Japan Green Tea Market, 2016 – 2026 (USD Billion)
      7. 5.5.7. India
        1. 5.5.7.1. India Green Tea Market, 2016 – 2026 (USD Billion)
      8. 5.5.8. South Korea
        1. 5.5.8.1. South Korea Green Tea Market, 2016 – 2026 (USD Billion)
      9. 5.5.9. South-East Asia
        1. 5.5.9.1. South-East Asia Green Tea Market, 2016 – 2026 (USD Billion)
      10. 5.5.10. Rest of Asia Pacific
        1. 5.5.10.1. Rest of Asia Pacific Green Tea Market, 2016 – 2026 (USD Billion)
    6. 5.6. Latin America
      1. 5.6.1. Latin America Green Tea Market, 2016 – 2026 (USD Billion)
        1. 5.6.1.1. Latin America Green Tea Market, by Country, 2016 - 2026 (USD Billion)
      2. 5.6.2. Latin America Green Tea Market, by Form, 2016 – 2026
        1. 5.6.2.1. Latin America Green Tea Market, by Form, 2016 – 2026 (USD Billion)
      3. 5.6.3. Latin America Green Tea Market, by Flavour, 2016 – 2026
        1. 5.6.3.1. Latin America Green Tea Market, by Flavour, 2016 – 2026 (USD Billion)
      4. 5.6.4. Latin America Green Tea Market, by Distribution Channel, 2016 – 2026
        1. 5.6.4.1. Latin America Green Tea Market, by Distribution Channel, 2016 – 2026 (USD Billion)
      5. 5.6.5. Brazil
        1. 5.6.5.1. Brazil Green Tea Market, 2016 – 2026 (USD Billion)
      6. 5.6.6. Mexico
        1. 5.6.6.1. Mexico Green Tea Market, 2016 – 2026 (USD Billion)
      7. 5.6.7. Rest of Latin America
        1. 5.6.7.1. Rest of Latin America Green Tea Market, 2016 – 2026 (USD Billion)
    7. 5.7. The Middle-East and Africa
      1. 5.7.1. The Middle-East and Africa Green Tea Market, 2016 – 2026 (USD Billion)
        1. 5.7.1.1. The Middle-East and Africa Green Tea Market, by Country, 2016 - 2026 (USD Billion)
      2. 5.7.2. The Middle-East and Africa Green Tea Market, by Form, 2016 – 2026
        1. 5.7.2.1. The Middle-East and Africa Green Tea Market, by Form, 2016 – 2026 (USD Billion)
      3. 5.7.3. The Middle-East and Africa Green Tea Market, by Flavour, 2016 – 2026
        1. 5.7.3.1. The Middle-East and Africa Green Tea Market, by Flavour, 2016 – 2026 (USD Billion)
      4. 5.7.4. The Middle-East and Africa Green Tea Market, by Distribution Channel, 2016 – 2026
        1. 5.7.4.1. The Middle-East and Africa Green Tea Market, by Distribution Channel, 2016 – 2026 (USD Billion)
      5. 5.7.5. GCC Countries
        1. 5.7.5.1. GCC Countries Green Tea Market, 2016 – 2026 (USD Billion)
      6. 5.7.6. South Africa
        1. 5.7.6.1. South Africa Green Tea Market, 2016 – 2026 (USD Billion)
      7. 5.7.7. Rest of Middle-East Africa
        1. 5.7.7.1. Rest of Middle-East Africa Green Tea Market, 2016 – 2026 (USD Billion)
  6. Chapter 6 Green Tea Market – Competitive Landscape
    1. 6.1. Competitor Market Share – Revenue
    2. 6.2. Market Concentration Rate Analysis, Top 3 and Top 5 Players
    3. 6.3. Strategic Developments
      1. 6.3.1. Acquisitions and Mergers
      2. 6.3.2. New Products
      3. 6.3.3. Research & Development Activities
  7. Chapter 7 Company Profiles
    1. 7.1. Associated British Food plc
      1. 7.1.1. Company Overview
      2. 7.1.2. Product/Service Portfolio
      3. 7.1.3. Associated British Food plc Sales, Revenue, and Gross Margin
      4. 7.1.4. Associated British Food plc Revenue and Growth Rate
      5. 7.1.5. Associated British Food plc Market Share
      6. 7.1.6. Recent Initiatives, Funding/VC Activities, and Technological Innovations
    2. 7.2. Unilever plc
      1. 7.2.1. Company Overview
      2. 7.2.2. Product/Service Portfolio
      3. 7.2.3. Unilever plc Sales, Revenue, and Gross Margin
      4. 7.2.4. Unilever plc Revenue and Growth Rate
      5. 7.2.5. Unilever plc Market Share
      6. 7.2.6. Recent Initiatives, Funding/VC Activities, and Technological Innovations
    3. 7.3. Tata Consumer Products
      1. 7.3.1. Company Overview
      2. 7.3.2. Product/Service Portfolio
      3. 7.3.3. Tata Consumer Products Sales, Revenue, and Gross Margin
      4. 7.3.4. Tata Consumer Products Revenue and Growth Rate
      5. 7.3.5. Tata Consumer Products Market Share
      6. 7.3.6. Recent Initiatives, Funding/VC Activities, and Technological Innovations
    4. 7.4. The Bigelow Tea Company
      1. 7.4.1. Company Overview
      2. 7.4.2. Product/Service Portfolio
      3. 7.4.3. The Bigelow Tea Company Sales, Revenue, and Gross Margin
      4. 7.4.4. The Bigelow Tea Company Revenue and Growth Rate
      5. 7.4.5. The Bigelow Tea Company Market Share
      6. 7.4.6. Recent Initiatives, Funding/VC Activities, and Technological Innovations
    5. 7.5. East West Tea Company
      1. 7.5.1. Company Overview
      2. 7.5.2. Product/Service Portfolio
      3. 7.5.3. East West Tea Company Sales, Revenue, and Gross Margin
      4. 7.5.4. East West Tea Company Revenue and Growth Rate
      5. 7.5.5. East West Tea Company Market Share
      6. 7.5.6. Recent Initiatives, Funding/VC Activities, and Technological Innovations
    6. 7.6. Numi Inc
      1. 7.6.1. Company Overview
      2. 7.6.2. Product/Service Portfolio
      3. 7.6.3. Numi Inc Sales, Revenue, and Gross Margin
      4. 7.6.4. Numi Inc Revenue and Growth Rate
      5. 7.6.5. Numi Inc Market Share
      6. 7.6.6. Recent Initiatives, Funding/VC Activities, and Technological Innovations
    7. 7.7. Tazo Tea Company
      1. 7.7.1. Company Overview
      2. 7.7.2. Product/Service Portfolio
      3. 7.7.3. Tazo Tea Company Sales, Revenue, and Gross Margin
      4. 7.7.4. Tazo Tea Company Revenue and Growth Rate
      5. 7.7.5. Tazo Tea Company Market Share
      6. 7.7.6. Recent Initiatives, Funding/VC Activities, and Technological Innovations
    8. 7.8. Shangri La Tea Company
      1. 7.8.1. Company Overview
      2. 7.8.2. Product/Service Portfolio
      3. 7.8.3. Shangri La Tea Company Sales, Revenue, and Gross Margin
      4. 7.8.4. Shangri La Tea Company Revenue and Growth Rate
      5. 7.8.5. Shangri La Tea Company Market Share
      6. 7.8.6. Recent Initiatives, Funding/VC Activities, and Technological Innovations
    9. 7.9. The Republic of Tea Inc.
      1. 7.9.1. Company Overview
      2. 7.9.2. Product/Service Portfolio
      3. 7.9.3. The Republic of Tea Inc. Sales, Revenue, and Gross Margin
      4. 7.9.4. The Republic of Tea Inc. Revenue and Growth Rate
      5. 7.9.5. The Republic of Tea Inc. Market Share
      6. 7.9.6. Recent Initiatives, Funding/VC Activities, and Technological Innovations
    10. 7.10. Keurig Dr. Pepper Inc
      1. 7.10.1. Company Overview
      2. 7.10.2. Product/Service Portfolio
      3. 7.10.3. Keurig Dr. Pepper Inc Sales, Revenue, and Gross Margin
      4. 7.10.4. Keurig Dr. Pepper Inc Revenue and Growth Rate
      5. 7.10.5. Keurig Dr. Pepper Inc Market Share
      6. 7.10.6. Recent Initiatives, Funding/VC Activities, and Technological Innovations
    11. 7.11. Celestial Seasonings
      1. 7.11.1. Company Overview
      2. 7.11.2. Product/Service Portfolio
      3. 7.11.3. Celestial Seasonings Sales, Revenue, and Gross Margin
      4. 7.11.4. Celestial Seasonings Revenue and Growth Rate
      5. 7.11.5. Celestial Seasonings Market Share
      6. 7.11.6. Recent Initiatives, Funding/VC Activities, and Technological Innovations
    12. 7.12. Finlays Beverages Inc
      1. 7.12.1. Company Overview
      2. 7.12.2. Product/Service Portfolio
      3. 7.12.3. Finlays Beverages Inc Sales, Revenue, and Gross Margin
      4. 7.12.4. Finlays Beverages Inc Revenue and Growth Rate
      5. 7.12.5. Finlays Beverages Inc Market Share
      6. 7.12.6. Recent Initiatives, Funding/VC Activities, and Technological Innovations
    13. 7.13. Frontier Natural Products Co-op
      1. 7.13.1. Company Overview
      2. 7.13.2. Product/Service Portfolio
      3. 7.13.3. Frontier Natural Products Co-op Sales, Revenue, and Gross Margin
      4. 7.13.4. Frontier Natural Products Co-op Revenue and Growth Rate
      5. 7.13.5. Frontier Natural Products Co-op Market Share
      6. 7.13.6. Recent Initiatives, Funding/VC Activities, and Technological Innovations
    14. 7.14. AMORE Pacific Corp
      1. 7.14.1. Company Overview
      2. 7.14.2. Product/Service Portfolio
      3. 7.14.3. AMORE Pacific Corp Sales, Revenue, and Gross Margin
      4. 7.14.4. AMORE Pacific Corp Revenue and Growth Rate
      5. 7.14.5. AMORE Pacific Corp Market Share
      6. 7.14.6. Recent Initiatives, Funding/VC Activities, and Technological Innovations
  8. Chapter 8 Green Tea — Industry Analysis
    1. 8.1. Introduction and Taxonomy
    2. 8.2. Green Tea Market – Key Trends
      1. 8.2.1. Market Drivers
      2. 8.2.2. Market Restraints
      3. 8.2.3. Market Opportunities
    3. 8.3. Value Chain Analysis
    4. 8.4. Key Mandates and Regulations
    5. 8.5. Technology Roadmap and Timeline
    6. 8.6. Green Tea Market – Attractiveness Analysis
      1. 8.6.1. By Form
      2. 8.6.2. By Flavour
      3. 8.6.3. By Distribution Channel
      4. 8.6.4. By Region
  9. Chapter 9 Industrial Chain, Sourcing Strategy, and Downstream Buyers
    1. 9.1. Green Tea Industrial Chain Analysis
    2. 9.2. Downstream Buyers
    3. 9.3. Distributors/Traders List
  10. Chapter 10 Marketing Strategy Analysis
    1. 10.1. Marketing Channel
    2. 10.2. Direct Marketing
    3. 10.3. Indirect Marketing
    4. 10.4. Marketing Channel Development Trends
    5. 10.5. Economic/Political Environmental Change
  11. Chapter 11 Report Conclusion & Key Insights
    1. 11.1. Key Insights from Primary Interviews & Surveys Respondents
    2. 11.2. Key Takeaways from Analysts, Consultants, and Industry Leaders
  12. Chapter 12 Research Approach & Methodology
    1. 12.1. Report Description
    2. 12.2. Research Scope
    3. 12.3. Research Methodology
      1. 12.3.1. Secondary Research
      2. 12.3.2. Primary Research
      3. 12.3.3. Statistical Models
        1. 12.3.3.1. Company Share Analysis Model
        2. 12.3.3.2. Revenue Based Modeling
      4. 12.3.4. Research Limitations

      List of Figures

      Fig.1	Product Picture of Green Tea
      Fig.2	Global Green Tea Market, 2016 – 2026 (USD Billion)
      Fig.3	Global Green Tea Market Absolute Revenue Opportunity, 2016 – 2026 (USD Billion)
      Fig.4	Global Green Tea Market Incremental Revenue Opportunity, 2020 – 2026 (USD Billion)
      Fig.5	Global Green Tea Market Share, by Form, 2020 & 2026 (USD Billion)
      Fig.6	Global Tea Bags Green Tea Market, 2016 – 2026 (USD Billion)
      Fig.7	Global Loose Leaves Green Tea Market, 2016 – 2026 (USD Billion)
      Fig.8	Global Loose Powder Green Tea Market, 2016 – 2026 (USD Billion)
      Fig.9	Global Read-to-Drink Green Tea Market, 2016 – 2026 (USD Billion)
      Fig.10	Global Capsules & Tablets Green Tea Market, 2016 – 2026 (USD Billion)
      Fig.11	Global Green Tea Market Share, by Flavour, 2020 & 2026 (USD Billion)
      Fig.12	Global Flavoured  Green Tea Market, 2016 – 2026 (USD Billion)
      Fig.13	Global Unflavoured  Green Tea Market, 2016 – 2026 (USD Billion)
      Fig.14	Global Green Tea Market Share, by Distribution Channel, 2020 & 2026 (USD Billion)
      Fig.15	Global Supermarkets/Hypermarkets Green Tea Market, 2016 – 2026 (USD Billion)
      Fig.16	Global Convenience Stores Green Tea Market, 2016 – 2026 (USD Billion)
      Fig.17	Global Specialty Stores Green Tea Market, 2016 – 2026 (USD Billion)
      Fig.18	Global Online Retail Green Tea Market, 2016 – 2026 (USD Billion)
      Fig.19	Global Green Tea Market Share, by Region, 2020 & 2026 (USD Billion)
      Fig.20	North America Green Tea Market, 2016 – 2026 (USD Billion)
      Fig.21	U.S. Green Tea Market, 2016 – 2026 (USD Billion)
      Fig.22	Canada Green Tea Market, 2016 – 2026 (USD Billion)
      Fig.23	Europe Green Tea Market, 2016 – 2026 (USD Billion)
      Fig.24	Germany Green Tea Market, 2016 – 2026 (USD Billion)
      Fig.25	France Green Tea Market, 2016 – 2026 (USD Billion)
      Fig.26	U.K. Green Tea Market, 2016 – 2026 (USD Billion)
      Fig.27	Italy Green Tea Market, 2016 – 2026 (USD Billion)
      Fig.28	Spain Green Tea Market, 2016 – 2026 (USD Billion)
      Fig.29	Rest of Europe Green Tea Market, 2016 – 2026 (USD Billion)
      Fig.30	Asia Pacific Green Tea Market, 2016 – 2026 (USD Billion)
      Fig.31	China Green Tea Market, 2016 – 2026 (USD Billion)
      Fig.32	Japan Green Tea Market, 2016 – 2026 (USD Billion)
      Fig.33	India Green Tea Market, 2016 – 2026 (USD Billion)
      Fig.34	South  Korea Green Tea Market, 2016 – 2026 (USD Billion)
      Fig.35	South-East Asia Green Tea Market, 2016 – 2026 (USD Billion)
      Fig.36	Rest of Asia Pacific Green Tea Market, 2016 – 2026 (USD Billion)
      Fig.37	Latin America Green Tea Market, 2016 – 2026 (USD Billion)
      Fig.38	Brazil Green Tea Market, 2016 – 2026 (USD Billion)
      Fig.39	Mexico Green Tea Market, 2016 – 2026 (USD Billion)
      Fig.40	Rest of Latin America Green Tea Market, 2016 – 2026 (USD Billion)
      Fig.41	The Middle-East and Africa Green Tea Market, 2016 – 2026 (USD Billion)
      Fig.42	GCC Countries Green Tea Market, 2016 – 2026 (USD Billion)
      Fig.43	South Africa Green Tea Market, 2016 – 2026 (USD Billion)
      Fig.44	Rest of Middle-East Africa Green Tea Market, 2016 – 2026 (USD Billion)
      Fig.45	Competitor Market Share – Revenue
      Fig.46	Associated British Food plc Revenue and Growth Rate
      Fig.47	Associated British Food plc Market Share
      Fig.48	Unilever plc Revenue and Growth Rate
      Fig.49	Unilever plc Market Share
      Fig.50	Tata Consumer Products Revenue and Growth Rate
      Fig.51	Tata Consumer Products Market Share
      Fig.52	The Bigelow Tea Company Revenue and Growth Rate
      Fig.53	The Bigelow Tea Company Market Share
      Fig.54	East West Tea Company Revenue and Growth Rate
      Fig.55	East West Tea Company Market Share
      Fig.56	Numi Inc Revenue and Growth Rate
      Fig.57	Numi Inc Market Share
      Fig.58	Tazo Tea Company Revenue and Growth Rate
      Fig.59	Tazo Tea Company Market Share
      Fig.60	Shangri La Tea Company Revenue and Growth Rate
      Fig.61	Shangri La Tea Company Market Share
      Fig.62	The Republic of Tea Inc. Revenue and Growth Rate
      Fig.63	The Republic of Tea Inc. Market Share
      Fig.64	Keurig Dr. Pepper Inc Revenue and Growth Rate
      Fig.65	Keurig Dr. Pepper Inc Market Share
      Fig.66	Celestial Seasonings Revenue and Growth Rate
      Fig.67	Celestial Seasonings Market Share
      Fig.68	Finlays Beverages Inc Revenue and Growth Rate
      Fig.69	Finlays Beverages Inc Market Share
      Fig.70	Frontier Natural Products Co-op Revenue and Growth Rate
      Fig.71	Frontier Natural Products Co-op Market Share
      Fig.72	AMORE Pacific Corp Revenue and Growth Rate
      Fig.73	AMORE Pacific Corp Market Share
      Fig.74	Market Dynamics
      Fig.75	Global Green Tea – Value Chain Analysis
      Fig.76	Key Mandates and Regulations
      Fig.77	Technology Roadmap and Timeline
      Fig.78	Market Attractiveness Analysis – By Form
      Fig.79	Market Attractiveness Analysis – By Flavour
      Fig.80	Market Attractiveness Analysis – By Distribution Channel
      Fig.81	Market Attractiveness Analysis – By Region
      Fig.82	Green Tea Industrial Chain Analysis
      Fig.83	Market Channels
      Fig.84	Marketing Channel Development Trend
      Fig.85	Growth in World Gross Product, 2008-2018
      

      List of Tables

      	
      Table 1	Global Green Tea Market, 2020 & 2026 (USD Billion)
      Table 2	Global Green Tea Market, by Form, 2016 – 2026 (USD Billion)
      Table 3	Global Green Tea Market, by Flavour, 2016 – 2026 (USD Billion)
      Table 4	Global Green Tea Market, by Distribution Channel, 2016 – 2026 (USD Billion)
      Table 5	Global Green Tea Market, by Region, 2016 – 2026 (USD Billion)
      Table 6	North America Green Tea Market, by Country, 2016 – 2026 (USD Billion)
      Table 7	North America Green Tea Market, by Form, 2016 – 2026 (USD Billion)
      Table 8	North America Green Tea Market, by Flavour, 2016 – 2026 (USD Billion)
      Table 9	North America Green Tea Market, by Distribution Channel, 2016 – 2026 (USD Billion)
      Table 10 Europe Green Tea Market, by Country, 2016 – 2026 (USD Billion)
      Table 11 Europe Green Tea Market, by Form, 2016 – 2026 (USD Billion)
      Table 12 Europe Green Tea Market, by Flavour, 2016 – 2026 (USD Billion)
      Table 13 Europe Green Tea Market, by Distribution Channel, 2016 – 2026 (USD Billion)
      Table 14 Asia Pacific Green Tea Market, by Country, 2016 – 2026 (USD Billion)
      Table 15 Asia Pacific Green Tea Market, by Form, 2016 – 2026 (USD Billion)
      Table 16 Asia Pacific Green Tea Market, by Flavour, 2016 – 2026 (USD Billion)
      Table 17 Asia Pacific Green Tea Market, by Distribution Channel, 2016 – 2026 (USD Billion)
      Table 18 Latin America Green Tea Market, by Country, 2016 – 2026 (USD Billion)
      Table 19 Latin America Green Tea Market, by Form, 2016 – 2026 (USD Billion)
      Table 20 Latin America Green Tea Market, by Flavour, 2016 – 2026 (USD Billion)
      Table 21 Latin America Green Tea Market, by Distribution Channel, 2016 – 2026 (USD Billion)
      Table 22 The Middle-East and Africa Green Tea Market, by Country, 2016 – 2026 (USD Billion)
      Table 23 The Middle-East and Africa Green Tea Market, by Form, 2016 – 2026 (USD Billion)
      Table 24 The Middle-East and Africa Green Tea Market, by Flavour, 2016 – 2026 (USD Billion)
      Table 25 The Middle-East and Africa Green Tea Market, by Distribution Channel, 2016 – 2026 (USD Billion)
      Table 26 Global Green Tea Market - Company Revenue Analysis, 2016 – 2019 (USD Billion)
      Table 27 Global Green Tea Market - Company Revenue Share Analysis, 2016 – 2019 (%)
      Table 28 Acquisitions and Mergers
      Table 29 Market Drivers – Impact Analysis
      Table 30 Market Restraints
      Table 31 Market Opportunities
      Table 32 Major Buyers of Green Tea
      Table 33 Distributors/Traders of Green Tea by Region
      

Industry Major Market Players

  • Associated British Food plc.
  • Unilever plc.
  • Tata Consumer Products
  • The Bigelow Tea Company
  • East West Tea Company
  • Numi Inc.
  • Tazo Tea Company
  • Shangri La Tea Company
  • The Republic of Tea Inc.
  • Keurig Dr. Pepper Inc.
  • Celestial Seasonings
  • Finlays Beverages Inc.
  • Frontier Natural Products Co-op
  • AMORE Pacific Corp