Search Market Research Report

Discover Our Latest Reports
Discover Our Featured Reports
Discover Top Selling Reports

Anesthesia Gas Mixers Market Size, Share Global Analysis Report, 2021 – 2026

report img

Anesthesia Gas Mixers Market: By Technology (Tube Flow Meter and Dual Tube Flow Meter), By System Type (Manual and Electronic), By End-User (Hospitals, Ambulatory Surgical Centers, and Others), And By Region – Global & Regional Industry Perspective, Comprehensive Analysis, and Forecast 2021 – 2026

Industry Insights

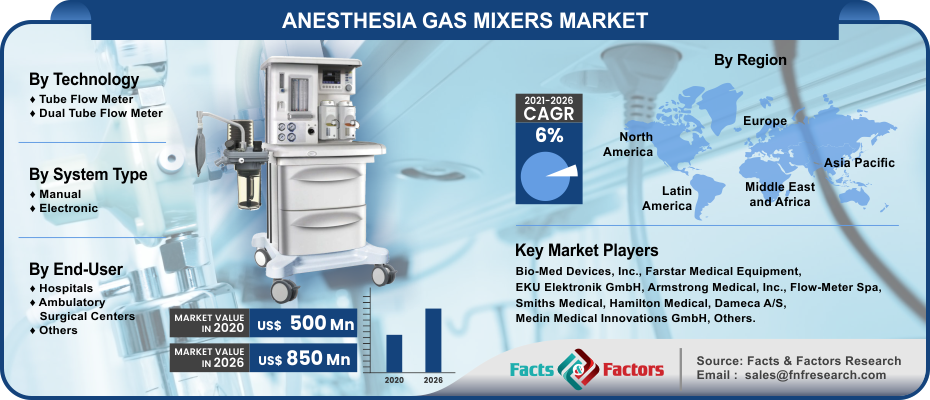
Facts & Factors recently published a report on the global anesthesia gas mixers market. The report encompasses market statistics and analytics. The market value of the anesthesia gas mixers market was witnessed to be USD 500 Million in 2020 and with growth at a CAGR of 6% is projected to reach a value of USD 850 Million by 2026.

logoReport Overview

The anesthetic device comprises a gas mixer, gas source, gas evaporating system, ventilating system, breathing system, gas exhaust system, etc. These complicated systems together form the machinery that can help improvise the management systems. For automated processing, the anesthesia gas mixers regulate gas electronically. The air and oxygen are mixed along with anesthesia gases or nitrous oxide to offer standard doses of gasses to patients.

logoIndustry Growth Factors

The growing presence of chronic illnesses including cancer, diabetes, obesity, etc. is surging the demand for the global anesthesia gas mixers market. Furthermore, the growing ageing population will proliferate the market growth over the forecast period. The demand for general anesthesia during surgical procedures is an advantage for the market over the forecast period.

The preference of inhalation anesthesia among pediatric anesthesiologists owing to the need for easy utilization and safety will drive the anesthesia gas mixers market. However, the global anesthesia gas mixers market growth may be restrained due to the non-functionality at the time of power failure as well as the lack of adoption & awareness regarding the anesthesia gas mixers product.

Anesthesia Gas Mixers Market

To know more about this report | Request Free Sample Copy

logoSegmentation Analysis

The global anesthesia gas mixers market is segmented based on technology, system type, end-user, and region.

Based on technology, the global anesthesia gas mixers market is divided into a tube flow meter and a dual tube flow meter. By system type, the market is categorized into manual and electronic. From all these, the electronic segment holds the highest growth rate in the global anesthesia gas mixers market due to its low cost, accuracy, demand, and computer-controlled valves that help in proportional mixing.

On the basis of end-user, the anesthesia gas mixers market is fragmented into hospitals, ambulatory surgical centers, and others. The hospitals segment exhibits the highest growth due to the rising prevalence of chronic diseases and surgical procedures across the globe. Additionally, the patient preference for anesthesia gas mixers is projected to fuel the market growth.

logoReport Scope

Report Attribute

Details

Market Size in 2020

USD 500 Million

Projected Market Size in 2026

USD 850 Million

CAGR Growth Rate

6% CAGR

Base Year

2020

Forecast Years

2021-2026

Key Market Players

Bio-Med Devices, Inc., Farstar Medical Equipment, EKU Elektronik GmbH, Armstrong Medical, Inc., Flow-Meter Spa, Smiths Medical, Hamilton Medical, Dameca A/S, Medin Medical Innovations GmbH, and Löwenstein Medical GmbH & Co. KG, among others.

Key Segment

By Technology, By System Type, By End-User, and By Region

Major Regions Covered

North America, Europe, Asia Pacific, Latin America, and the Middle East & Africa

Purchase Options

Request customized purchase options to meet your research needs. Explore purchase options

logoRegional Analysis

North America exhibits the highest market revenue share during the forecast period. The growth is likely due to the presence of a number of ambulatory surgery centers and hospitals in this region. The highest market share for the anesthesia gas blenders market is generated owing to the rise in awareness regarding anesthesia, medical tourism, technological development, and growing surgical procedures. Additionally, the high healthcare expenditure, chronic diseases, and safety norms further contribute to the growth of the anesthesia gas mixer market in North America.

logoCompetitive Players

The key players dominating the global anesthesia gas mixers market include :

  • Bio-Med Devices Inc.
  • Farstar Medical Equipment
  • EKU Elektronik GmbH
  • Armstrong Medical Inc.
  • Flow-Meter Spa
  • Smiths Medical
  • Hamilton Medical
  • Dameca A/S
  • Medin Medical Innovations GmbH
  • Löwenstein Medical GmbH & Co. KG
  • among others

logoBy Technology Segment Analysis

  • Tube Flow Meter
  • Dual Tube Flow Meter

logoBy System Type Segment Analysis

  • Manual
  • Electronic

logoBy End-User Segment Analysis

  • Hospitals
  • Ambulatory Surgical Centers
  • Others

logoBy Regional Segment Analysis

  • North America
    • U.S.
    • Canada
  • Europe
    • UK
    • France
    • Germany
    • Italy
    • Spain
    • Rest of Europe
  • Asia Pacific
    • China
    • Japan
    • India
    • South Korea
    • Southeast Asia
    • Rest of Asia Pacific
  • Latin America
    • Brazil
    • Mexico
    • Rest of Latin America
  • Middle East and Africa
    • GCC Countries
    • South Africa
    • Rest of MEA

Table of Content

  1. Chapter 1 Executive Summary
    1. 1.1. Introduction of Anesthesia Gas Mixers
    2. 1.2. Global Anesthesia Gas Mixers Market, 2019 & 2026 (USD Million)
    3. 1.3. Global Anesthesia Gas Mixers Market, 2016 – 2026 (USD Million)
    4. 1.4. Global Anesthesia Gas Mixers Market Absolute Revenue Opportunity, 2016 – 2026 (USD Million)
    5. 1.5. Global Anesthesia Gas Mixers Market Incremental Revenue Opportunity, 2020 – 2026 (USD Million)
  2. Chapter 2 Anesthesia Gas Mixers Market – Technology Analysis
    1. 2.1. Global Anesthesia Gas Mixers Market – Technology Overview
    2. 2.2. Global Anesthesia Gas Mixers Market Share, by Technology, 2019 & 2026 (USD Million)
    3. 2.3. Tube Flow Meter
      1. 2.3.1. Global Tube Flow Meter Anesthesia Gas Mixers Market, 2016 – 2026 (USD Million)
    4. 2.4. Dual Tube Flow Meter
      1. 2.4.1. Global Dual Tube Flow Meter Anesthesia Gas Mixers Market, 2016 – 2026 (USD Million)
  3. Chapter 3 Anesthesia Gas Mixers Market – System Type Analysis
    1. 3.1. Global Anesthesia Gas Mixers Market – System Type Overview
    2. 3.2. Global Anesthesia Gas Mixers Market Share, by System Type, 2019 & 2026 (USD Million)
    3. 3.3. Manual
      1. 3.3.1. Global Manual Anesthesia Gas Mixers Market, 2016 – 2026 (USD Million)
    4. 3.4. Electronic
      1. 3.4.1. Global Electronic Anesthesia Gas Mixers Market, 2016 – 2026 (USD Million)
  4. Chapter 4 Anesthesia Gas Mixers Market – End-User Analysis
    1. 4.1. Global Anesthesia Gas Mixers Market – End-User Overview
    2. 4.2. Global Anesthesia Gas Mixers Market Share, by End-User, 2019 & 2026 (USD Million)
    3. 4.3. Hospitals
      1. 4.3.1. Global Hospitals Anesthesia Gas Mixers Market, 2016 – 2026 (USD Million)
    4. 4.4. Ambulatory Surgical Centers
      1. 4.4.1. Global Ambulatory Surgical Centers Anesthesia Gas Mixers Market, 2016 – 2026 (USD Million)
    5. 4.5. Others
      1. 4.5.1. Global Others Anesthesia Gas Mixers Market, 2016 – 2026 (USD Million)
  5. Chapter 5 Anesthesia Gas Mixers Market – Regional Analysis
    1. 5.1. Global Anesthesia Gas Mixers Market Regional Overview
    2. 5.2. Global Anesthesia Gas Mixers Market Share, by Region, 2019 & 2026 (USD Million)
    3. 5.3. North America
      1. 5.3.1. North America Anesthesia Gas Mixers Market, 2016 – 2026 (USD Million)
        1. 5.3.1.1. North America Anesthesia Gas Mixers Market, by Country, 2016 - 2026 (USD Million)
      2. 5.3.2. North America Anesthesia Gas Mixers Market, by Technology, 2016 – 2026
        1. 5.3.2.1. North America Anesthesia Gas Mixers Market, by Technology, 2016 – 2026 (USD Million)
      3. 5.3.3. North America Anesthesia Gas Mixers Market, by System Type, 2016 – 2026
        1. 5.3.3.1. North America Anesthesia Gas Mixers Market, by System Type, 2016 – 2026 (USD Million)
      4. 5.3.4. North America Anesthesia Gas Mixers Market, by End-User, 2016 – 2026
        1. 5.3.4.1. North America Anesthesia Gas Mixers Market, by End-User, 2016 – 2026 (USD Million)
      5. 5.3.5. U.S.
        1. 5.3.5.1. U.S. Anesthesia Gas Mixers Market, 2016 – 2026 (USD Million)
      6. 5.3.6. Canada
        1. 5.3.6.1. Canada Anesthesia Gas Mixers Market, 2016 – 2026 (USD Million)
    4. 5.4. Europe
      1. 5.4.1. Europe Anesthesia Gas Mixers Market, 2016 – 2026 (USD Million)
        1. 5.4.1.1. Europe Anesthesia Gas Mixers Market, by Country, 2016 - 2026 (USD Million)
      2. 5.4.2. Europe Anesthesia Gas Mixers Market, by Technology, 2016 – 2026
        1. 5.4.2.1. Europe Anesthesia Gas Mixers Market, by Technology, 2016 – 2026 (USD Million)
      3. 5.4.3. Europe Anesthesia Gas Mixers Market, by System Type, 2016 – 2026
        1. 5.4.3.1. Europe Anesthesia Gas Mixers Market, by System Type, 2016 – 2026 (USD Million)
      4. 5.4.4. Europe Anesthesia Gas Mixers Market, by End-User, 2016 – 2026
        1. 5.4.4.1. Europe Anesthesia Gas Mixers Market, by End-User, 2016 – 2026 (USD Million)
      5. 5.4.5. Germany
        1. 5.4.5.1. Germany Anesthesia Gas Mixers Market, 2016 – 2026 (USD Million)
      6. 5.4.6. France
        1. 5.4.6.1. France Anesthesia Gas Mixers Market, 2016 – 2026 (USD Million)
      7. 5.4.7. U.K.
        1. 5.4.7.1. U.K. Anesthesia Gas Mixers Market, 2016 – 2026 (USD Million)
      8. 5.4.8. Italy
        1. 5.4.8.1. Italy Anesthesia Gas Mixers Market, 2016 – 2026 (USD Million)
      9. 5.4.9. Spain
        1. 5.4.9.1. Spain Anesthesia Gas Mixers Market, 2016 – 2026 (USD Million)
      10. 5.4.10. Rest of Europe
        1. 5.4.10.1. Rest of Europe Anesthesia Gas Mixers Market, 2016 – 2026 (USD Million)
    5. 5.5. Asia Pacific
      1. 5.5.1. Asia Pacific Anesthesia Gas Mixers Market, 2016 – 2026 (USD Million)
        1. 5.5.1.1. Asia Pacific Anesthesia Gas Mixers Market, by Country, 2016 - 2026 (USD Million)
      2. 5.5.2. Asia Pacific Anesthesia Gas Mixers Market, by Technology, 2016 – 2026
        1. 5.5.2.1. Asia Pacific Anesthesia Gas Mixers Market, by Technology, 2016 – 2026 (USD Million)
      3. 5.5.3. Asia Pacific Anesthesia Gas Mixers Market, by System Type, 2016 – 2026
        1. 5.5.3.1. Asia Pacific Anesthesia Gas Mixers Market, by System Type, 2016 – 2026 (USD Million)
      4. 5.5.4. Asia Pacific Anesthesia Gas Mixers Market, by End-User, 2016 – 2026
        1. 5.5.4.1. Asia Pacific Anesthesia Gas Mixers Market, by End-User, 2016 – 2026 (USD Million)
      5. 5.5.5. China
        1. 5.5.5.1. China Anesthesia Gas Mixers Market, 2016 – 2026 (USD Million)
      6. 5.5.6. Japan
        1. 5.5.6.1. Japan Anesthesia Gas Mixers Market, 2016 – 2026 (USD Million)
      7. 5.5.7. India
        1. 5.5.7.1. India Anesthesia Gas Mixers Market, 2016 – 2026 (USD Million)
      8. 5.5.8. South Korea
        1. 5.5.8.1. South Korea Anesthesia Gas Mixers Market, 2016 – 2026 (USD Million)
      9. 5.5.9. South-East Asia
        1. 5.5.9.1. South-East Asia Anesthesia Gas Mixers Market, 2016 – 2026 (USD Million)
      10. 5.5.10. Rest of Asia Pacific
        1. 5.5.10.1. Rest of Asia Pacific Anesthesia Gas Mixers Market, 2016 – 2026 (USD Million)
    6. 5.6. Latin America
      1. 5.6.1. Latin America Anesthesia Gas Mixers Market, 2016 – 2026 (USD Million)
        1. 5.6.1.1. Latin America Anesthesia Gas Mixers Market, by Country, 2016 - 2026 (USD Million)
      2. 5.6.2. Latin America Anesthesia Gas Mixers Market, by Technology, 2016 – 2026
        1. 5.6.2.1. Latin America Anesthesia Gas Mixers Market, by Technology, 2016 – 2026 (USD Million)
      3. 5.6.3. Latin America Anesthesia Gas Mixers Market, by System Type, 2016 – 2026
        1. 5.6.3.1. Latin America Anesthesia Gas Mixers Market, by System Type, 2016 – 2026 (USD Million)
      4. 5.6.4. Latin America Anesthesia Gas Mixers Market, by End-User, 2016 – 2026
        1. 5.6.4.1. Latin America Anesthesia Gas Mixers Market, by End-User, 2016 – 2026 (USD Million)
      5. 5.6.5. Brazil
        1. 5.6.5.1. Brazil Anesthesia Gas Mixers Market, 2016 – 2026 (USD Million)
      6. 5.6.6. Mexico
        1. 5.6.6.1. Mexico Anesthesia Gas Mixers Market, 2016 – 2026 (USD Million)
      7. 5.6.7. Rest of Latin America
        1. 5.6.7.1. Rest of Latin America Anesthesia Gas Mixers Market, 2016 – 2026 (USD Million)
    7. 5.7. The Middle-East and Africa
      1. 5.7.1. The Middle-East and Africa Anesthesia Gas Mixers Market, 2016 – 2026 (USD Million)
        1. 5.7.1.1. The Middle-East and Africa Anesthesia Gas Mixers Market, by Country, 2016 - 2026 (USD Million)
      2. 5.7.2. The Middle-East and Africa Anesthesia Gas Mixers Market, by Technology, 2016 – 2026
        1. 5.7.2.1. The Middle-East and Africa Anesthesia Gas Mixers Market, by Technology, 2016 – 2026 (USD Million)
      3. 5.7.3. The Middle-East and Africa Anesthesia Gas Mixers Market, by System Type, 2016 – 2026
        1. 5.7.3.1. The Middle-East and Africa Anesthesia Gas Mixers Market, by System Type, 2016 – 2026 (USD Million)
      4. 5.7.4. The Middle-East and Africa Anesthesia Gas Mixers Market, by End-User, 2016 – 2026
        1. 5.7.4.1. The Middle-East and Africa Anesthesia Gas Mixers Market, by End-User, 2016 – 2026 (USD Million)
      5. 5.7.5. GCC Countries
        1. 5.7.5.1. GCC Countries Anesthesia Gas Mixers Market, 2016 – 2026 (USD Million)
      6. 5.7.6. South Africa
        1. 5.7.6.1. South Africa Anesthesia Gas Mixers Market, 2016 – 2026 (USD Million)
      7. 5.7.7. Rest of Middle-East Africa
        1. 5.7.7.1. Rest of Middle-East Africa Anesthesia Gas Mixers Market, 2016 – 2026 (USD Million)
  6. Chapter 6 Anesthesia Gas Mixers Market – Competitive Landscape
    1. 6.1. Competitor Market Share – Revenue
    2. 6.2. Market Concentration Rate Analysis, Top 3 and Top 5 Players
    3. 6.3. Strategic Developments
      1. 6.3.1. Acquisitions and Mergers
      2. 6.3.2. New Products
      3. 6.3.3. Research & Development Activities
  7. Chapter 7 Company Profiles
    1. 7.1. Bio-Med Devices Inc.
      1. 7.1.1. Company Overview
      2. 7.1.2. Product/Service Portfolio
      3. 7.1.3. Bio-Med Devices Inc. Sales, Revenue, and Gross Margin
      4. 7.1.4. Bio-Med Devices Inc. Revenue and Growth Rate
      5. 7.1.5. Bio-Med Devices Inc. Market Share
      6. 7.1.6. Recent Initiatives, Funding/VC Activities, and Technological Innovations
    2. 7.2. Farstar Medical Equipment
      1. 7.2.1. Company Overview
      2. 7.2.2. Product/Service Portfolio
      3. 7.2.3. Farstar Medical Equipment Sales, Revenue, and Gross Margin
      4. 7.2.4. Farstar Medical Equipment Revenue and Growth Rate
      5. 7.2.5. Farstar Medical Equipment Market Share
      6. 7.2.6. Recent Initiatives, Funding/VC Activities, and Technological Innovations
    3. 7.3. EKU Elektronik GmbH
      1. 7.3.1. Company Overview
      2. 7.3.2. Product/Service Portfolio
      3. 7.3.3. EKU Elektronik GmbH Sales, Revenue, and Gross Margin
      4. 7.3.4. EKU Elektronik GmbH Revenue and Growth Rate
      5. 7.3.5. EKU Elektronik GmbH Market Share
      6. 7.3.6. Recent Initiatives, Funding/VC Activities, and Technological Innovations
    4. 7.4. Armstrong Medical Inc.
      1. 7.4.1. Company Overview
      2. 7.4.2. Product/Service Portfolio
      3. 7.4.3. Armstrong Medical Inc. Sales, Revenue, and Gross Margin
      4. 7.4.4. Armstrong Medical Inc. Revenue and Growth Rate
      5. 7.4.5. Armstrong Medical Inc. Market Share
      6. 7.4.6. Recent Initiatives, Funding/VC Activities, and Technological Innovations
    5. 7.5. Flow-Meter Spa
      1. 7.5.1. Company Overview
      2. 7.5.2. Product/Service Portfolio
      3. 7.5.3. Flow-Meter Spa Sales, Revenue, and Gross Margin
      4. 7.5.4. Flow-Meter Spa Revenue and Growth Rate
      5. 7.5.5. Flow-Meter Spa Market Share
      6. 7.5.6. Recent Initiatives, Funding/VC Activities, and Technological Innovations
    6. 7.6. Smiths Medical
      1. 7.6.1. Company Overview
      2. 7.6.2. Product/Service Portfolio
      3. 7.6.3. Smiths Medical Sales, Revenue, and Gross Margin
      4. 7.6.4. Smiths Medical Revenue and Growth Rate
      5. 7.6.5. Smiths Medical Market Share
      6. 7.6.6. Recent Initiatives, Funding/VC Activities, and Technological Innovations
    7. 7.7. Hamilton Medical
      1. 7.7.1. Company Overview
      2. 7.7.2. Product/Service Portfolio
      3. 7.7.3. Hamilton Medical Sales, Revenue, and Gross Margin
      4. 7.7.4. Hamilton Medical Revenue and Growth Rate
      5. 7.7.5. Hamilton Medical Market Share
      6. 7.7.6. Recent Initiatives, Funding/VC Activities, and Technological Innovations
    8. 7.8. Dameca A/S
      1. 7.8.1. Company Overview
      2. 7.8.2. Product/Service Portfolio
      3. 7.8.3. Dameca A/S Sales, Revenue, and Gross Margin
      4. 7.8.4. Dameca A/S Revenue and Growth Rate
      5. 7.8.5. Dameca A/S Market Share
      6. 7.8.6. Recent Initiatives, Funding/VC Activities, and Technological Innovations
    9. 7.9. Medin Medical Innovations GmbH
      1. 7.9.1. Company Overview
      2. 7.9.2. Product/Service Portfolio
      3. 7.9.3. Medin Medical Innovations GmbH Sales, Revenue, and Gross Margin
      4. 7.9.4. Medin Medical Innovations GmbH Revenue and Growth Rate
      5. 7.9.5. Medin Medical Innovations GmbH Market Share
      6. 7.9.6. Recent Initiatives, Funding/VC Activities, and Technological Innovations
    10. 7.10. Löwenstein Medical GmbH & Co. KG
      1. 7.10.1. Company Overview
      2. 7.10.2. Product/Service Portfolio
      3. 7.10.3. Löwenstein Medical GmbH & Co. KG Sales, Revenue, and Gross Margin
      4. 7.10.4. Löwenstein Medical GmbH & Co. KG Revenue and Growth Rate
      5. 7.10.5. Löwenstein Medical GmbH & Co. KG Market Share
      6. 7.10.6. Recent Initiatives, Funding/VC Activities, and Technological Innovations
  8. Chapter 8 Anesthesia Gas Mixers — Industry Analysis
    1. 8.1. Introduction and Taxonomy
    2. 8.2. Anesthesia Gas Mixers Market – Key Trends
      1. 8.2.1. Market Drivers
      2. 8.2.2. Market Restraints
      3. 8.2.3. Market Opportunities
    3. 8.3. Value Chain Analysis
    4. 8.4. Key Mandates and Regulations
    5. 8.5. Technology Roadmap and Timeline
    6. 8.6. Anesthesia Gas Mixers Market – Attractiveness Analysis
      1. 8.6.1. By Technology
      2. 8.6.2. By System Type
      3. 8.6.3. By End-User
      4. 8.6.4. By Region
  9. Chapter 9 Industrial Chain, Sourcing Strategy, and Downstream Buyers
    1. 9.1. Anesthesia Gas Mixers Industrial Chain Analysis
    2. 9.2. Downstream Buyers
    3. 9.3. Distributors/Traders List
  10. Chapter 10 Marketing Strategy Analysis
    1. 10.1. Marketing Channel
    2. 10.2. Direct Marketing
    3. 10.3. Indirect Marketing
    4. 10.4. Marketing Channel Development Trends
    5. 10.5. Economic/Political Environmental Change
  11. Chapter 11 Report Conclusion & Key Insights
    1. 11.1. Key Insights from Primary Interviews & Surveys Respondents
    2. 11.2. Key Takeaways from Analysts, Consultants, and Industry Leaders
  12. Chapter 12 Research Approach & Methodology
    1. 12.1. Report Description
    2. 12.2. Research Scope
    3. 12.3. Research Methodology
      1. 12.3.1. Secondary Research
      2. 12.3.2. Primary Research
      3. 12.3.3. Statistical Models
        1. 12.3.3.1. Company Share Analysis Model
        2. 12.3.3.2. Revenue Based Modeling
      4. 12.3.4. Research Limitations

      List of Figures

      Fig.1	Product Picture of Anesthesia Gas Mixers
      Fig.2	Global Anesthesia Gas Mixers Market, 2016 – 2026 (USD Million)
      Fig.3	Global Anesthesia Gas Mixers Market Absolute Revenue Opportunity, 2016 – 2026 (USD Million)
      Fig.4	Global Anesthesia Gas Mixers Market Incremental Revenue Opportunity, 2020 – 2026 (USD Million)
      Fig.5	Global Anesthesia Gas Mixers Market Share, by Technology, 2019 & 2026 (USD Million)
      Fig.6	Global Tube Flow Meter Anesthesia Gas Mixers Market, 2016 – 2026 (USD Million)
      Fig.7	Global Dual Tube Flow Meter Anesthesia Gas Mixers Market, 2016 – 2026 (USD Million)
      Fig.8	Global Anesthesia Gas Mixers Market Share, by System Type, 2019 & 2026 (USD Million)
      Fig.9	Global Manual Anesthesia Gas Mixers Market, 2016 – 2026 (USD Million)
      Fig.10	Global Electronic Anesthesia Gas Mixers Market, 2016 – 2026 (USD Million)
      Fig.11	Global Anesthesia Gas Mixers Market Share, by End-User, 2019 & 2026 (USD Million)
      Fig.12	Global Hospitals Anesthesia Gas Mixers Market, 2016 – 2026 (USD Million)
      Fig.13	Global Ambulatory Surgical Centers Anesthesia Gas Mixers Market, 2016 – 2026 (USD Million)
      Fig.14	Global Others Anesthesia Gas Mixers Market, 2016 – 2026 (USD Million)
      Fig.15	Global Anesthesia Gas Mixers Market Share, by Region, 2019 & 2026 (USD Million)
      Fig.16	North America Anesthesia Gas Mixers Market, 2016 – 2026 (USD Million)
      Fig.17	U.S. Anesthesia Gas Mixers Market, 2016 – 2026 (USD Million)
      Fig.18	Canada Anesthesia Gas Mixers Market, 2016 – 2026 (USD Million)
      Fig.19	Europe Anesthesia Gas Mixers Market, 2016 – 2026 (USD Million)
      Fig.20	Germany Anesthesia Gas Mixers Market, 2016 – 2026 (USD Million)
      Fig.21	France Anesthesia Gas Mixers Market, 2016 – 2026 (USD Million)
      Fig.22	U.K. Anesthesia Gas Mixers Market, 2016 – 2026 (USD Million)
      Fig.23	Italy Anesthesia Gas Mixers Market, 2016 – 2026 (USD Million)
      Fig.24	Spain Anesthesia Gas Mixers Market, 2016 – 2026 (USD Million)
      Fig.25	Rest of Europe Anesthesia Gas Mixers Market, 2016 – 2026 (USD Million)
      Fig.26	Asia Pacific Anesthesia Gas Mixers Market, 2016 – 2026 (USD Million)
      Fig.27	China Anesthesia Gas Mixers Market, 2016 – 2026 (USD Million)
      Fig.28	Japan Anesthesia Gas Mixers Market, 2016 – 2026 (USD Million)
      Fig.29	India Anesthesia Gas Mixers Market, 2016 – 2026 (USD Million)
      Fig.30	South  Korea Anesthesia Gas Mixers Market, 2016 – 2026 (USD Million)
      Fig.31	South-East Asia Anesthesia Gas Mixers Market, 2016 – 2026 (USD Million)
      Fig.32	Rest of Asia Pacific Anesthesia Gas Mixers Market, 2016 – 2026 (USD Million)
      Fig.33	Latin America Anesthesia Gas Mixers Market, 2016 – 2026 (USD Million)
      Fig.34	Brazil Anesthesia Gas Mixers Market, 2016 – 2026 (USD Million)
      Fig.35	Mexico Anesthesia Gas Mixers Market, 2016 – 2026 (USD Million)
      Fig.36	Rest of Latin America Anesthesia Gas Mixers Market, 2016 – 2026 (USD Million)
      Fig.37	The Middle-East and Africa Anesthesia Gas Mixers Market, 2016 – 2026 (USD Million)
      Fig.38	GCC Countries Anesthesia Gas Mixers Market, 2016 – 2026 (USD Million)
      Fig.39	South Africa Anesthesia Gas Mixers Market, 2016 – 2026 (USD Million)
      Fig.40	Rest of Middle-East Africa Anesthesia Gas Mixers Market, 2016 – 2026 (USD Million)
      Fig.41	Competitor Market Share – Revenue
      Fig.42	Bio-Med Devices Inc. Revenue and Growth Rate
      Fig.43	Bio-Med Devices Inc. Market Share
      Fig.44	Farstar Medical Equipment Revenue and Growth Rate
      Fig.45	Farstar Medical Equipment Market Share
      Fig.46	EKU Elektronik GmbH Revenue and Growth Rate
      Fig.47	EKU Elektronik GmbH Market Share
      Fig.48	Armstrong Medical Inc. Revenue and Growth Rate
      Fig.49	Armstrong Medical Inc. Market Share
      Fig.50	Flow-Meter Spa Revenue and Growth Rate
      Fig.51	Flow-Meter Spa Market Share
      Fig.52	Smiths Medical Revenue and Growth Rate
      Fig.53	Smiths Medical Market Share
      Fig.54	Hamilton Medical Revenue and Growth Rate
      Fig.55	Hamilton Medical Market Share
      Fig.56	Dameca A/S Revenue and Growth Rate
      Fig.57	Dameca A/S Market Share
      Fig.58	Medin Medical Innovations GmbH Revenue and Growth Rate
      Fig.59	Medin Medical Innovations GmbH Market Share
      Fig.60	Löwenstein Medical GmbH & Co. KG Revenue and Growth Rate
      Fig.61	Löwenstein Medical GmbH & Co. KG Market Share
      Fig.62	Market Dynamics
      Fig.63	Global Anesthesia Gas Mixers – Value Chain Analysis
      Fig.64	Key Mandates and Regulations
      Fig.65	Technology Roadmap and Timeline
      Fig.66	Market Attractiveness Analysis – By Technology
      Fig.67	Market Attractiveness Analysis – By System Type
      Fig.68	Market Attractiveness Analysis – By End-User
      Fig.69	Market Attractiveness Analysis – By Region
      Fig.70	Anesthesia Gas Mixers Industrial Chain Analysis
      Fig.71	Market Channels
      Fig.72	Marketing Channel Development Trend
      Fig.73	Growth in World Gross Product, 2008-2018
      

      List of Tables

      Table 1	Global Anesthesia Gas Mixers Market, 2019 & 2026 (USD Million)
      Table 2	Global Anesthesia Gas Mixers Market, by Technology, 2016 – 2026 (USD Million)
      Table 3	Global Anesthesia Gas Mixers Market, by System Type, 2016 – 2026 (USD Million)
      Table 4	Global Anesthesia Gas Mixers Market, by End-User, 2016 – 2026 (USD Million)
      Table 5	Global Anesthesia Gas Mixers Market, by Region, 2016 – 2026 (USD Million)
      Table 6	North America Anesthesia Gas Mixers Market, by Country, 2016 – 2026 (USD Million)
      Table 7	North America Anesthesia Gas Mixers Market, by Technology, 2016 – 2026 (USD Million)
      Table 8	North America Anesthesia Gas Mixers Market, by System Type, 2016 – 2026 (USD Million)
      Table 9	North America Anesthesia Gas Mixers Market, by End-User, 2016 – 2026 (USD Million)
      Table 10 Europe Anesthesia Gas Mixers Market, by Country, 2016 – 2026 (USD Million)
      Table 11 Europe Anesthesia Gas Mixers Market, by Technology, 2016 – 2026 (USD Million)
      Table 12 Europe Anesthesia Gas Mixers Market, by System Type, 2016 – 2026 (USD Million)
      Table 13 Europe Anesthesia Gas Mixers Market, by End-User, 2016 – 2026 (USD Million)
      Table 14 Asia Pacific Anesthesia Gas Mixers Market, by Country, 2016 – 2026 (USD Million)
      Table 15 Asia Pacific Anesthesia Gas Mixers Market, by Technology, 2016 – 2026 (USD Million)
      Table 16 Asia Pacific Anesthesia Gas Mixers Market, by System Type, 2016 – 2026 (USD Million)
      Table 17 Asia Pacific Anesthesia Gas Mixers Market, by End-User, 2016 – 2026 (USD Million)
      Table 18 Latin America Anesthesia Gas Mixers Market, by Country, 2016 – 2026 (USD Million)
      Table 19 Latin America Anesthesia Gas Mixers Market, by Technology, 2016 – 2026 (USD Million)
      Table 20 Latin America Anesthesia Gas Mixers Market, by System Type, 2016 – 2026 (USD Million)
      Table 21 Latin America Anesthesia Gas Mixers Market, by End-User, 2016 – 2026 (USD Million)
      Table 22 The Middle-East and Africa Anesthesia Gas Mixers Market, by Country, 2016 – 2026 (USD Million)
      Table 23 The Middle-East and Africa Anesthesia Gas Mixers Market, by Technology, 2016 – 2026 (USD Million)
      Table 24 The Middle-East and Africa Anesthesia Gas Mixers Market, by System Type, 2016 – 2026 (USD Million)
      Table 25 The Middle-East and Africa Anesthesia Gas Mixers Market, by End-User, 2016 – 2026 (USD Million)
      Table 26 Global Anesthesia Gas Mixers Market - Company Revenue Analysis, 2016 – 2019 (USD Million)
      Table 27 Global Anesthesia Gas Mixers Market - Company Revenue Share Analysis, 2016 – 2019 (%)
      Table 28 Acquisitions and Mergers
      Table 29 Market Drivers – Impact Analysis
      Table 30 Market Restraints
      Table 31 Market Opportunities
      Table 32 Major Buyers of Anesthesia Gas Mixers
      Table 33 Distributors/Traders of Anesthesia Gas Mixers by Region
      

Industry Major Market Players

  • Bio-Med Devices Inc.
  • Farstar Medical Equipment
  • EKU Elektronik GmbH
  • Armstrong Medical Inc.
  • Flow-Meter Spa
  • Smiths Medical
  • Hamilton Medical
  • Dameca A/S
  • Medin Medical Innovations GmbH
  • Löwenstein Medical GmbH & Co. KG