Search Market Research Report

Discover Our Latest Reports
Discover Our Featured Reports
Discover Top Selling Reports

AI in Agriculture Market Size, Share Global Analysis Report, 2021 – 2026

report img

AI in Agriculture Market By Component (Hardware, and Software) By Technology (Predictive Analytics, Machine Learning & Deep Learning, and Computer Vision), By Application (Drone Analytics, Livestock Monitoring, Precision Farming, Agriculture Robots, and Others): Global Industry Perspective, Comprehensive Analysis and Forecast 2021 – 2026

Industry Insights

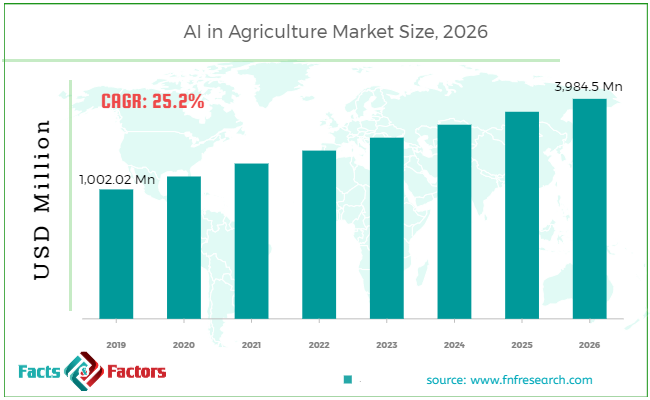
[249+ Pages Report] According to the report published by Facts Factors, the global AI in agriculture market size was worth around USD 1,002.02 million in 2019 and is predicted to grow to around USD 3,984.5 million by 2026 with a compound annual growth rate (CAGR) of roughly 25.2% between 2020 and 2026. The report analyzes the global AI in agriculture market drivers, restraints/challenges, and the effect they have on the demands during the projection period. In addition, the report explores emerging opportunities in the AI in agriculture market.

AI in Agriculture Market Size

To know more about this report | Request Free Sample Copy

The surging penetration of the internet of things (IoT) in the agriculture industry, escalating growth for high crop yield, the emphasis on improved crop management, and the use of drones for spraying the pesticide are all positive factors influencing the sector.

The need for AI in agriculture is being driven by the world's rapidly rising population. The need for a green revolution powered by artificial intelligence, the Internet of Things (IoT), and data analytics is driven by limited arable land supply and the need for increasing agricultural productivity for food security. Predictive and recommendation analytics, recognizing plant diseases, detecting insect infestations, and soil monitoring are all areas where AI-enabled applications can help in the agriculture industry.


logoKey Insights from Primary Research

  • According to the primary CXO’s of the global AI in agriculture market, the market is estimated to witness a substantial growth of nearly 20% over the forecast period.
  • The market was valued at USD 750 million, in 2019 and is expected to be valued over USD 2, 400 million.
  • By technology segmentation, the computer vision category is expected to contribute the largest market share in the global AI in agriculture market.  Computer vision technology helps the farmer to detect nutritional deficiency of the plant and monitor crop health.
  • On the basis of component segment, the software category led the market in 2019 and it is anticipated to grow in the future years attributed to growing use of AI software to improve efficiency of farm, and increasing need for real-time data management systems.
  • By application segment, in 2019, precision farming category headed the market and it is anticipated to grow over the forecast period owing to its increasing need for maximum yield production with the growing population.

logoKey Recommendations from Analysts

  • Our analysts recommend that the North American region continues to dominate the global market for the AI in agriculture owing toincreasing investment in R&D activities and high adoption of the new technologies.
  • On the basis of deployment segment, cloud category is anticipated to boost the market in the future years. Cloud-based platform supports the access from any internet-connected device.
  • Due to the rapid adoption of the agricultural robots, precision farming, advanced technology, the Asia Pacific region is projected to boost the market.
  • Due to robust growth in the use of AI in agriculture, the machine learning category is estimated to enhance the market growth during the period 2020-2026.
  • Owing to the adoption of the new techniques including predictive analysis, machine leaning, and computer vision helps the farmer to analyze real-time data of temperature, weather conditions, and improves crop quality, these factors may create lucrative opportunities in the market.

Farming techniques that use artificial intelligence can help increase growth and quality. As a result, agribusiness companies are embracing artificial intelligence in the form of predictive analytics-based solutions. In the entire food supply chain, AI-based applications and technologies help manage pests, produce healthier crops, track the soil, and enhance agriculture-related tasks. Since it aids in the analysis of farm data, artificial intelligence is increasingly being used in the agriculture industry to increase harvest quality and accuracy.

Growing population, the implementation of data management systems and new, emerging analytics for improving crop productivity, and growing initiatives by global governments promoting the adoption of modern agricultural techniques have been some of the factors contributing to the growth of artificial intelligence in agriculture. The lack of knowledge of high-tech machine learning solutions in farms, on the other hand, is a major factor that could limit artificial intelligence's growth in the agriculture sector. Furthermore, expanding the use of Unmanned Aerial Vehicles (UAVs) over agricultural farms is expected to fuel artificial intelligence's development in the agriculture sector.

Furthermore, agriculture automation aids in the allocation of resources such as fertilizers and water, the determination of the best date for crop sowing, and the detection of weeds, all of which drive demand for artificial intelligence solutions. It also uses the historical long-term weather predictions, output data, commodity pricing estimates, and seed details, among other inputs, to help recommend how many seeds should be sown. The numerous advantages of artificial intelligence-based applications have prompted many tech giants and start-ups to build IoT-enabled devices for large-scale AI application deployment in agriculture.

Among components, the software category is considered to have a great market share. Prediction-based analytics and computer vision are used by AI-based software to increase crop productivity and yield. Furthermore, the software segment's growth is boosted by the growing penetration of predictive analytics-based software. Artificial intelligence solutions assist farmers in determining the best dates for planting crops, detecting crop diseases, monitoring crop yield, and calculating the amount of soil, water, fertilizer, and pesticides required. The benefits of AI-enabled software for proposed application areas such as drone analytics and precision farming are fuelling the AI in agriculture market's software segment's growth.

Over the forecasted era, the precision farming segment is estimated to hold a significant market share. Precision farming is among the most rapidly growing AI-enabled agricultural applications. It aids farmers in reducing costs and efficiently using capital. AI is used in precision farming to capture, translate, and analyze digital data. Farmers can tailor fertilizers or pesticides based on the results of the study and predictions. Agriculture robots powered by artificial intelligence incorporate field sensors, artificial intelligence, and data analytics, and can be used for a wide range of tasks. Since they can weed and hoe, these robots are effective harvesting systems. The agriculture robots segment is driven by the increasing implementation of AI in agriculture and advanced robotics innovations.

Because of the fastest-growing industrial automation industry and acceptance of artificial intelligence technologies, North America held a market share of more than 30% in 2020. North America is marked by increased population buying power, ongoing automation investments, significant IoT investments, and increased government emphasis mostly on AI equipment manufacturing. The presence of various agricultural technology providers implementing artificial intelligence solutions benefits the industry as well.

Over the forecast period, the Asia Pacific market is projected to grow at the fastest pace. Its rise can be due to the growing use of artificial intelligence in agriculture. In the food industry, developing markets such as India and China are leveraging artificial intelligence solutions including remote monitoring technology and predictive analysis. Furthermore, in these economies, the growing demand for smart cities is prompting agribusiness companies to implement AI-based solutions and services.

logoReport Scope

Report Attribute

Details

Market Size in 2020

USD 1,002.02 million

Projected Market Size in 2026

USD 3,984.5 million

CAGR Growth Rate

55.2% CAGR

Base Year

2020

Forecast Years

2021-2026

Key Market Players

AgEagle Aerial Systems Inc., GAMAYA, Deere & Company, Descartes Labs, Inc., ec2ce, Microsoft, IBM Corporation, Granular, Inc., VineView, Tule Technologies Inc., The Climate Corporation, Taranis, Prospera Technologies, PrecisionHawk, and others.

Key Segment

By Component, By Technology, By Application, By Region

Major Regions Covered

North America, Europe, Asia Pacific, Latin America, and the Middle East & Africa

Purchase Options

Request customized purchase options to meet your research needs. Explore purchase options

logoSome of the leading players in the global market include

  • AgEagle Aerial Systems Inc.
  • GAMAYA
  • Deere & Company
  • Descartes Labs Inc.
  • ec2ce
  • Microsoft
  • IBM Corporation
  • Granular Inc.
  • VineView
  • Tule Technologies Inc.
  • The Climate Corporation
  • Taranis
  • Prospera Technologies
  • PrecisionHawk

The global AI in Agriculture market is segmented as follows:

logoBy Component Segment Analysis

  • Hardware
  • Software

logoBy Technology Segment Analysis

  • Predictive Analytics
  • Machine Learning & Deep Learning
  • Computer Vision

logoBy Application Segment Analysis

  • Drone Analytics
  • Livestock Monitoring
  • Precision Farming
  • Agriculture Robots
  • Others

logoBy Regional Segment Analysis

  • North America
    • U.S.
    • Canada
  • Europe
    • UK
    • France
    • Germany
    • Italy
    • Spain
    • Rest of Europe
  • Asia Pacific
    • China
    • Japan
    • India
    • South Korea
    • Southeast Asia
    • Rest of Asia Pacific
  • Latin America
    • Brazil
    • Mexico
    • Rest of Latin America
  • Middle East and Africa
    • GCC Countries
    • South Africa
    • Rest of MEA

Table of Content

  1. Chapter 1 Executive Summary
    1. 1.1. Introduction of AI in Agriculture
    2. 1.2. Global AI in Agriculture Market, 2020 & 2026 (USD Million)
    3. 1.3. Global AI in Agriculture Market, 2016 – 2026 (USD Million)
    4. 1.4. Global AI in Agriculture Market Absolute Revenue Opportunity, 2016 – 2026 (USD Million)
    5. 1.5. Global AI in Agriculture Market Incremental Revenue Opportunity, 2020 – 2026 (USD Million)
  2. Chapter 2 AI in Agriculture Market – Component Analysis
    1. 2.1. Global AI in Agriculture Market – Component Overview
    2. 2.2. Global AI in Agriculture Market Share, by Component, 2020 & 2026 (USD Million)
    3. 2.3. Hardware
      1. 2.3.1. Global Hardware AI in Agriculture Market, 2016 – 2026 (USD Million)
    4. 2.4. Software
      1. 2.4.1. Global Software AI in Agriculture Market, 2016 – 2026 (USD Million)
  3. Chapter 3 AI in Agriculture Market – Technology Analysis
    1. 3.1. Global AI in Agriculture Market – Technology Overview
    2. 3.2. Global AI in Agriculture Market Share, by Technology, 2020 & 2026 (USD Million)
    3. 3.3. Predictive Analytics
      1. 3.3.1. Global Predictive Analytics AI in Agriculture Market, 2016 – 2026 (USD Million)
    4. 3.4. Machine Learning & Deep Learning
      1. 3.4.1. Global Machine Learning & Deep Learning AI in Agriculture Market, 2016 – 2026 (USD Million)
    5. 3.5. Computer Vision
      1. 3.5.1. Global Computer Vision AI in Agriculture Market, 2016 – 2026 (USD Million)
  4. Chapter 4 AI in Agriculture Market – Application Analysis
    1. 4.1. Global AI in Agriculture Market – Application Overview
    2. 4.2. Global AI in Agriculture Market Share, by Application, 2020 & 2026 (USD Million)
    3. 4.3. Drone Analytics
      1. 4.3.1. Global Drone Analytics AI in Agriculture Market, 2016 – 2026 (USD Million)
    4. 4.4. Livestock Monitoring
      1. 4.4.1. Global Livestock Monitoring AI in Agriculture Market, 2016 – 2026 (USD Million)
    5. 4.5. Precision Farming
      1. 4.5.1. Global Precision Farming AI in Agriculture Market, 2016 – 2026 (USD Million)
    6. 4.6. Agriculture Robots
      1. 4.6.1. Global Agriculture Robots AI in Agriculture Market, 2016 – 2026 (USD Million)
    7. 4.7. Others
      1. 4.7.1. Global Others AI in Agriculture Market, 2016 – 2026 (USD Million)
  5. Chapter 5 AI in Agriculture Market – Regional Analysis
    1. 5.1. Global AI in Agriculture Market Regional Overview
    2. 5.2. Global AI in Agriculture Market Share, by Region, 2020 & 2026 (USD Million)
    3. 5.3. North America
      1. 5.3.1. North America AI in Agriculture Market, 2016 – 2026 (USD Million)
        1. 5.3.1.1. North America AI in Agriculture Market, by Country, 2016 - 2026 (USD Million)
      2. 5.3.2. North America AI in Agriculture Market, by Component, 2016 – 2026
        1. 5.3.2.1. North America AI in Agriculture Market, by Component, 2016 – 2026 (USD Million)
      3. 5.3.3. North America AI in Agriculture Market, by Technology, 2016 – 2026
        1. 5.3.3.1. North America AI in Agriculture Market, by Technology, 2016 – 2026 (USD Million)
      4. 5.3.4. North America AI in Agriculture Market, by Application, 2016 – 2026
        1. 5.3.4.1. North America AI in Agriculture Market, by Application, 2016 – 2026 (USD Million)
      5. 5.3.5. U.S.
        1. 5.3.5.1. U.S. AI in Agriculture Market, 2016 – 2026 (USD Million)
      6. 5.3.6. Canada
        1. 5.3.6.1. Canada AI in Agriculture Market, 2016 – 2026 (USD Million)
    4. 5.4. Europe
      1. 5.4.1. Europe AI in Agriculture Market, 2016 – 2026 (USD Million)
        1. 5.4.1.1. Europe AI in Agriculture Market, by Country, 2016 - 2026 (USD Million)
      2. 5.4.2. Europe AI in Agriculture Market, by Component, 2016 – 2026
        1. 5.4.2.1. Europe AI in Agriculture Market, by Component, 2016 – 2026 (USD Million)
      3. 5.4.3. Europe AI in Agriculture Market, by Technology, 2016 – 2026
        1. 5.4.3.1. Europe AI in Agriculture Market, by Technology, 2016 – 2026 (USD Million)
      4. 5.4.4. Europe AI in Agriculture Market, by Application, 2016 – 2026
        1. 5.4.4.1. Europe AI in Agriculture Market, by Application, 2016 – 2026 (USD Million)
      5. 5.4.5. Germany
        1. 5.4.5.1. Germany AI in Agriculture Market, 2016 – 2026 (USD Million)
      6. 5.4.6. France
        1. 5.4.6.1. France AI in Agriculture Market, 2016 – 2026 (USD Million)
      7. 5.4.7. U.K.
        1. 5.4.7.1. U.K. AI in Agriculture Market, 2016 – 2026 (USD Million)
      8. 5.4.8. Italy
        1. 5.4.8.1. Italy AI in Agriculture Market, 2016 – 2026 (USD Million)
      9. 5.4.9. Spain
        1. 5.4.9.1. Spain AI in Agriculture Market, 2016 – 2026 (USD Million)
      10. 5.4.10. Rest of Europe
        1. 5.4.10.1. Rest of Europe AI in Agriculture Market, 2016 – 2026 (USD Million)
    5. 5.5. Asia Pacific
      1. 5.5.1. Asia Pacific AI in Agriculture Market, 2016 – 2026 (USD Million)
        1. 5.5.1.1. Asia Pacific AI in Agriculture Market, by Country, 2016 - 2026 (USD Million)
      2. 5.5.2. Asia Pacific AI in Agriculture Market, by Component, 2016 – 2026
        1. 5.5.2.1. Asia Pacific AI in Agriculture Market, by Component, 2016 – 2026 (USD Million)
      3. 5.5.3. Asia Pacific AI in Agriculture Market, by Technology, 2016 – 2026
        1. 5.5.3.1. Asia Pacific AI in Agriculture Market, by Technology, 2016 – 2026 (USD Million)
      4. 5.5.4. Asia Pacific AI in Agriculture Market, by Application, 2016 – 2026
        1. 5.5.4.1. Asia Pacific AI in Agriculture Market, by Application, 2016 – 2026 (USD Million)
      5. 5.5.5. China
        1. 5.5.5.1. China AI in Agriculture Market, 2016 – 2026 (USD Million)
      6. 5.5.6. Japan
        1. 5.5.6.1. Japan AI in Agriculture Market, 2016 – 2026 (USD Million)
      7. 5.5.7. India
        1. 5.5.7.1. India AI in Agriculture Market, 2016 – 2026 (USD Million)
      8. 5.5.8. South Korea
        1. 5.5.8.1. South Korea AI in Agriculture Market, 2016 – 2026 (USD Million)
      9. 5.5.9. South-East Asia
        1. 5.5.9.1. South-East Asia AI in Agriculture Market, 2016 – 2026 (USD Million)
      10. 5.5.10. Rest of Asia Pacific
        1. 5.5.10.1. Rest of Asia Pacific AI in Agriculture Market, 2016 – 2026 (USD Million)
    6. 5.6. Latin America
      1. 5.6.1. Latin America AI in Agriculture Market, 2016 – 2026 (USD Million)
        1. 5.6.1.1. Latin America AI in Agriculture Market, by Country, 2016 - 2026 (USD Million)
      2. 5.6.2. Latin America AI in Agriculture Market, by Component, 2016 – 2026
        1. 5.6.2.1. Latin America AI in Agriculture Market, by Component, 2016 – 2026 (USD Million)
      3. 5.6.3. Latin America AI in Agriculture Market, by Technology, 2016 – 2026
        1. 5.6.3.1. Latin America AI in Agriculture Market, by Technology, 2016 – 2026 (USD Million)
      4. 5.6.4. Latin America AI in Agriculture Market, by Application, 2016 – 2026
        1. 5.6.4.1. Latin America AI in Agriculture Market, by Application, 2016 – 2026 (USD Million)
      5. 5.6.5. Brazil
        1. 5.6.5.1. Brazil AI in Agriculture Market, 2016 – 2026 (USD Million)
      6. 5.6.6. Mexico
        1. 5.6.6.1. Mexico AI in Agriculture Market, 2016 – 2026 (USD Million)
      7. 5.6.7. Rest of Latin America
        1. 5.6.7.1. Rest of Latin America AI in Agriculture Market, 2016 – 2026 (USD Million)
    7. 5.7. The Middle-East and Africa
      1. 5.7.1. The Middle-East and Africa AI in Agriculture Market, 2016 – 2026 (USD Million)
        1. 5.7.1.1. The Middle-East and Africa AI in Agriculture Market, by Country, 2016 - 2026 (USD Million)
      2. 5.7.2. The Middle-East and Africa AI in Agriculture Market, by Component, 2016 – 2026
        1. 5.7.2.1. The Middle-East and Africa AI in Agriculture Market, by Component, 2016 – 2026 (USD Million)
      3. 5.7.3. The Middle-East and Africa AI in Agriculture Market, by Technology, 2016 – 2026
        1. 5.7.3.1. The Middle-East and Africa AI in Agriculture Market, by Technology, 2016 – 2026 (USD Million)
      4. 5.7.4. The Middle-East and Africa AI in Agriculture Market, by Application, 2016 – 2026
        1. 5.7.4.1. The Middle-East and Africa AI in Agriculture Market, by Application, 2016 – 2026 (USD Million)
      5. 5.7.5. GCC Countries
        1. 5.7.5.1. GCC Countries AI in Agriculture Market, 2016 – 2026 (USD Million)
      6. 5.7.6. South Africa
        1. 5.7.6.1. South Africa AI in Agriculture Market, 2016 – 2026 (USD Million)
      7. 5.7.7. Rest of Middle-East Africa
        1. 5.7.7.1. Rest of Middle-East Africa AI in Agriculture Market, 2016 – 2026 (USD Million)
  6. Chapter 6 AI in Agriculture Market – Competitive Landscape
    1. 6.1. Competitor Market Share – Revenue
    2. 6.2. Market Concentration Rate Analysis, Top 3 and Top 5 Players
    3. 6.3. Strategic Developments
      1. 6.3.1. Acquisitions and Mergers
      2. 6.3.2. New Products
      3. 6.3.3. Research & Development Activities
  7. Chapter 7 Company Profiles
    1. 7.1. AgEagle Aerial Systems Inc.
      1. 7.1.1. Company Overview
      2. 7.1.2. Product/Service Portfolio
      3. 7.1.3. AgEagle Aerial Systems Inc. Sales, Revenue, and Gross Margin
      4. 7.1.4. AgEagle Aerial Systems Inc. Revenue and Growth Rate
      5. 7.1.5. AgEagle Aerial Systems Inc. Market Share
      6. 7.1.6. Recent Initiatives, Funding/VC Activities, and Technological Innovations
    2. 7.2. GAMAYA
      1. 7.2.1. Company Overview
      2. 7.2.2. Product/Service Portfolio
      3. 7.2.3. GAMAYA Sales, Revenue, and Gross Margin
      4. 7.2.4. GAMAYA Revenue and Growth Rate
      5. 7.2.5. GAMAYA Market Share
      6. 7.2.6. Recent Initiatives, Funding/VC Activities, and Technological Innovations
    3. 7.3. Deere & Company
      1. 7.3.1. Company Overview
      2. 7.3.2. Product/Service Portfolio
      3. 7.3.3. Deere & Company Sales, Revenue, and Gross Margin
      4. 7.3.4. Deere & Company Revenue and Growth Rate
      5. 7.3.5. Deere & Company Market Share
      6. 7.3.6. Recent Initiatives, Funding/VC Activities, and Technological Innovations
    4. 7.4. Descartes Labs
      1. 7.4.1. Company Overview
      2. 7.4.2. Product/Service Portfolio
      3. 7.4.3. Descartes Labs Sales, Revenue, and Gross Margin
      4. 7.4.4. Descartes Labs Revenue and Growth Rate
      5. 7.4.5. Descartes Labs Market Share
      6. 7.4.6. Recent Initiatives, Funding/VC Activities, and Technological Innovations
      7. 7.5. Inc.
      8. 7.5.1. Company Overview
      9. 7.5.2. Product/Service Portfolio
        1. 7.5.3. Inc. Sales, Revenue, and Gross Margin
        2. 7.5.4. Inc. Revenue and Growth Rate
        3. 7.5.5. Inc. Market Share
      10. 7.5.6. Recent Initiatives, Funding/VC Activities, and Technological Innovations
    5. 7.6. ec2ce
      1. 7.6.1. Company Overview
      2. 7.6.2. Product/Service Portfolio
      3. 7.6.3. ec2ce Sales, Revenue, and Gross Margin
      4. 7.6.4. ec2ce Revenue and Growth Rate
      5. 7.6.5. ec2ce Market Share
      6. 7.6.6. Recent Initiatives, Funding/VC Activities, and Technological Innovations
    6. 7.7. Microsoft
      1. 7.7.1. Company Overview
      2. 7.7.2. Product/Service Portfolio
      3. 7.7.3. Microsoft Sales, Revenue, and Gross Margin
      4. 7.7.4. Microsoft Revenue and Growth Rate
      5. 7.7.5. Microsoft Market Share
      6. 7.7.6. Recent Initiatives, Funding/VC Activities, and Technological Innovations
    7. 7.8. IBM Corporation
      1. 7.8.1. Company Overview
      2. 7.8.2. Product/Service Portfolio
      3. 7.8.3. IBM Corporation Sales, Revenue, and Gross Margin
      4. 7.8.4. IBM Corporation Revenue and Growth Rate
      5. 7.8.5. IBM Corporation Market Share
      6. 7.8.6. Recent Initiatives, Funding/VC Activities, and Technological Innovations
    8. 7.9. Granular
      1. 7.9.1. Company Overview
      2. 7.9.2. Product/Service Portfolio
      3. 7.9.3. Granular Sales, Revenue, and Gross Margin
      4. 7.9.4. Granular Revenue and Growth Rate
      5. 7.9.5. Granular Market Share
      6. 7.9.6. Recent Initiatives, Funding/VC Activities, and Technological Innovations
    9. 7.10. aWhere Inc.
      1. 7.10.1. Company Overview
      2. 7.10.2. Product/Service Portfolio
        1. 7.10.3. aWhereInc. Sales, Revenue, and Gross Margin
      3. 7.10.4. aWhere Inc. Revenue and Growth Rate
      4. 7.10.5. aWhere Inc. Market Share
      5. 7.10.6. Recent Initiatives, Funding/VC Activities, and Technological Innovations
    10. 7.11. VineView
      1. 7.11.1. Company Overview
      2. 7.11.2. Product/Service Portfolio
      3. 7.11.3. VineView Sales, Revenue, and Gross Margin
      4. 7.11.4. VineView Revenue and Growth Rate
      5. 7.11.5. VineView Market Share
      6. 7.11.6. Recent Initiatives, Funding/VC Activities, and Technological Innovations
    11. 7.12. Tule Technologies Inc.
      1. 7.12.1. Company Overview
      2. 7.12.2. Product/Service Portfolio
      3. 7.12.3. Tule Technologies Inc. Sales, Revenue, and Gross Margin
      4. 7.12.4. Tule Technologies Inc. Revenue and Growth Rate
      5. 7.12.5. Tule Technologies Inc. Market Share
      6. 7.12.6. Recent Initiatives, Funding/VC Activities, and Technological Innovations
    12. 7.13. The Climate Corporation
      1. 7.13.1. Company Overview
      2. 7.13.2. Product/Service Portfolio
      3. 7.13.3. The Climate Corporation Sales, Revenue, and Gross Margin
      4. 7.13.4. The Climate Corporation Revenue and Growth Rate
      5. 7.13.5. The Climate Corporation Market Share
      6. 7.13.6. Recent Initiatives, Funding/VC Activities, and Technological Innovations
    13. 7.14. Taranis
      1. 7.14.1. Company Overview
      2. 7.14.2. Product/Service Portfolio
      3. 7.14.3. Taranis Sales, Revenue, and Gross Margin
      4. 7.14.4. Taranis Revenue and Growth Rate
      5. 7.14.5. Taranis Market Share
      6. 7.14.6. Recent Initiatives, Funding/VC Activities, and Technological Innovations
    14. 7.15. Prospera Technologies
      1. 7.15.1. Company Overview
      2. 7.15.2. Product/Service Portfolio
      3. 7.15.3. Prospera Technologies Sales, Revenue, and Gross Margin
      4. 7.15.4. Prospera Technologies Revenue and Growth Rate
      5. 7.15.5. Prospera Technologies Market Share
      6. 7.15.6. Recent Initiatives, Funding/VC Activities, and Technological Innovations
    15. 7.16. PrecisionHawk
      1. 7.16.1. Company Overview
      2. 7.16.2. Product/Service Portfolio
      3. 7.16.3. PrecisionHawk Sales, Revenue, and Gross Margin
      4. 7.16.4. PrecisionHawk Revenue and Growth Rate
      5. 7.16.5. PrecisionHawk Market Share
      6. 7.16.6. Recent Initiatives, Funding/VC Activities, and Technological Innovations
  8. Chapter 8 AI in Agriculture — Industry Analysis
    1. 8.1. Introduction and Taxonomy
    2. 8.2. AI in Agriculture Market – Key Trends
      1. 8.2.1. Market Drivers
      2. 8.2.2. Market Restraints
      3. 8.2.3. Market Opportunities
    3. 8.3. Value Chain Analysis
    4. 8.4. Key Mandates and Regulations
    5. 8.5. Technology Roadmap and Timeline
    6. 8.6. AI in Agriculture Market – Attractiveness Analysis
      1. 8.6.1. By Component
      2. 8.6.2. By Technology
      3. 8.6.3. By Application
      4. 8.6.4. By Region
  9. Chapter 9 Industrial Chain, Sourcing Strategy, and Downstream Buyers
    1. 9.1. AI in Agriculture Industrial Chain Analysis
    2. 9.2. Downstream Buyers
    3. 9.3. Distributors/Traders List
  10. Chapter 10 Marketing Strategy Analysis
    1. 10.1. Marketing Channel
    2. 10.2. Direct Marketing
    3. 10.3. Indirect Marketing
    4. 10.4. Marketing Channel Development Trends
    5. 10.5. Economic/Political Environmental Change
  11. Chapter 11 Report Conclusion & Key Insights
    1. 11.1. Key Insights from Primary Interviews & Survey’s Respondents
    2. 11.2. Key Takeaways from Analysts, Consultants, and Industry Leaders
  12. Chapter 12 Research Approach & Methodology
    1. 12.1. Report Description
    2. 12.2. Research Scope
    3. 12.3. Research Methodology
      1. 12.3.1. Secondary Research
      2. 12.3.2. Primary Research
      3. 12.3.3. Statistical Models
        1. 12.3.3.1. Company Share Analysis Model
        2. 12.3.3.2. Revenue Based Modeling
      4. 12.3.4. Research Limitations

      List of Figures

      Fig.1	Product Picture of AI in Agriculture
      Fig.2	Global AI in Agriculture Market, 2016 – 2026 (USD Million)
      Fig.3	Global AI in Agriculture Market Absolute Revenue Opportunity, 2016 – 2026 (USD Million)
      Fig.4	Global AI in Agriculture Market Incremental Revenue Opportunity, 2020 – 2026 (USD Million)
      Fig.5	Global AI in Agriculture Market Share, by Component, 2020 & 2026 (USD Million)
      Fig.6	Global Hardware AI in Agriculture Market, 2016 – 2026 (USD Million)
      Fig.7	Global Software AI in Agriculture Market, 2016 – 2026 (USD Million)
      Fig.8	Global AI in Agriculture Market Share, by Technology, 2020 & 2026 (USD Million)
      Fig.9	Global Predictive Analytics AI in Agriculture Market, 2016 – 2026 (USD Million)
      Fig.10	Global Machine Learning & Deep Learning AI in Agriculture Market, 2016 – 2026 (USD Million)
      Fig.11	Global Computer Vision AI in Agriculture Market, 2016 – 2026 (USD Million)
      Fig.12	Global AI in Agriculture Market Share, by Application, 2020 & 2026 (USD Million)
      Fig.13	Global Drone Analytics AI in Agriculture Market, 2016 – 2026 (USD Million)
      Fig.14	Global Livestock Monitoring AI in Agriculture Market, 2016 – 2026 (USD Million)
      Fig.15	Global Precision Farming AI in Agriculture Market, 2016 – 2026 (USD Million)
      Fig.16	Global Agriculture Robots AI in Agriculture Market, 2016 – 2026 (USD Million)
      Fig.17	Global Others AI in Agriculture Market, 2016 – 2026 (USD Million)
      Fig.18	Global AI in Agriculture Market Share, by Region, 2020 & 2026 (USD Million)
      Fig.19	North America AI in Agriculture Market, 2016 – 2026 (USD Million)
      Fig.20	U.S. AI in Agriculture Market, 2016 – 2026 (USD Million)
      Fig.21	Canada AI in Agriculture Market, 2016 – 2026 (USD Million)
      Fig.22	Europe AI in Agriculture Market, 2016 – 2026 (USD Million)
      Fig.23	Germany AI in Agriculture Market, 2016 – 2026 (USD Million)
      Fig.24	France AI in Agriculture Market, 2016 – 2026 (USD Million)
      Fig.25	U.K. AI in Agriculture Market, 2016 – 2026 (USD Million)
      Fig.26	Italy AI in Agriculture Market, 2016 – 2026 (USD Million)
      Fig.27	Spain AI in Agriculture Market, 2016 – 2026 (USD Million)
      Fig.28	Rest of Europe AI in Agriculture Market, 2016 – 2026 (USD Million)
      Fig.29	Asia Pacific AI in Agriculture Market, 2016 – 2026 (USD Million)
      Fig.30	China AI in Agriculture Market, 2016 – 2026 (USD Million)
      Fig.31	Japan AI in Agriculture Market, 2016 – 2026 (USD Million)
      Fig.32	India AI in Agriculture Market, 2016 – 2026 (USD Million)
      Fig.33	South  Korea AI in Agriculture Market, 2016 – 2026 (USD Million)
      Fig.34	South-East Asia AI in Agriculture Market, 2016 – 2026 (USD Million)
      Fig.35	Rest of Asia Pacific AI in Agriculture Market, 2016 – 2026 (USD Million)
      Fig.36	Latin America AI in Agriculture Market, 2016 – 2026 (USD Million)
      Fig.37	Brazil AI in Agriculture Market, 2016 – 2026 (USD Million)
      Fig.38	Mexico AI in Agriculture Market, 2016 – 2026 (USD Million)
      Fig.39	Rest of Latin America AI in Agriculture Market, 2016 – 2026 (USD Million)
      Fig.40	The Middle-East and Africa AI in Agriculture Market, 2016 – 2026 (USD Million)
      Fig.41	GCC Countries AI in Agriculture Market, 2016 – 2026 (USD Million)
      Fig.42	South Africa AI in Agriculture Market, 2016 – 2026 (USD Million)
      Fig.43	Rest of Middle-East Africa AI in Agriculture Market, 2016 – 2026 (USD Million)
      Fig.44	Competitor Market Share – Revenue
      Fig.45	AgEagle Aerial Systems Inc. Revenue and Growth Rate
      Fig.46	AgEagle Aerial Systems Inc. Market Share
      Fig.47	GAMAYA Revenue and Growth Rate
      Fig.48	GAMAYA Market Share
      Fig.49	Deere & Company Revenue and Growth Rate
      Fig.50	Deere & Company Market Share
      Fig.51	Descartes Labs Revenue and Growth Rate
      Fig.52	Descartes Labs Market Share
      Fig.53	Inc. Revenue and Growth Rate
      Fig.54	Inc. Market Share
      Fig.55	ec2ce Revenue and Growth Rate
      Fig.56	ec2ce Market Share
      Fig.57	Microsoft Revenue and Growth Rate
      Fig.58	Microsoft Market Share
      Fig.59	IBM Corporation Revenue and Growth Rate
      Fig.60	IBM Corporation Market Share
      Fig.61	Granular Revenue and Growth Rate
      Fig.62	Granular Market Share
      Fig.63	Inc. Revenue and Growth Rate
      Fig.64	Inc. Market Share
      Fig.65	VineView Revenue and Growth Rate
      Fig.66	VineView Market Share
      Fig.67	Tule Technologies Inc. Revenue and Growth Rate
      Fig.68	Tule Technologies Inc. Market Share
      Fig.69	The Climate Corporation Revenue and Growth Rate
      Fig.70	The Climate Corporation Market Share
      Fig.71	Taranis Revenue and Growth Rate
      Fig.72	Taranis Market Share
      Fig.73	Prospera Technologies Revenue and Growth Rate
      Fig.74	Prospera Technologies Market Share
      Fig.75	PrecisionHawk Revenue and Growth Rate
      Fig.76	PrecisionHawk Market Share
      Fig.77	Market Dynamics
      Fig.78	Global AI in Agriculture – Value Chain Analysis
      Fig.79	Key Mandates and Regulations
      Fig.80	Technology Roadmap and Timeline
      Fig.81	Market Attractiveness Analysis – By Component
      Fig.82	Market Attractiveness Analysis – By Technology
      Fig.83	Market Attractiveness Analysis – By Application
      Fig.84	Market Attractiveness Analysis – By Region
      Fig.85	AI in Agriculture Industrial Chain Analysis
      Fig.86	Market Channels
      Fig.87	Marketing Channel Development Trend
      Fig.88	Growth in World Gross Product, 2008-2018
      

      List of Tables

      Table 1	Global AI in Agriculture Market, 2020 & 2026 (USD Million)
      Table 2	Global AI in Agriculture Market, by Component, 2016 – 2026 (USD Million)
      Table 3	Global AI in Agriculture Market, by Technology, 2016 – 2026 (USD Million)
      Table 4	Global AI in Agriculture Market, by Application, 2016 – 2026 (USD Million)
      Table 5	Global AI in Agriculture Market, by Region, 2016 – 2026 (USD Million)
      Table 6	North America AI in Agriculture Market, by Country, 2016 – 2026 (USD Million)
      Table 7	North America AI in Agriculture Market, by Component, 2016 – 2026 (USD Million)
      Table 8	North America AI in Agriculture Market, by Technology, 2016 – 2026 (USD Million)
      Table 9	North America AI in Agriculture Market, by Application, 2016 – 2026 (USD Million)
      Table 10 Europe AI in Agriculture Market, by Country, 2016 – 2026 (USD Million)
      Table 11 Europe AI in Agriculture Market, by Component, 2016 – 2026 (USD Million)
      Table 12 Europe AI in Agriculture Market, by Technology, 2016 – 2026 (USD Million)
      Table 13 Europe AI in Agriculture Market, by Application, 2016 – 2026 (USD Million)
      Table 14 Asia Pacific AI in Agriculture Market, by Country, 2016 – 2026 (USD Million)
      Table 15 Asia Pacific AI in Agriculture Market, by Component, 2016 – 2026 (USD Million)
      Table 16 Asia Pacific AI in Agriculture Market, by Technology, 2016 – 2026 (USD Million)
      Table 17 Asia Pacific AI in Agriculture Market, by Application, 2016 – 2026 (USD Million)
      Table 18 Latin America AI in Agriculture Market, by Country, 2016 – 2026 (USD Million)
      Table 19 Latin America AI in Agriculture Market, by Component, 2016 – 2026 (USD Million)
      Table 20 Latin America AI in Agriculture Market, by Technology, 2016 – 2026 (USD Million)
      Table 21 Latin America AI in Agriculture Market, by Application, 2016 – 2026 (USD Million)
      Table 22 The Middle-East and Africa AI in Agriculture Market, by Country, 2016 – 2026 (USD Million)
      Table 23 The Middle-East and Africa AI in Agriculture Market, by Component, 2016 – 2026 (USD Million)
      Table 24 The Middle-East and Africa AI in Agriculture Market, by Technology, 2016 – 2026 (USD Million)
      Table 25 The Middle-East and Africa AI in Agriculture Market, by Application, 2016 – 2026 (USD Million)
      Table 26 Global AI in Agriculture Market - Company Revenue Analysis, 2016 – 2020 (USD Million)
      Table 27 Global AI in Agriculture Market - Company Revenue Share Analysis, 2016 – 2020 (%)
      Table 28 Acquisitions and Mergers
      Table 29 Market Drivers – Impact Analysis
      Table 30 Market Restraints
      Table 31 Market Opportunities
      Table 32 Major Buyers of AI in Agriculture
      Table 33 Distributors/Traders of AI in Agriculture by Region
      

Industry Major Market Players

  • AgEagle Aerial Systems Inc.
  • GAMAYA
  • Deere & Company
  • Descartes Labs Inc.
  • ec2ce
  • Microsoft
  • IBM Corporation
  • Granular Inc.
  • VineView
  • Tule Technologies Inc.
  • The Climate Corporation
  • Taranis
  • Prospera Technologies
  • PrecisionHawk