![]()
Search Market Research Report
Agricultural Fumigants Market Size, Share Global Analysis Report, 2021 – 2026

Agricultural Fumigants Market By Product (1,3 Dichloropropene, Chloropicrin, Dimethyl Disulfide, Methyl Bromide, Metam Potassium, Metam Sodium, Phosphine, & Others), By Application (Soil & Others), By Form (Solid, Liquid, &Gas), And By Regions ¬ Global & Regional Industry Perspective, Comprehensive Analysis, and Forecast 2021 – 2026
Industry Insights
 Market Overview
Agricultural fumigants are pesticide gas that is administered into the soil or air in an effort to eliminate pests that are often associated with destroying crop-based food articles. They are used for the elimination of soil insects, weeds, nematodes, and rodents such as moles at times. Structural-based fumigation is often carried in order to get rid of bedbugs and termites by filling in the intended space created by a layer of toxic gas.
Industry Growth Factors
The global agricultural fumigants market is expected to experience significant growth due to the increasing popularity of agricultural fumigants to meet the rising infestation of pests and insects in warehouses coupled with rising awareness about chemical crop protection to name a few. Additionally, increasing urbanization coupled with preventive measures aimed at reducing post-harvest losses is expected to increase the footprint of the global agricultural fumigants market during the forecast period. Moreover, the rising prevalence of green and blue mold coupled with rising demands for maintaining the quality of food articles is expected to boost the growth of the global agricultural fumigants market during the forecast period.
The global agricultural fumigants market is expected to be driven by factors pertaining to the rising tolerance of pests associated with methyl bromide fumigation measures coupled with the rising adoption of suitable solutions against methyl bromide to name a few. Factors pertaining to rising development costs coupled with increasing product range in terms of organic-based compost are expected to fuel the growth of the global agricultural fumigants market during the forecast period. However, rising labor costs and volatile chemical compounds are expected to hamper the growth of the global agricultural fumigants market during the forecast period.
Segmentation Analysis
The global agricultural fumigants market is segmented into product, application, form, and region.
On the basis of product, the global agricultural fumigants market is divided into1,3 dichloropropene, chloropicrin, dimethyl disulfide, methyl bromide, metam potassium, metam sodium, phosphine, and others. The segment pertaining to 1,3 dichloropropene is expected to witness the largest market share during the advent of the forecast owing to lower vapor pressures coupled with increased degradation rate and higher levels of sorption coefficients to name a few. On the basis of application, the global agricultural fumigants market is categorized into soil and others. The segment pertaining to soil is expected to occupy the largest market share during the advent of the forecast owing to a majority of fumigants being of a phytotoxic nature coupled with the integration of these fumigants dependent upon a variety of soil properties. On the basis of form, the global agricultural fumigants market is fragmented into solid, liquid, and gas. The solid segment is expected to witness the largest market share during the advent of the forecast owing to an increased number of products in the form of powder, pellets, and tablets coupled with ease of application and lower chances of being exposed to radiation to name a few.
Report Scope
Report Attribute |
Details |
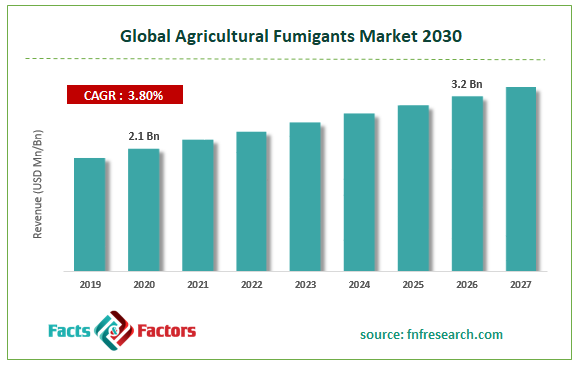
Market Size in 2020 |
USD 2.1 Billion |
Projected Market Size in 2026 |
USD 3.2 Billion |
CAGR Growth Rate |
3.8% CAGR |
Base Year |
2020 |
Forecast Years |
2021-2026 |
Key Market Players |
Bayer CropScience AG, The Dow Chemical Company, Great Lakes Solutions, Arkema, AMVAC Chemical Corporation, Syngenta AG, Chemtura Corporation, BASF SE, Trinity Manufacturing, Inc., Arysta LifeScience Limited, Novozymes, Solvay, Tessenderlo, Inc., and Intertek, among others |
Key Segments |
Products, Applications, Forms, and Region |
Major Regions Covered |
North America, Europe, Asia Pacific, Latin America, and Middle East & Africa |
Purchase Options |
Request customized purchase options to meet your research needs. Explore purchase options |
Regional Analysis
North America is expected to witness the largest market share during the advent of the forecast owing to the region is the home to multiple crop protection chemical manufacturers coupled with the rising need for sustainable agricultural lands to name a few. Additionally, the rising number of regulations to protect farming coupled with rising sustainability measures for crop-based articles is expected to increase the footprint of the global agricultural fumigants market during the forecast period. Asia-Pacific is expected to witness the fastest growing CAGR during the advent of the forecast owing to the region is the home to numerous macroeconomic factors such as rising availability and increased consumer awareness to name a few.
Competitive Players
The key market participants for the global agricultural fumigants market are:
- Bayer CropScience AG
- The Dow Chemical Company
- Great Lakes Solutions
- Arkema
- AMVAC Chemical Corporation
- Syngenta AG
- Chemtura Corporation
- BASF SE
- Trinity Manufacturing Inc.
- Arysta LifeScience Limited
- Novozymes
- Solvay
- Tessenderlo Inc.
- Intertek
By Product Segment Analysis
- 1,3 Dichloropropene
- Chloropicrin
- Dimethyl Disulfide
- Methyl Bromide
- Metam Potassium
- Metam Sodium
- Phosphine
- Others
By Application Segment Analysis
- Soil
- Others
By Form Segment Analysis
- Solid
- Liquid
- Gas
Table of Content
Industry Major Market Players
- Bayer CropScience AG
- The Dow Chemical Company
- Great Lakes Solutions
- Arkema
- AMVAC Chemical Corporation
- Syngenta AG
- Chemtura Corporation
- BASF SE
- Trinity Manufacturing Inc.
- Arysta LifeScience Limited
- Novozymes
- Solvay
- Tessenderlo Inc.
- Intertek


Copyright © 2025 - 2026, All Rights Reserved, Facts and Factors