Search Market Research Report

Discover Our Latest Reports
Discover Our Featured Reports
Discover Top Selling Reports

Gable Boxes Market Size, Share Global Analysis Report, , 2020 – 2026

report img

Gable Boxes Market By Material Type (Paper and Plastic) By Product Type (Flat Gable Boxes, Gable Box with Cup Holder and Window Style Gable Boxes), By End-Use (Food & Beverages, Cosmetics, Confectionery, Wine & Spirit, Personal Care, Pharmaceutical, Household Appliances, Consumer Electronics and Others): Global Industry Perspective, Comprehensive Analysis, and Forecast, 2020 – 2026

Industry Insights

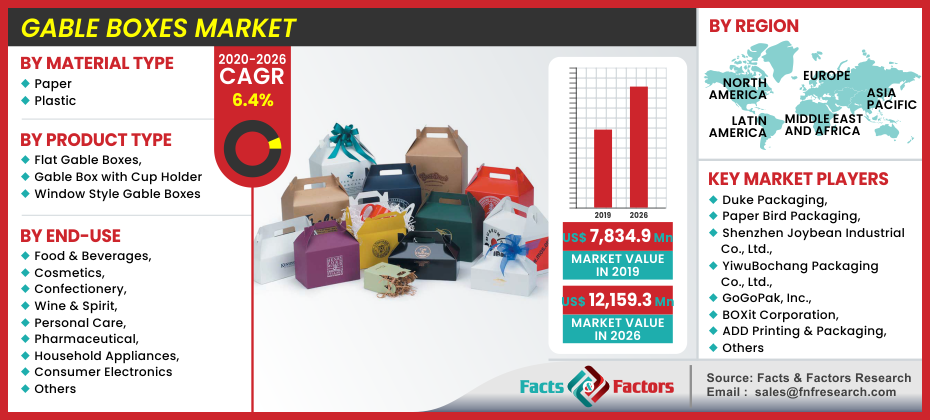
[195+ Pages Report] According to the report published by Facts and Factors, the global gable boxes market was valued at approximately USD 7,834.9 Million in 2019 and is expected to generate revenue of around USD 12,159.3 Million by end of 2026, growing at a CAGR of around 6.4% between 2020 and 2026.

logoMarket Overview       

The front or side of a building with a pitched roof is referred to as the gable. This is what a Gable box looks like. Gable boxes are a type of container that is most often used to carry food or party favors. The auto bottom of these handle boxes is square, and the top is triangular. The top ends of the triangular top fold up into the handle, which is connected by two narrow slits. Aside from that, there are a variety of other handle options, such as wire handles and so on.

logoIndustry Growth Factors

There is a range of reasons why these gable boxes are in such high demand. Cardboard sheets and paperboard materials are used to make them. These materials make the handle boxes light in weight while maintaining a high level of quality. Furthermore, this material is environmentally friendly, does not damage the environment, and is readily accessible. Because of these features, they are less costly for a wide range of consumers. Furthermore, cardboard materials are ideal for printing custom gable boxes. In addition, the increasing demand for gable boxes for gifting purposes is also predicted to support the growth of the gable boxes market in years to come.

Gable Boxes Market

To know more about this report | Request Free Sample Copy

logoSegmentation Analysis

The global Gable Boxes Market is segregated based on material type, product type, and end-use, and regions.

Paper and Plastic are the further bifurcations of the material type segment of the global gable boxes market. Moreover, the paper segment is classified into cardboard and corrugated paper. Based on product type, the global gable boxes market is categorized into flat gable boxes, gable boxes with cup holders, and window-style gable boxes. In addition, the global gable boxes market report also classified the end-user segments into food & beverages, cosmetics, confectionery, wine & spirit, personal care, pharmaceutical, household appliances, consumer electronics, and others.

logo Regional Analysis

From a regional standpoint, Asia Pacific is projected to maintain its dominance in the global Gable Boxes industry. Increasing disposable incomes paired with rising demand from India China and Japan are expected to drive the market in the Asia Pacific in coming years. High consumption of confectionery products is expected to propel the demand for gable boxes in North America and Europe region considerably in the analysis period.US and Germany held the majority revenue share in North America and Europe gable boxes market respectively. The Middle East and Africa are also expected to observe significant growth owing to demand from Muslim-dominated countries such as Saudi Arabia and the United Arab Emirates are expected to fuel demand for cosmetics.

logoReport Scope

Report Attribute

Details

Market Size in 2019

USD 7,834.9 Million

Projected Market Size in 2026

USD 12,159.3 Million

CAGR Growth Rate

6.4% CAGR

Base Year

2019

Forecast Years

2020-2026

Key Market Players

Duke Packaging, Paper Bird Packaging, Shenzhen Joybean Industrial Co., Ltd., YiwuBochang Packaging Co., Ltd., GoGoPak, Inc., BOXit Corporation, Guangzhou Huaisheng Packaging Co., Ltd., ADD Printing & Packaging, ZoxxBox, Dongguan AM Packaging Company Limited, Smurfit Kappa Group PLC, Shenzhen Mengsheng Paper Package Products Co., Ltd., Custom Packaging Pro., Box and Wrap, Llc., and  QingdaoYilucai Packaging Co., Ltd. amongst others.

Key Segment

By Material Type, By Product Type, By End Use, and By Region

Major Regions Covered

North America, Europe, Asia Pacific, Latin America, and the Middle East & Africa

Purchase Options

Request customized purchase options to meet your research needs. Explore purchase options

logo Competitive Players

Some main participants of the gable boxes market are:

  • Duke Packaging
  • Paper Bird Packaging
  • Shenzhen Joybean Industrial Co. Ltd.
  • YiwuBochang Packaging Co. Ltd.
  • GoGoPak, Inc.
  • BOXit Corporation
  • Guangzhou Huaisheng Packaging Co. Ltd.
  • ADD Printing & Packaging
  • ZoxxBox
  • Dongguan AM Packaging Company Limited
  • Smurfit Kappa Group PLC
  • Shenzhen Mengsheng Paper Package Products Co. Ltd.
  • Custom Packaging Pro.
  • Box and Wrap Llc.
  • QingdaoYilucai Packaging Co. Ltd.

logoGable Boxes Market: Regional Segment Analysis

  • North America
    • U.S.
    • Canada
  • Europe
    • UK
    • France
    • Germany
    • Italy
    • Spain
    • Rest of Europe
  • Asia Pacific
    • China
    • Japan
    • India
    • South Korea
    • Southeast Asia
    • Rest of Asia Pacific
  • Latin America
    • Brazil
    • Mexico
    • Rest of Latin America
  • Middle East and Africa
    • GCC Countries
    • South Africa
    • Rest of MEA

Table of Content

  1. Chapter 1 Executive Summary
    1. 1.1. Introduction of Gable Boxes
    2. 1.2. Global Gable Boxes Market, 2019 & 2026 (USD Million)
    3. 1.3. Global Gable Boxes Market, 2016 – 2026 (USD Million)
    4. 1.4. Global Gable Boxes Market Absolute Revenue Opportunity, 2016 – 2026 (USD Million)
    5. 1.5. Global Gable Boxes Market Incremental Revenue Opportunity, 2020 – 2026 (USD Million)
  2. Chapter 2 Gable Boxes Market – Material Type Analysis
    1. 2.1. Global Gable Boxes Market – Material Type Overview
    2. 2.2. Global Gable Boxes Market Share, by Material Type, 2019 & 2026 (USD Million)
    3. 2.3. Paper
      1. 2.3.1. Global Paper Gable Boxes Market, 2016 – 2026 (USD Million)
    4. 2.4. Plastic
      1. 2.4.1. Global Plastic Gable Boxes Market, 2016 – 2026 (USD Million)
  3. Chapter 3 Gable Boxes Market – Product Type Analysis
    1. 3.1. Global Gable Boxes Market – Product Type Overview
    2. 3.2. Global Gable Boxes Market Share, by Product Type, 2019 & 2026 (USD Million)
    3. 3.3. Flat Gable Boxes
      1. 3.3.1. Global Flat Gable Boxes Gable Boxes Market, 2016 – 2026 (USD Million)
    4. 3.4. Gable Box with Cup Holder
      1. 3.4.1. Global Gable Box with Cup Holder Gable Boxes Market, 2016 – 2026 (USD Million)
    5. 3.5. Window Style Gable Boxes
      1. 3.5.1. Global Window Style Gable Boxes Gable Boxes Market, 2016 – 2026 (USD Million)
  4. Chapter 4 Gable Boxes Market – End-Use Analysis
    1. 4.1. Global Gable Boxes Market – End-Use Overview
    2. 4.2. Global Gable Boxes Market Share, by End-Use, 2019 & 2026 (USD Million)
    3. 4.3. Food & Beverages
      1. 4.3.1. Global Food & Beverages Gable Boxes Market, 2016 – 2026 (USD Million)
    4. 4.4. Cosmetics
      1. 4.4.1. Global Cosmetics Gable Boxes Market, 2016 – 2026 (USD Million)
    5. 4.5. Confectionery
      1. 4.5.1. Global Confectionery Gable Boxes Market, 2016 – 2026 (USD Million)
    6. 4.6. Wine & Spirit
      1. 4.6.1. Global Wine & Spirit Gable Boxes Market, 2016 – 2026 (USD Million)
    7. 4.7. Personal Care
      1. 4.7.1. Global Personal Care Gable Boxes Market, 2016 – 2026 (USD Million)
    8. 4.8. Pharmaceutical
      1. 4.8.1. Global Pharmaceutical Gable Boxes Market, 2016 – 2026 (USD Million)
    9. 4.9. Household Appliances
      1. 4.9.1. Global Household Appliances Gable Boxes Market, 2016 – 2026 (USD Million)
    10. 4.10. Consumer Electronics
      1. 4.10.1. Global Consumer Electronics Gable Boxes Market, 2016 – 2026 (USD Million)
    11. 4.11. Others
      1. 4.11.1. Global Others Gable Boxes Market, 2016 – 2026 (USD Million)
  5. Chapter 5 Gable Boxes Market – Regional Analysis
    1. 5.1. Global Gable Boxes Market Regional Overview
    2. 5.2. Global Gable Boxes Market Share, by Region, 2019 & 2026 (USD Million)
    3. 5.3. North America
      1. 5.3.1. North America Gable Boxes Market, 2016 – 2026 (USD Million)
        1. 5.3.1.1. North America Gable Boxes Market, by Country, 2016 - 2026 (USD Million)
      2. 5.3.2. North America Gable Boxes Market, by Material Type, 2016 – 2026
        1. 5.3.2.1. North America Gable Boxes Market, by Material Type, 2016 – 2026 (USD Million)
      3. 5.3.3. North America Gable Boxes Market, by Product Type, 2016 – 2026
        1. 5.3.3.1. North America Gable Boxes Market, by Product Type, 2016 – 2026 (USD Million)
      4. 5.3.4. North America Gable Boxes Market, by End-Use, 2016 – 2026
        1. 5.3.4.1. North America Gable Boxes Market, by End-Use, 2016 – 2026 (USD Million)
      5. 5.3.5. U.S.
        1. 5.3.5.1. U.S. Gable Boxes Market, 2016 – 2026 (USD Million)
      6. 5.3.6. Canada
        1. 5.3.6.1. Canada Gable Boxes Market, 2016 – 2026 (USD Million)
    4. 5.4. Europe
      1. 5.4.1. Europe Gable Boxes Market, 2016 – 2026 (USD Million)
        1. 5.4.1.1. Europe Gable Boxes Market, by Country, 2016 - 2026 (USD Million)
      2. 5.4.2. Europe Gable Boxes Market, by Material Type, 2016 – 2026
        1. 5.4.2.1. Europe Gable Boxes Market, by Material Type, 2016 – 2026 (USD Million)
      3. 5.4.3. Europe Gable Boxes Market, by Product Type, 2016 – 2026
        1. 5.4.3.1. Europe Gable Boxes Market, by Product Type, 2016 – 2026 (USD Million)
      4. 5.4.4. Europe Gable Boxes Market, by End-Use, 2016 – 2026
        1. 5.4.4.1. Europe Gable Boxes Market, by End-Use, 2016 – 2026 (USD Million)
      5. 5.4.5. Germany
        1. 5.4.5.1. Germany Gable Boxes Market, 2016 – 2026 (USD Million)
      6. 5.4.6. France
        1. 5.4.6.1. France Gable Boxes Market, 2016 – 2026 (USD Million)
      7. 5.4.7. U.K.
        1. 5.4.7.1. U.K. Gable Boxes Market, 2016 – 2026 (USD Million)
      8. 5.4.8. Italy
        1. 5.4.8.1. Italy Gable Boxes Market, 2016 – 2026 (USD Million)
      9. 5.4.9. Spain
        1. 5.4.9.1. Spain Gable Boxes Market, 2016 – 2026 (USD Million)
      10. 5.4.10. Rest of Europe
        1. 5.4.10.1. Rest of Europe Gable Boxes Market, 2016 – 2026 (USD Million)
    5. 5.5. Asia Pacific
      1. 5.5.1. Asia Pacific Gable Boxes Market, 2016 – 2026 (USD Million)
        1. 5.5.1.1. Asia Pacific Gable Boxes Market, by Country, 2016 - 2026 (USD Million)
      2. 5.5.2. Asia Pacific Gable Boxes Market, by Material Type, 2016 – 2026
        1. 5.5.2.1. Asia Pacific Gable Boxes Market, by Material Type, 2016 – 2026 (USD Million)
      3. 5.5.3. Asia Pacific Gable Boxes Market, by Product Type, 2016 – 2026
        1. 5.5.3.1. Asia Pacific Gable Boxes Market, by Product Type, 2016 – 2026 (USD Million)
      4. 5.5.4. Asia Pacific Gable Boxes Market, by End-Use, 2016 – 2026
        1. 5.5.4.1. Asia Pacific Gable Boxes Market, by End-Use, 2016 – 2026 (USD Million)
      5. 5.5.5. China
        1. 5.5.5.1. China Gable Boxes Market, 2016 – 2026 (USD Million)
      6. 5.5.6. Japan
        1. 5.5.6.1. Japan Gable Boxes Market, 2016 – 2026 (USD Million)
      7. 5.5.7. India
        1. 5.5.7.1. India Gable Boxes Market, 2016 – 2026 (USD Million)
      8. 5.5.8. South Korea
        1. 5.5.8.1. South Korea Gable Boxes Market, 2016 – 2026 (USD Million)
      9. 5.5.9. South-East Asia
        1. 5.5.9.1. South-East Asia Gable Boxes Market, 2016 – 2026 (USD Million)
      10. 5.5.10. Rest of Asia Pacific
        1. 5.5.10.1. Rest of Asia Pacific Gable Boxes Market, 2016 – 2026 (USD Million)
    6. 5.6. Latin America
      1. 5.6.1. Latin America Gable Boxes Market, 2016 – 2026 (USD Million)
        1. 5.6.1.1. Latin America Gable Boxes Market, by Country, 2016 - 2026 (USD Million)
      2. 5.6.2. Latin America Gable Boxes Market, by Material Type, 2016 – 2026
        1. 5.6.2.1. Latin America Gable Boxes Market, by Material Type, 2016 – 2026 (USD Million)
      3. 5.6.3. Latin America Gable Boxes Market, by Product Type, 2016 – 2026
        1. 5.6.3.1. Latin America Gable Boxes Market, by Product Type, 2016 – 2026 (USD Million)
      4. 5.6.4. Latin America Gable Boxes Market, by End-Use, 2016 – 2026
        1. 5.6.4.1. Latin America Gable Boxes Market, by End-Use, 2016 – 2026 (USD Million)
      5. 5.6.5. Brazil
        1. 5.6.5.1. Brazil Gable Boxes Market, 2016 – 2026 (USD Million)
      6. 5.6.6. Mexico
        1. 5.6.6.1. Mexico Gable Boxes Market, 2016 – 2026 (USD Million)
      7. 5.6.7. Rest of Latin America
        1. 5.6.7.1. Rest of Latin America Gable Boxes Market, 2016 – 2026 (USD Million)
    7. 5.7. The Middle-East and Africa
      1. 5.7.1. The Middle-East and Africa Gable Boxes Market, 2016 – 2026 (USD Million)
        1. 5.7.1.1. The Middle-East and Africa Gable Boxes Market, by Country, 2016 - 2026 (USD Million)
      2. 5.7.2. The Middle-East and Africa Gable Boxes Market, by Material Type, 2016 – 2026
        1. 5.7.2.1. The Middle-East and Africa Gable Boxes Market, by Material Type, 2016 – 2026 (USD Million)
      3. 5.7.3. The Middle-East and Africa Gable Boxes Market, by Product Type, 2016 – 2026
        1. 5.7.3.1. The Middle-East and Africa Gable Boxes Market, by Product Type, 2016 – 2026 (USD Million)
      4. 5.7.4. The Middle-East and Africa Gable Boxes Market, by End-Use, 2016 – 2026
        1. 5.7.4.1. The Middle-East and Africa Gable Boxes Market, by End-Use, 2016 – 2026 (USD Million)
      5. 5.7.5. GCC Countries
        1. 5.7.5.1. GCC Countries Gable Boxes Market, 2016 – 2026 (USD Million)
      6. 5.7.6. South Africa
        1. 5.7.6.1. South Africa Gable Boxes Market, 2016 – 2026 (USD Million)
      7. 5.7.7. Rest of Middle-East Africa
        1. 5.7.7.1. Rest of Middle-East Africa Gable Boxes Market, 2016 – 2026 (USD Million)
  6. Chapter 6 Gable Boxes Market – Competitive Landscape
    1. 6.1. Competitor Market Share – Revenue
    2. 6.2. Market Concentration Rate Analysis, Top 3 and Top 5 Players
    3. 6.3. Strategic Developments
      1. 6.3.1. Acquisitions and Mergers
      2. 6.3.2. New Products
      3. 6.3.3. Research & Development Activities
  7. Chapter 7 Company Profiles
    1. 7.1. Smurfit Kappa Group PLC
      1. 7.1.1. Company Overview
      2. 7.1.2. Product/Service Portfolio
      3. 7.1.3. Smurfit Kappa Group PLC Sales, Revenue, and Gross Margin
      4. 7.1.4. Smurfit Kappa Group PLC Revenue and Growth Rate
      5. 7.1.5. Smurfit Kappa Group PLC Market Share
      6. 7.1.6. Recent Initiatives, Funding/VC Activities, and Technological Innovations
    2. 7.2. Shenzhen Mengsheng Paper Package Products Co., Ltd.,
      1. 7.2.1. Company Overview
      2. 7.2.2. Product/Service Portfolio
      3. 7.2.3. Shenzhen Mengsheng Paper Package Products Co., Ltd., Sales, Revenue, and Gross Margin
      4. 7.2.4. Shenzhen Mengsheng Paper Package Products Co., Ltd., Revenue and Growth Rate
      5. 7.2.5. Shenzhen Mengsheng Paper Package Products Co., Ltd., Market Share
      6. 7.2.6. Recent Initiatives, Funding/VC Activities, and Technological Innovations
    3. 7.3. Duke Packaging
      1. 7.3.1. Company Overview
      2. 7.3.2. Product/Service Portfolio
      3. 7.3.3. Duke Packaging Sales, Revenue, and Gross Margin
      4. 7.3.4. Duke Packaging Revenue and Growth Rate
      5. 7.3.5. Duke Packaging Market Share
      6. 7.3.6. Recent Initiatives, Funding/VC Activities, and Technological Innovations
    4. 7.4. Paper Bird Packaging
      1. 7.4.1. Company Overview
      2. 7.4.2. Product/Service Portfolio
      3. 7.4.3. Paper Bird Packaging Sales, Revenue, and Gross Margin
      4. 7.4.4. Paper Bird Packaging Revenue and Growth Rate
      5. 7.4.5. Paper Bird Packaging Market Share
      6. 7.4.6. Recent Initiatives, Funding/VC Activities, and Technological Innovations
    5. 7.5. BOXit Corporation
      1. 7.5.1. Company Overview
      2. 7.5.2. Product/Service Portfolio
      3. 7.5.3. BOXit Corporation Sales, Revenue, and Gross Margin
      4. 7.5.4. BOXit Corporation Revenue and Growth Rate
      5. 7.5.5. BOXit Corporation Market Share
      6. 7.5.6. Recent Initiatives, Funding/VC Activities, and Technological Innovations
    6. 7.6. Guangzhou Huaisheng Packaging Co., Ltd.
      1. 7.6.1. Company Overview
      2. 7.6.2. Product/Service Portfolio
      3. 7.6.3. Guangzhou Huaisheng Packaging Co., Ltd. Sales, Revenue, and Gross Margin
      4. 7.6.4. Guangzhou Huaisheng Packaging Co., Ltd. Revenue and Growth Rate
      5. 7.6.5. Guangzhou Huaisheng Packaging Co., Ltd. Market Share
      6. 7.6.6. Recent Initiatives, Funding/VC Activities, and Technological Innovations
    7. 7.7. ADD Printing & Packaging
      1. 7.7.1. Company Overview
      2. 7.7.2. Product/Service Portfolio
      3. 7.7.3. ADD Printing & Packaging Sales, Revenue, and Gross Margin
      4. 7.7.4. ADD Printing & Packaging Revenue and Growth Rate
      5. 7.7.5. ADD Printing & Packaging Market Share
      6. 7.7.6. Recent Initiatives, Funding/VC Activities, and Technological Innovations
    8. 7.8. ZoxxBox
      1. 7.8.1. Company Overview
      2. 7.8.2. Product/Service Portfolio
      3. 7.8.3. ZoxxBox Sales, Revenue, and Gross Margin
      4. 7.8.4. ZoxxBox Revenue and Growth Rate
      5. 7.8.5. ZoxxBox Market Share
      6. 7.8.6. Recent Initiatives, Funding/VC Activities, and Technological Innovations
    9. 7.9. Custom Packaging Pro.
      1. 7.9.1. Company Overview
      2. 7.9.2. Product/Service Portfolio
      3. 7.9.3. Custom Packaging Pro. Sales, Revenue, and Gross Margin
      4. 7.9.4. Custom Packaging Pro. Revenue and Growth Rate
      5. 7.9.5. Custom Packaging Pro. Market Share
      6. 7.9.6. Recent Initiatives, Funding/VC Activities, and Technological Innovations
    10. 7.10. Shenzhen Joybean Industrial Co., Ltd.
      1. 7.10.1. Company Overview
      2. 7.10.2. Product/Service Portfolio
      3. 7.10.3. Shenzhen Joybean Industrial Co., Ltd. Sales, Revenue, and Gross Margin
      4. 7.10.4. Shenzhen Joybean Industrial Co., Ltd. Revenue and Growth Rate
      5. 7.10.5. Shenzhen Joybean Industrial Co., Ltd. Market Share
      6. 7.10.6. Recent Initiatives, Funding/VC Activities, and Technological Innovations
    11. 7.11. YiwuBochang Packaging Co., Ltd.
      1. 7.11.1. Company Overview
      2. 7.11.2. Product/Service Portfolio
      3. 7.11.3. YiwuBochang Packaging Co., Ltd. Sales, Revenue, and Gross Margin
      4. 7.11.4. YiwuBochang Packaging Co., Ltd. Revenue and Growth Rate
      5. 7.11.5. YiwuBochang Packaging Co., Ltd. Market Share
      6. 7.11.6. Recent Initiatives, Funding/VC Activities, and Technological Innovations
    12. 7.12. Box and Wrap, Llc.
      1. 7.12.1. Company Overview
      2. 7.12.2. Product/Service Portfolio
      3. 7.12.3. Box and Wrap, Llc. Sales, Revenue, and Gross Margin
      4. 7.12.4. Box and Wrap, Llc. Revenue and Growth Rate
      5. 7.12.5. Box and Wrap, Llc. Market Share
      6. 7.12.6. Recent Initiatives, Funding/VC Activities, and Technological Innovations
    13. 7.13. Qingdao Yilucai Packaging Co., Ltd.
      1. 7.13.1. Company Overview
      2. 7.13.2. Product/Service Portfolio
      3. 7.13.3. Qingdao Yilucai Packaging Co., Ltd. Sales, Revenue, and Gross Margin
      4. 7.13.4. Qingdao Yilucai Packaging Co., Ltd. Revenue and Growth Rate
      5. 7.13.5. Qingdao Yilucai Packaging Co., Ltd. Market Share
      6. 7.13.6. Recent Initiatives, Funding/VC Activities, and Technological Innovations
    14. 7.14. Dongguan AM Packaging Company Limited
      1. 7.14.1. Company Overview
      2. 7.14.2. Product/Service Portfolio
      3. 7.14.3. Dongguan AM Packaging Company Limited Sales, Revenue, and Gross Margin
      4. 7.14.4. Dongguan AM Packaging Company Limited Revenue and Growth Rate
      5. 7.14.5. Dongguan AM Packaging Company Limited Market Share
      6. 7.14.6. Recent Initiatives, Funding/VC Activities, and Technological Innovations
    15. 7.15. GoGoPak, Inc
      1. 7.15.1. Company Overview
      2. 7.15.2. Product/Service Portfolio
      3. 7.15.3. GoGoPak, Inc Sales, Revenue, and Gross Margin
      4. 7.15.4. GoGoPak, Inc Revenue and Growth Rate
      5. 7.15.5. GoGoPak, Inc Market Share
      6. 7.15.6. Recent Initiatives, Funding/VC Activities, and Technological Innovations
  8. Chapter 8 Gable Boxes — Industry Analysis
    1. 8.1. Introduction and Taxonomy
    2. 8.2. Gable Boxes Market – Key Trends
      1. 8.2.1. Market Drivers
      2. 8.2.2. Market Restraints
      3. 8.2.3. Market Opportunities
    3. 8.3. Value Chain Analysis
    4. 8.4. Key Mandates and Regulations
    5. 8.5. Technology Roadmap and Timeline
    6. 8.6. Gable Boxes Market – Attractiveness Analysis
      1. 8.6.1. By Material Type
      2. 8.6.2. By Product Type
      3. 8.6.3. By End-Use
      4. 8.6.4. By Region
  9. Chapter 9 Industrial Chain, Sourcing Strategy, and Downstream Buyers
    1. 9.1. Gable Boxes Industrial Chain Analysis
    2. 9.2. Downstream Buyers
    3. 9.3. Distributors/Traders List
  10. Chapter 10 Marketing Strategy Analysis
    1. 10.1. Marketing Channel
    2. 10.2. Direct Marketing
    3. 10.3. Indirect Marketing
    4. 10.4. Marketing Channel Development Trends
    5. 10.5. Economic/Political Environmental Change
  11. Chapter 11 Report Conclusion & Key Insights
    1. 11.1. Key Insights from Primary Interviews &Surveys Respondents
    2. 11.2. Key Takeaways from Analysts, Consultants, and Industry Leaders
  12. Chapter 12 Research Approach & Methodology
    1. 12.1. Report Description
    2. 12.2. Research Scope
    3. 12.3. Research Methodology
      1. 12.3.1. Secondary Research
      2. 12.3.2. Primary Research
      3. 12.3.3. Statistical Models
        1. 12.3.3.1. Company Share Analysis Model
        2. 12.3.3.2. Revenue Based Modeling
      4. 12.3.4. Research Limitations

      List of Figures

      Fig.1	Product Picture of Gable Boxes
      Fig.2	Global Gable Boxes Market, 2016 – 2026 (USD Million)
      Fig.3	Global Gable Boxes Market Absolute Revenue Opportunity, 2016 – 2026 (USD Million)
      Fig.4	Global Gable Boxes Market Incremental Revenue Opportunity, 2020 – 2026 (USD Million)
      Fig.5	Global Gable Boxes Market Share, by Material Type, 2019 & 2026 (USD Million)
      Fig.6	Global Paper Gable Boxes Market, 2016 – 2026 (USD Million)
      Fig.7	Global Plastic Gable Boxes Market, 2016 – 2026 (USD Million)
      Fig.8	Global Gable Boxes Market Share, by Product Type, 2019 & 2026 (USD Million)
      Fig.9	Global Flat Gable Boxes Gable Boxes Market, 2016 – 2026 (USD Million)
      Fig.10	Global Gable Box with Cup Holder Gable Boxes Market, 2016 – 2026 (USD Million)
      Fig.11	Global Window Style Gable Boxes Gable Boxes Market, 2016 – 2026 (USD Million)
      Fig.12	Global Gable Boxes Market Share, by End-Use, 2019 & 2026 (USD Million)
      Fig.13	Global Food & Beverages Gable Boxes Market, 2016 – 2026 (USD Million)
      Fig.14	Global Cosmetics Gable Boxes Market, 2016 – 2026 (USD Million)
      Fig.15	Global Confectionery Gable Boxes Market, 2016 – 2026 (USD Million)
      Fig.16	Global Wine & Spirit Gable Boxes Market, 2016 – 2026 (USD Million)
      Fig.17	Global Personal Care Gable Boxes Market, 2016 – 2026 (USD Million)
      Fig.18	Global Pharmaceutical Gable Boxes Market, 2016 – 2026 (USD Million)
      Fig.19	Global Household Appliances Gable Boxes Market, 2016 – 2026 (USD Million)
      Fig.20	Global Consumer Electronics Gable Boxes Market, 2016 – 2026 (USD Million)
      Fig.21	Global Others Gable Boxes Market, 2016 – 2026 (USD Million)
      Fig.22	Global Gable Boxes Market Share, by Region, 2019 & 2026 (USD Million)
      Fig.23	North America Gable Boxes Market, 2016 – 2026 (USD Million)
      Fig.24	U.S. Gable Boxes Market, 2016 – 2026 (USD Million)
      Fig.25	Canada Gable Boxes Market, 2016 – 2026 (USD Million)
      Fig.26	Europe Gable Boxes Market, 2016 – 2026 (USD Million)
      Fig.27	Germany Gable Boxes Market, 2016 – 2026 (USD Million)
      Fig.28	France Gable Boxes Market, 2016 – 2026 (USD Million)
      Fig.29	U.K. Gable Boxes Market, 2016 – 2026 (USD Million)
      Fig.30	Italy Gable Boxes Market, 2016 – 2026 (USD Million)
      Fig.31	Spain Gable Boxes Market, 2016 – 2026 (USD Million)
      Fig.32	Rest of Europe Gable Boxes Market, 2016 – 2026 (USD Million)
      Fig.33	Asia Pacific Gable Boxes Market, 2016 – 2026 (USD Million)
      Fig.34	China Gable Boxes Market, 2016 – 2026 (USD Million)
      Fig.35	Japan Gable Boxes Market, 2016 – 2026 (USD Million)
      Fig.36	India Gable Boxes Market, 2016 – 2026 (USD Million)
      Fig.37	South  Korea Gable Boxes Market, 2016 – 2026 (USD Million)
      Fig.38	South-East Asia Gable Boxes Market, 2016 – 2026 (USD Million)
      Fig.39	Rest of Asia Pacific Gable Boxes Market, 2016 – 2026 (USD Million)
      Fig.40	Latin America Gable Boxes Market, 2016 – 2026 (USD Million)
      Fig.41	Brazil Gable Boxes Market, 2016 – 2026 (USD Million)
      Fig.42	Mexico Gable Boxes Market, 2016 – 2026 (USD Million)
      Fig.43	Rest of Latin America Gable Boxes Market, 2016 – 2026 (USD Million)
      Fig.44	The Middle-East and Africa Gable Boxes Market, 2016 – 2026 (USD Million)
      Fig.45	GCC Countries Gable Boxes Market, 2016 – 2026 (USD Million)
      Fig.46	South Africa Gable Boxes Market, 2016 – 2026 (USD Million)
      Fig.47	Rest of Middle-East Africa Gable Boxes Market, 2016 – 2026 (USD Million)
      Fig.48	Competitor Market Share – Revenue
      Fig.49	Smurfit Kappa Group PLC Revenue and Growth Rate
      Fig.50	Smurfit Kappa Group PLC Market Share
      Fig.51	Shenzhen Mengsheng Paper Package Products Co., Ltd., Revenue and Growth Rate
      Fig.52	Shenzhen Mengsheng Paper Package Products Co., Ltd., Market Share
      Fig.53	Duke Packaging Revenue and Growth Rate
      Fig.54	Duke Packaging Market Share
      Fig.55	Paper Bird Packaging Revenue and Growth Rate
      Fig.56	Paper Bird Packaging Market Share
      Fig.57	BOXit Corporation Revenue and Growth Rate
      Fig.58	BOXit Corporation Market Share
      Fig.59	Guangzhou Huaisheng Packaging Co., Ltd. Revenue and Growth Rate
      Fig.60	Guangzhou Huaisheng Packaging Co., Ltd. Market Share
      Fig.61	ADD Printing & Packaging Revenue and Growth Rate
      Fig.62	ADD Printing & Packaging Market Share
      Fig.63	ZoxxBox Revenue and Growth Rate
      Fig.64	ZoxxBox Market Share
      Fig.65	Custom Packaging Pro. Revenue and Growth Rate
      Fig.66	Custom Packaging Pro. Market Share
      Fig.67	Shenzhen Joybean Industrial Co., Ltd. Revenue and Growth Rate
      Fig.68	Shenzhen Joybean Industrial Co., Ltd. Market Share
      Fig.69	YiwuBochang Packaging Co., Ltd. Revenue and Growth Rate
      Fig.70	YiwuBochang Packaging Co., Ltd. Market Share
      Fig.71	Box and Wrap, Llc. Revenue and Growth Rate
      Fig.72	Box and Wrap, Llc. Market Share
      Fig.73	Qingdao Yilucai Packaging Co., Ltd. Revenue and Growth Rate
      Fig.74	Qingdao Yilucai Packaging Co., Ltd. Market Share
      Fig.75	Dongguan AM Packaging Company Limited Revenue and Growth Rate
      Fig.76	Dongguan AM Packaging Company Limited Market Share
      Fig.77	GoGoPak, Inc Revenue and Growth Rate
      Fig.78	GoGoPak, Inc Market Share
      Fig.79	Market Dynamics
      Fig.80	Global Gable Boxes – Value Chain Analysis
      Fig.81	Key Mandates and Regulations
      Fig.82	Technology Roadmap and Timeline
      Fig.83	Market Attractiveness Analysis – By Material Type
      Fig.84	Market Attractiveness Analysis – By Product Type
      Fig.85	Market Attractiveness Analysis – By End-Use
      Fig.86	Market Attractiveness Analysis – By Region
      Fig.87	Gable Boxes Industrial Chain Analysis
      Fig.88	Market Channels
      Fig.89	Marketing Channel Development Trend
      Fig.90	Growth in World Gross Product, 2008-2018
      

      List of Tables

      Table 1	Global Gable Boxes Market, 2019 & 2026 (USD Million)
      Table 2	Global Gable Boxes Market, by Material Type, 2016 – 2026 (USD Million)
      Table 3	Global Gable Boxes Market, by Product Type, 2016 – 2026 (USD Million)
      Table 4	Global Gable Boxes Market, by End-Use, 2016 – 2026 (USD Million)
      Table 5	Global Gable Boxes Market, by Region, 2016 – 2026 (USD Million)
      Table 6	North America Gable Boxes Market, by Country, 2016 – 2026 (USD Million)
      Table 7	North America Gable Boxes Market, by Material Type, 2016 – 2026 (USD Million)
      Table 8	North America Gable Boxes Market, by Product Type, 2016 – 2026 (USD Million)
      Table 9	North America Gable Boxes Market, by End-Use, 2016 – 2026 (USD Million)
      Table 10 Europe Gable Boxes Market, by Country, 2016 – 2026 (USD Million)
      Table 11 Europe Gable Boxes Market, by Material Type, 2016 – 2026 (USD Million)
      Table 12 Europe Gable Boxes Market, by Product Type, 2016 – 2026 (USD Million)
      Table 13 Europe Gable Boxes Market, by End-Use, 2016 – 2026 (USD Million)
      Table 14 Asia Pacific Gable Boxes Market, by Country, 2016 – 2026 (USD Million)
      Table 15 Asia Pacific Gable Boxes Market, by Material Type, 2016 – 2026 (USD Million)
      Table 16 Asia Pacific Gable Boxes Market, by Product Type, 2016 – 2026 (USD Million)
      Table 17 Asia Pacific Gable Boxes Market, by End-Use, 2016 – 2026 (USD Million)
      Table 18 Latin America Gable Boxes Market, by Country, 2016 – 2026 (USD Million)
      Table 19 Latin America Gable Boxes Market, by Material Type, 2016 – 2026 (USD Million)
      Table 20 Latin America Gable Boxes Market, by Product Type, 2016 – 2026 (USD Million)
      Table 21 Latin America Gable Boxes Market, by End-Use, 2016 – 2026 (USD Million)
      Table 22 The Middle-East and Africa Gable Boxes Market, by Country, 2016 – 2026 (USD Million)
      Table 23 The Middle-East and Africa Gable Boxes Market, by Material Type, 2016 – 2026 (USD Million)
      Table 24 The Middle-East and Africa Gable Boxes Market, by Product Type, 2016 – 2026 (USD Million)
      Table 25 The Middle-East and Africa Gable Boxes Market, by End-Use, 2016 – 2026 (USD Million)
      Table 26 Global Gable Boxes Market - Company Revenue Analysis, 2016 – 2019 (USD Million)
      Table 27 Global Gable Boxes Market - Company Revenue Share Analysis, 2016 – 2019 (%)
      Table 28 Acquisitions and Mergers
      Table 29 Market Drivers – Impact Analysis
      Table 30 Market Restraints
      Table 31 Market Opportunities
      Table 32 Major Buyers of Gable Boxes
      Table 33 Distributors/Traders of Gable Boxes by Region
      

Industry Major Market Players

  • Duke Packaging
  • Paper Bird Packaging
  • Shenzhen Joybean Industrial Co. Ltd.
  • YiwuBochang Packaging Co. Ltd.
  • GoGoPak, Inc.
  • BOXit Corporation
  • Guangzhou Huaisheng Packaging Co. Ltd.
  • ADD Printing & Packaging
  • ZoxxBox
  • Dongguan AM Packaging Company Limited
  • Smurfit Kappa Group PLC
  • Shenzhen Mengsheng Paper Package Products Co. Ltd.
  • Custom Packaging Pro.
  • Box and Wrap Llc.
  • QingdaoYilucai Packaging Co. Ltd.